

1 Introduction
Metal nanoparticles are of great fundamental and practical interest due to their unique physical properties, chemical reactivity, and potential applications in electronics, catalysis, and biochemistry [1]. Nanoparticles of many metals such as gold [2,3], platinum [4], palladium [5], ruthenium [6], and silver [7] have been studied with a wide variety of experimental techniques. The importance of ruthenium lies in its unique activity as a catalyst for different synthesis and redox processes [8]. Also, due to the different oxidation states of ruthenium derivatives and their electrochemical reversibility, these compounds have been used as excellent electron transfer mediators for the modification of different electrode surfaces [9].
Catecholamines, such as adrenaline (AD), are an important kind of compounds for the message transfer in the mammalian central nervous system. They exist as an organic cation in the nervous tissue and the biological body fluid [10,11]. AD in the body affects the regulation of blood pressure and the heart rate, lipolysis, immune system, and glycogen metabolism [12]. Many life phenomena are related to the concentration of AD in blood [13]. Low levels of AD have been found in patients with Parkinson's disease [14,15]. Thus, it is significant to develop a method for the quantitative determination of AD in order to study its physiological function and to diagnose some diseases in clinical medicine [16]. Different methods have been reported for the quantitative determination of AD [17–25]. Among them, electrochemical methods are of particular importance [22–25]. Ease of operation, low cost, small value of required analyte, and high sensitivity are the advantages of electrochemical methods over all other methods.
Uric acid (UA) is a chief nitrogenous component of biological fluids such as urine and blood serum [26]. This compound is a relatively water-insoluble end product of purine metabolism in humans and is excreted via urine [27]. Abnormal levels of UA are liable to result in several diseases such as gout, hyperuricemia, and pneumonia [28]. An elevated UA concentration in serum causes kidney damages and cardiovascular diseases [29]. In a healthy human being, the typical concentration of UA in urine is within a mili-molar range (∼ 2 mM), whereas in blood it is in a micro-molar range (120–450 μM) [30]. Thus, the detection of UA level dissolved in human physiological fluids is indispensable for the diagnosis of patients suffering from these disorders associated with altered purine biosynthesis and catabolism. Various techniques have been developed to determine UA concentration [31–36]. Among the various methods used to detect uric acid, electrochemical methods are known to be the most popular because a low detection limit, high selectivity, and sensitivity can be easily acquired where matrix plays an important role [26–30,37–39].
Amino acids are known to be precursors for various significant biological substances. Cysteine (2-amino-3-mercaptopropanoic acid, Cys) is one of the 20 amino acids commonly found in natural proteins [40]. It is widely used in the food industry as an antioxidant and in the pharmaceutical industry for drug formulation [41]. Cysteine also has several pharmaceutical applications; it is used in some antibiotics and for the treatment of skin damages and as a radioprotective agent [42]. Cysteine is critical for the proper metabolism of a number of essential biochemicals such as heparin, biotin, lipoid acid, coenzyme A, and glutathione. It has been used as a prospective radiation protector and cancer indicator in a number of pathological conditions including Parkinson's and Alzheimer's diseases as well as autoimmune deficiency syndrome (AIDS) [43]. Therefore, it is important to determine Cys in many biological, medical, and clinical studies. Due to its crucial role in biological functions and its clinical significance, many attempts have been made to determine Cys [44–49]. Compared with other methods, electrochemical detection offers inherent advantages of simplicity, ease of miniaturization, high sensitivity, and relatively low cost [50–52].
A major problem to detect AD is the interference from UA, which largely coexists with neurotransmitters in body fluids and has a nearly identical oxidation potential range on unmodified electrodes [53,54]. Also, the response of highly concentrated UA interferes with and/or blocks the detection signals of Cys [55]. So, the simultaneous detection of AD, UA, and Cys in a mixture is quite attractive to biological and chemical research.
A bifunctional electrocatalyst is able to catalyze the redox reaction of two species simultaneously. Developing such an electrocatalyst has been a challenge in recent years [9,56–58]. In our previous studies, we introduced new bifunctional sensors for the simultaneous electrocatalytic oxidation of hydrazine-hydroxylamine [9] and ascorbic acid-glutathione [58] in mixtures. The aim of the present work is to utilize a ruthenium oxide nanoparticles modified glassy carbon electrode (RuON-GCE) as a bifunctional electrocatalyst for the electrocatalytic oxidation of AD and UA. In addition, the modified electrode has been used successfully for the simultaneous determination of AD, UA, and Cys in a mixture.
2 Experimental
Adrenaline (AD), uric acid (UA), cysteine (Cys), RuCl3·xH2O, hydrochloric acid, phosphoric acid, and 0.05 μm analytical reagent grade alumina were purchased from Merck and used as received. An injection solution of AD (from Darou Pakhsh, Iran) was purchased in a local drugstore. The required phosphate buffer solutions (0.1 M) were prepared with H3PO4, and the pH was adjusted with 2.0 M NaOH. All the aqueous solutions were prepared with doubly distilled water. UA, AD, and Cys solutions were prepared just prior to use and all the experiments were carried out at room temperature.
To prepare the modified electrode at first, a glassy carbon electrode (GCE) was carefully polished mechanically with a 0.05 μm Al2O3 slurry on a polishing cloth to a mirror finish and then rinsed with doubly distilled water. Then the cleaned bare GCE (BGCE) was modified as described in the literature [9]. In brief, BGCE was immersed in a 0.1 M HCl solution containing about 1.0 mM of ruthenium (III) chloride, and the ruthenium oxide nanoparticles were electrodeposited on the electrode surface by 20 cycles of a potential scan between −500 and 1700 mV at 50 mV/s. The ruthenium oxide nanoparticle modified glassy carbon electrode (RuON−GCE) was rinsed thoroughly with water and placed in a 0.1 M phosphate buffer solution (pH 2.0). Subsequently, the potential was scanned for 10 cycles at 100 mV/s over the −300 to 600 mV range so as to obtain a stable redox response for the surface immobilized film. The results show that the current response of the redox couples first decreases and then remains almost constant. The initial decay of the current response may be due to the removal of RuON that is weakly adsorbed to the electrode surface.
An Autolab potentiostat-golvanostat PGSTAT 30 (Eco Chemie, Ultrecht, the Netherlands) equipped with a GPES 4.9 software, in conjunction with a three-electrode system and a personal computer, was used for electrochemical measurements. A saturated calomel reference electrode (SCE), a platinum wire counter electrode, and ruthenium oxide nanoparticles electrodeposited on a GCE (RuON-GCE) intended as a working electrode were employed for the electrochemical studies. The pH was measured with a Metrohm model 691 pH/mV-meter. The morphology of the BGCE and RuO-GCE surfaces was characterized by scanning electron microscopy (LEO 4401, UK) at an acceleration voltage of 20 kV. As previously described [9], the surface morphologies of BGCE and RuON-GCE are indicated when RuON are electrodeposited on the BGCE surface. The scanning electron microscopy, SEM, of bare GCE and RuON−GCE are given on Scheme S1. A comparison of Scheme S1A and S1B indicates that the nanoparticles of the ruthenium oxide with a size of approximately 50 to 100 nm are distributed on the BGCE surface. As demonstrated in the literature [59–62], the distributed nanoparticles are ruthenium oxide nanoparticles.
3 Results and discussion
3.1 Application of RuON as a bifunctional electrocatalyst for oxidation of uric acid and adrenaline
As in Fig. 1A, the cyclic voltammogram of RuON-GCE at pH 7.0 shows three well-defined redox couples with conditional formal potentials of −10 mV (redox couple 1/1′), 170 mV (redox couple 2/2′) and 280 mV (redox couple 3/3′) which correspond to the electrodeposited mixed-valence ruthenium oxide nanoparticles (RuON) [9,59–62], when the potential scan is done between −200 and 600 mV. This result is in agreement with those reported in the literature [9,59–62].

(A) Cyclic voltammogram of a RuON−GCE in a 0.1 M phosphate buffer solution (pH 7.0) at potential scan rate of 100 mV/s. (B) Cyclic voltammograms of a 0.1 M phosphate buffer solution (pH 7.0) containing of a 1.0 mM UA at the surface of (a) a RuON-GCE and (b) a BGCE. (C) Cyclic voltammograms of a 0.1 M phosphate buffer solution (pH 7.0) containing of 1.0 mM AD at the surface of (a) a RuON-GCE and (b) a BGCE. Potential scan rate: 20 mV/s.
One of the objectives of the current study was to fabricate a bifunctional electrocatalyst that would be capable of electrocatalytic oxidation of UA and AD at reduced over-potentials. In order to test the electrocatalytic activity of the modified electrode, the cyclic voltammograms of RuON-GCE and BGCE were obtained in the presence of 1.0 mM of UA (Fig. 1B) and 1.0 mM of AD (Fig. 1C). Then, the results were compared with the cyclic voltammogram of RuON-GCE in supporting electrolyte at pH 7.0 (Fig. 1A). A comparison of the peak potential of the cyclic voltammogram of the modified electrode in the presence of UA (Fig. 1B, voltammogram a) with the peak potentials of the modified electrode in the supporting electrolyte (pH 7.0) (Fig. 1A) indicates that, after the addition of UA, a drastic enhancement occurs in the anodic peak 3 current, and virtually a very small current is observed in the cathodic sweep. In addition, the anodic peak potential for the oxidation of UA at RuON-GCE (Fig. 1B, voltammogram a) is at 295 mV, while at BGCE (Fig. 1B, voltammogram b) UA is oxidized at the potential of 545 mV. Thus, a decrease of 250 mV in the overpotential and a dramatic enhancement of the peak current occur for UA at the modified electrode surface. These behaviors indicate a strong electrocatalytic effect of the modified electrode for UA oxidation. Fig. 1C shows the AD electrocatalytic oxidation at the RuON-GCE surface. The results point to similar behaviors for the oxidation of AD. For example, the electrocatalytic anodic peak potential of AD appears at 165 mV at RuON-GCE (Fig. 1C, voltammograms a) which is near the peak potential of the redox couple 2/2′ of the modified electrode in the supporting electrolyte, while, at BGCE, a small oxidation current is observed at 415 mV. Besides, a comparison of the peak potentials of electrocatalytic oxidation of UA and AD at the bifunctional electrocatalyst indicates that the oxidation of the two analytes occurs at different potentials of 295 mV and 165 mV, which are separate enough from each other to be quantitatively measured in mixture samples at RuON-GCE.
Fig. S2 shows the cyclic voltammograms of the modified electrode in a 0.1 M phosphate buffer solution (pH 7.0) containing various concentrations of UA. The inset of Fig. S2 refers to the calibration plot of UA electrocatalytic oxidation at RuON-GCE obtained at pH 7.0. Similar experiments were done in different pHs of 5.0, 6.0, 8.0, and 9.0 (not shown). A comparison of the calibration plots derived from different pHs indicated that the best linear range can be obtained in pH 7.0. Regarding that pH 7.0 is a biological pH, it was selected for further studies.
The electrocatalytic oxidation mechanisms of UA and AD were also studied by recording the cyclic voltammograms of 0.05 mM UA and 0.15 mM AD in a 0.1 M phosphate buffer solution (pH 7.0) at different potential scan rates (not shown). Figs. S3-A and S3-C show that the plots of the catalytic peak current, Ip, versus the square root of the potential scan rate, v1/2, are linear for UA and AD oxidation. This suggests that, at a sufficient overpotential, both reactions are mass transport controlled, which is an ideal case for quantitative applications. The number of electrons in the overall reaction (n) can be obtained from the plot's slope of Ip versus v1/2 (Figs. S3-A and S3-C). Using the slopes of these plots and according to Eq. (1) for a totally irreversible diffusion-controlled process [63] and considering the related diffusion coefficients (DUA = 5.1 × 10⁻⁶ cm2/s and DAD = 5.6 × 10⁻⁶ cm2/s obtained by chronoamperometry in the next section) and electron transfer coefficients (αUA = 0.49 and αAD = 0.46 obtained from Tafel plots as described below) for each analyte, it is estimated that the total number of electrons(n) involved in the anodic oxidation of UA and AD is 1.8 ≅ 2.0 and 2.2 ≅ 2.0 respectively.
| (1) |
The results also have shown that, by increasing the potential scan rate, the plot of Ip versus v1/2 deviates from linearity for both species, suggesting a kinetic limitation in the reaction between the modifier and the analytes. Based on these results, the electrocatalytic mechanism of ErCi is suggested for the oxidation reaction of UA and AD at the RuON-GCE surface. Under the above conditions for ErCi mechanisms, the theoretical model of Andrieux and Saveant [64] can be used to calculate the catalytic reaction rate constant (k). Considering Fig. 1 according to the approach of Andrieux and Saveant and their theoretical paper [64], the average values (1.01 ± 0.03) × 10−3 cm/s and (1.51 ± 0.04) × 10−3 cm/s were estimated for k′ of UA and AD respectively. In order to obtain information about the rate-determining step of both electrocatalytic reactions, the Tafel plots were drawn (Figs. S3-B and S3-D), using the points of the Tafel region of the cyclic voltammograms of UA and AD solutions at the RuON-GCE surface. The results of polarization studies for electrooxidation of the analytes at the modified electrode show that the average Tafel slope in the different plots agrees well with the involvement of one-electron transfer process. This holds true by assuming the average charge transfer coefficients of αave = 0.49 ± 0.02 and αave = 0.49 ± 0.03 [65] for UA and AD respectively. Also, the exchange current density (j0) is accessible from the intercept of the Tafel plots [65]. The average values obtained for the exchange current densities of UA and AD at the RuON-GCE surface were found to be 0.03 and 1.24 μA cm−2.
The catalytic oxidation of UA and AD by RuON-GCE was also studied by chronoamperometry. Chronoamperometric measurements are depicted in Figs. S4 and S5. In the chronoamperometric studies, we determined the diffusion coefficients (D) of UA and AD at the RuON-GCE surface. Based on Cottrell equation [65], the plot of I versus t−1/2 is linear and the value of D can be obtained from its slope. We carried out such studies for various UA and AD concentrations at the RuON-GCE surface (inset A of Figs. S4 and S5). The slopes of the resulting straight line were then plotted versus the UA and AD concentrations (inset B of Figs. S4 and S5), from whose slopes we calculated the diffusion coefficients of 5.1 × 10⁻⁶ cm2/s and 5.6 × 10⁻⁶ cm2/s for UA and AD respectively. The calculated values of the diffusion coefficients were in good agreement with those previously reported for UA [66] and AD [25].
3.2 Quantitative determination of uric acid, adrenaline, and Cys at the bifunctional electrocatalyst of RuON
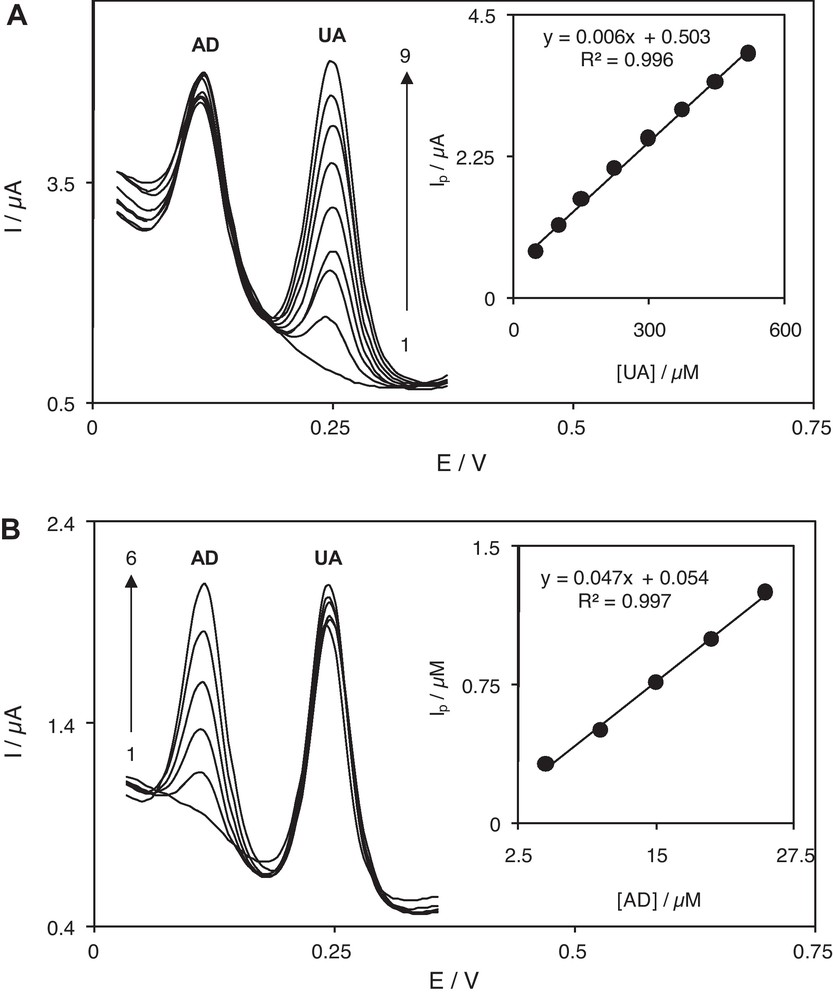
In order to demonstrate the selective behavior of RuON-GCE as a bifunctional electrocatalyst, used not only for the electrocatalytic oxidation of UA and AD but also for the successful separation of their electrochemical responses into two well-defined distinct peaks, the electrochemical behavior of UA+AD and that of UA+AD+Cys mixtures in a 0.1 M phosphate buffer solution were studied by cyclic and differential pulse voltammetry. Fig. 2 shows the cyclic voltammograms of a 0.1 M phosphate buffer solution (pH 7.0) containing different concentrations of UA (in the 1.4–46.5 μM range) and AD (in the 2.2–83.0 μM range). Insets (A) and (B) in this figure clearly show that the plots of the peak currents versus UA and AD concentration are linear for all the investigated concentrations of both analytes. Since differential pulse voltammetry (DPV) has a much higher current sensitivity and selectivity than cyclic voltammetry, the next attempt was made to estimate the lower range of detection, to individually determine of UA, AD, and also to simultaneously determine mixtures UA+AA as well as UA+AD+Cys mixtures in different synthetic and real samples. The effects of increasing the concentration of UA and AD on their voltammograms at the RuON-GCE surface are presented in Fig. 3A and B. Figs. S6-A to S6-D suggest that the plots of the peak currents versus the concentrations of both UA and AD are constituted of two linear segments with different slopes. The calibration plots are linear in the two ranges of 3.0–56.6 μM and 56.6–758.6 μM of UA as well as the two ranges of 2.0–65.5 μM and 65.5–758.6 μM of AD. A comparison of the sensitivities (slopes of the calibration plots) of the two linear segments for each analyte shows a decrease of sensitivity in the second linear range and proves that the peak current is relatively independent of the analyte concentration in high concentrations. It is well known that, with an increase in an analyte concentration in a solution, the thickness of diffusion layer and, thus, the mass transfer limitation are reduced [65]. Thus, it is logical to conclude that, under these conditions, the electron transfer kinetic between the analyte and the electrode surface has a main role for the current limitation. In other words, a decrease in the sensitivity of the calibration plot as well as the relative independence of the peak current of the analyte concentration in high analyte concentrations are likely to be due to the electron transfer kinetic limitation between the analyte and the modified electrode surface. The calibration plots in the 3.0–56.6 μM range of UA and 2.0–65.5 μM of AD were used to estimate the lower detection limit (D.L.) of UA and AD respectively. By analyzing these data, we estimated that D.Ls (Xl.o.d.) of UA and AD were 0.47 μM and 0.45 μM respectively according to the definition Xl.o.d. = (Yl.o.d. –Ybl.)/m [67]. Also, the average voltammetric peak current for 10 repeated measurements (n = 10) of 9.0 μM UA and 14.0 μM AD at RuON-GCE were obtained 0.19 ± 0.01 μA and 0.48 ± 0.02 μA respectively. As the standard deviation of the measured currents indicates, the modified electrode is stable and does not undergo surface fouling during the voltammetric measurements. This also demonstrates the fact that the results obtained at RuON-GCE are reproducible in analytical applications. Furthermore, the stability of RuON-GCE under working conditions was studied by monitoring the repeated differential pulse voltammetric responses in the presence of 9.0 μM UA and 14.0 μM AD. The results indicate that the loss of the current response was about 12% after 25 repeated differential pulse voltammograms, DPVs, while at the end of second 25 DPVs this was approximately 4%. The initial decay of the current response of the voltammograms might be due to the release of the modifiers that are weakly bonded to the electrode surface and can be separated somewhat easily. In Table 1, some of the response characteristics obtained for UA and AD in this study are compared with those previously reported by others [25,68–74]. The data denote that the responses of the proposed modified electrode are superior in most cases, especially in terms of concentration linear range, to previously reported sensors.
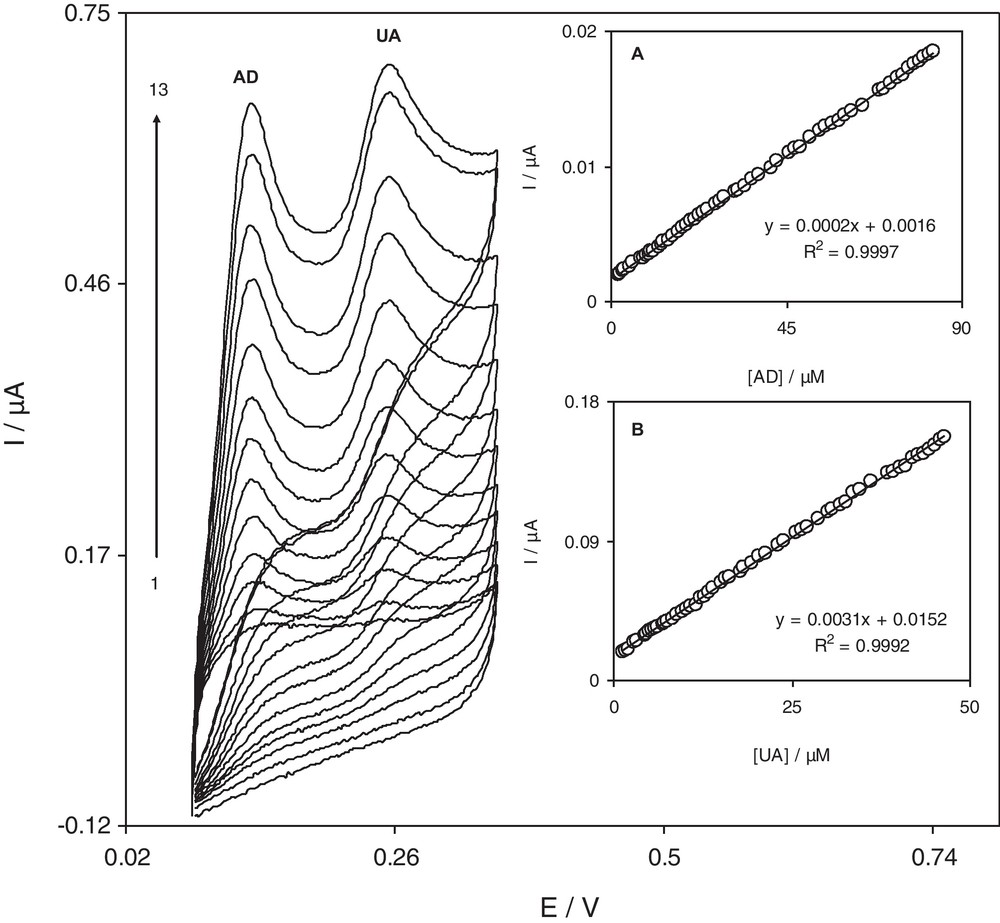
Cyclic voltammograms of a 0.1 M phosphate buffer solution (pH 7.0) containing different concentrations of UA and AD at the RuON-GCE surface. Numbers 1–13 correspond to1.4–46.5 μM UA and 2.2–83.0 μM AD. Insets (A) and (B) show the plots of the electrocatalytic peak current as a function of AD and UA concentrations respectively.

(A) Differential pulse voltammograms of RuON-GCE in a 0.1 M phosphate buffer solution (pH 7.0) containing different concentrations of UA. Numbers 1–15 correspond to 3.0–758.6 μM UA. (B) Differential pulse voltammograms of RuON-GCE in a 0.1 M phosphate buffer solution (pH 7.0) containing different concentrations of AD. Numbers 1–15 correspond to 2.0–758.6 μM AD.
Comparison some of the analytical parameters of the different modified electrodes for UA and AD determination.
| Modifier | Method | Linear range (μM) | Detection Limit (μM) | Ref. | ||
| UA | AD | UA | AD | |||
| Polylysine-MWCNT | Differential pulse voltammetry | 10–100 | – | 2.2 | – | [68] |
| Poly-methacrylic acid-MWCNT | Amprometry | 80–500 | – | 22 | – | [69] |
| Silver hexacyanoferrate nanoparticles | Cyclic voltemmetery | 2–15 | – | 0.06 | – | [70] |
| Quercetin | Differential pulse voltammetry | 1–50 | – | 1 | – | [71] |
| Ruthenium oxide nanoparticles | Differential pulse voltammetry | 3.0–56.6 56.6–758.6 | – | 0.47 | – | This work |
| Hematoxylin-MWCNT | Differential pulse voltammetry | 0.2–78.3 78.3–319.7 | 0.024 | [25] | ||
| Nafion-OMCa | Amprometry | 0.1–1200 | 0.035 | [72] | ||
| Gold nanoclusters | Differential pulse voltammetry | 0.3–21 | 0.03 | [73] | ||
| Gold nanoparticles | Differential pulse voltammetry | 0.1–500 | 0.04 | [74] | ||
| Ruthenium oxide nanoparticles | Differential pulse voltammetry | 2.0–65.4 65.4–758.6 | 0.46 | This work |
a Ordered mesoporous carbon.
The next attempt was made to determine UA and AD simultaneously by using an RuON-GCE sensor. Fig. 4 shows the differential pulse voltammetric responses which were gained by varying either the UA (Fig. 4A) or AD (Fig. 4B) concentration while the concentration of the other compound was kept constant. As Fig. 4A sets it, the electrochemical response of UA in the presence of a constant concentration of 50.0 μM of AD increased linearly with the increase of the UA concentration, while the response of AD remained almost constant. Similarly, Fig. 4B shows the DPVs obtained by increasing the concentrations of AD in the presence of 150.0 μM of UA. As it can be seen, there occurs an increase in the peak current of AD with an increase in AD concentration, while the voltammetric peak of UA is almost unchanged during the oxidation of AD. From the results, it can also be noted that the responses to UA and AD at the RuON-GCE surface are relatively independent. The utility of RuON-GCE for the simultaneous determination of AD, UA and Cys was demonstrated by simultaneously changing the concentrations of these species in the solutions. The DPV results show that the simultaneous determination of the above analytes with three well-distinguished anodic peaks at the potentials of 85, 252 and 508 mV, corresponding to the oxidation of AD, UA, and Cys, is possible at the modified electrode (Fig. 5A). The inset of Fig. 5A displays the DPV of a mixture of 30.0 μM of AD, 115.0 μM of UA, and 3.5 mM of Cys at a BGCE; the BGCE could not separate the voltammetric signals of AD, UA, and Cys. Figs. 5B–D show that variations of the oxidation peak current versus the concentrations of AD (in the 3.4–31.0 μM range), UA (in the 15.0–116.0 μM range), and Cys (in the 0.56–3.87 μM range) are linear in all the worked concentration ranges. By comparing the calibration plots corresponding to similar linear ranges in Figs. 5B–C and S6, one can see that the sensitivities of UA and AD determination in the absence and presence of either one are near each other. This result points to the fact that the oxidation processes of UA and AD at the modified electrode surface are independent and, therefore, simultaneous or independent measurement of each of the two analytes is possible without any interference.
(A) Differential pulse voltammograms of RuON-GCE in a 0.1 M phosphate buffer solution (pH 7.0) containing 50.0 μM AD and different concentrations of UA. Numbers 1–9 correspond to 0.0, 50.0, 100.0, 150.0, 224.0, 298.2, 372.2, 446.0 and 519.5 μM UA. Inset shows the plot of the electrocatalytic peak current as a function of UA concentration within the 50.0–519.5 μM range. (B) Differential pulse voltammograms of RuON-GCE in a 0.1 M phosphate buffer solution (pH 7.0) containing 150.0 μM UA and different concentrations of AD. Numbers 1–6 correspond to 0.0, 5.0, 10.0, 15.0, 20.0 and 25.0 μM AD. Inset shows the plot of the electrocatalytic peak current as a function of AD concentration within the 5.0–25.0 μM range.

(A) Differential pulse voltammograms of RuON-GCE in a 0.1 M phosphate buffer solution (pH 7.0) containing different concentrations of AD, UA and Cys. Numbers 1–20 correspond to 3.4–31.0 μM AD, 15.0–116.0 μM UA and 0.56–3.87 mM Cys. Inset shows differential pulse voltammogram of a mixed solution of 30.0 μM AD, 115.0 μM UA and 3.5 mM Cys at a BGCE. (B)–(D) show the plots of the electrocatalytic peak current as a function of AD, UA, and Cys concentrations, respectively.
3.3 Determination of uric acid in a human urine sample and adrenaline in an injection solution using RuON-GCE
In order to verify the reliability of RuON-GCE for the analysis of UA and AD in real samples, the modified electrode was used to determine UA and AD in a human urine sample and an AD injection solution (1.0 mg/mL, 1 mL per injection) respectively, and then the analytical results were compared with those obtained using a standard method (for UA in urine) or declared in the label of pharmaceutical inhalation products (for AD injection solution). To analyze the real samples using the proposed method, the urine sample and the AD injection solution were diluted 210 and 550 times respectively with a 0.1 M phosphate buffer solution of pH 7.0 before the measurements. Then, the diluted analyte solutions were placed in an electrochemical cell to determine UA or AD using the differential pulse voltammetric method. Based on the currents of repeated voltammograms (n = 4) and using the related calibration plots, the UA and AD concentrations in the diluted solutions were calculated as reported in Table 2. To authenticate the validity of the results, the diluted samples were spiked with certain amounts of UA and AD at levels similar to those found in the samples themselves (Table 2). The results in Table 2 show that the relative standard deviations (RSD%) and the recovery rates of the spiked diluted analyte solutions are acceptable. The reliability of the measurement results was also evaluated by comparing the total values obtained for both analytes with those obtained using a photometry standard method for UA [75] or declared in the label of the AD pharmaceutical product. The data in Table 2 demonstrate that the results obtained through the differential pulse voltammetric measurements are in good agreement with the values obtained by the standard method for UA or declared in the label of the AD injection solution. Also, the total value of UA in human urine is almost similar to those reported in the literature [25]. The statistical test (t-test) was used to confirm the accuracy of the obtained data for the total value of UA using the proposed method. The calculated t-value for the UA total value in urine sample is 2.26 (texp. = 2.26), which is smaller than the critical t-value at the 95% confidence level at 6 degrees of freedom. The tabulated t-value for 6 degrees of freedom at P (0.95) is 2.45. Therefore, the t-test did not show a significant difference between the results obtained from the two methods, and the accuracy of the proposed method was confirmed.
Determination and recovery results of UA in a human urine sample and AD in an AD injection solution using RuON-GCE and comparison of the total values of UA and AD of the real samples with those obtained using a standard method (for UA in urine) or declared in the label of the pharmaceutical inhalation product (for AD injection solution).
| Samples | Added (μmol/L) | Founda (μmol/L) | RSD (%) | Recovery (%) | Total value found using RuON-GCEb (mg/mL) | Total value obtained using standard method or declared value (mg/L) |
| Urine | – | 10.03 | 1.3 | – | 0.354 ± 0.004 | 0.350 ± 0.003 |
| 5.0 | 15.18 | 2.1 | 101.0 | (Using standard method) | ||
| 15.0 | 25.12 | 2.9 | 100.4 | |||
| Injection solution of AD | – | 10.05 | 2.4 | – | 1.01 ± 0.02 | 1.00 |
| 5.0 | 15.29 | 2.9 | 101.6 | (Declared value) | ||
| 15.0 | 24.56 | 3.3 | 98.0 |
a Four replicate measurements were made on the same samples.
b The total values (average of three measurements) were obtained by multiplying the measured values by the appropriate dilution factor.
4 Conclusion
Based on the results obtained in this manuscript, it is concluded that RuON-GCE can be not only used as a bifunctional electrocatalyst for the oxidation of UA and AD but also used in the simultaneous determination of UA, AD and Cys in mixtures. The cyclic voltammetric results of UA and AD exhibit the characteristics of an EC catalytic mechanism. The diffusion coefficients of UA and AD are calculated as 5.1 × 10⁻⁶ cm2/s and 5.6 × 10⁻⁶ cm2/s respectively. In differential pulse voltammetry, the calibration curves are linear in the two ranges 3.0–56.6 μM and 56.6–758.6 μM for UA and 2.0–65.5 μM and 65.5–758.6 μM for AD. The detection limit of UA and AD are estimated as 0.47 μM and 0.45 μM respectively. The separation of the oxidation peak potentials for AD-UA and UA-Cys at the modified electrode are about 170 and 356 mV respectively though, at a bare GCE, the peak potentials are indistinguishable. Also, RuON-GCE has been satisfactorily used for the determination of AD in a pharmaceutical preparation and UA in a human urine sample.
Acknowledgments
Financial support from the Iran National Science Foundation, INSF, are gratefully acknowledged.