

1 Introduction
Since the discovery of nanotubes of carbon by Iijima in 1991 [1], such nanomaterials have attracted great attention. In particular, TiO2-based nanotubes have been intensively studied for potential nanoscale electronics, optoelectronics, and biochemical-sensing applications due to their high refractive index, chemical stability, and superior photocatalysis activity [2–5]. Early on, Zwilling et al. reported that when metallic titanium is subjected to anodization in fluoride-containing electrolytes, its surface become porous [6,7]. A decade later, Grimes and coworkers first reported the formation of uniform titania nanotube (NT) arrays via anodic oxidation of Ti in an HF electrolyte [8]. Since then, numerous methods have been developed to prepare 1-D titania nanomaterials. These include the preparation by sol–gel process [9,10] or nanoporous alumina template [11,12], hydrothermal processes [4,13], seeded growth [14,15]. However, the lengths of the nanotubes were limited to 500 nm. This limitation was attributed to the chemical dissolution of Ti as well as of TiO2 into the electrolytic solution. Later several groups studied these limitations and successfully synthesized nanotube arrays of lengths up to several microns by varying the pH of the solution [16,17]. Paulose et al. [18] synthesized TiO2 nanotube arrays of lengths up to thousands of micrometers on titanium foils. Using a sol–gel approach, Hoyer [19] prepared TiO2 nanotubes with diameters of 70–100 nm. Smaller TiO2 nanotubes with diameters of about 8 nm were reported, whose structure was considered as anatase phase [20] or anatase–rutile phase [21]. More recently, highly ordered TiO2 nanowire arrays have been reported with the structure of the anatase phase [22]. There are a variety of reported methods for making TiO2 nanotubes and most of the research shows that nanotube properties depend on the particle size and structure of the TiO2 precursor. Yutao Ma et al. synthesized nanotubes with diameters of 2–10 nm using sonication [23]. Hydrogen titanate H2Ti5O11 was found to be the dominant nanotubes phase by Yuan et al., and sodium titanate NaxH1–xTi3O7, x ∼ 0.75 by Poudel et al. [24].
Up to now, the sol–gel method is a relatively simple technique that can be easily used to fabricate uniform one-dimensional nanostructures such as nanotubes, nanowires, nanosheets, and nanobelt arrays. In addition, we utilize the sol–gel reaction of a TiO2 precursor to form a well-aligned, discrete and free-standing TiO2 nanotube array by controlling the rate of hydrolysis in the reaction [25,26]. Compared to other techniques, the sol–gel process involves low cost and high throughout, the most significant factors for practical use.
Nanotubes have a large specific surface area available for the absorption of photons compared to the bulk material, while also providing channels for enhanced electron transfer, thus enhancing photovoltaic and photocatalytic activity [27]. A notable example is the activation of TiO2 for photovoltaics with visible light, by doping it with various transition metals and their oxides. For example, we have reported that the doping of TiO2 with Cr significantly enhanced the photocatalytic activity in the visible region [28]. Xu et al. reported that Zn-doped TiO2 showed higher photocatalytic activity than TiO2 [29]. Ni-doped TiO2 have been studied extensively as a visible photocatalyst by Nabeen et al. [30]. Zhengchao et al. and Galstyan et al. showed that the doping of TiO2 with Nb enhances photocatalytic and gas sensor activity [31,32]. Furthermore, the use of Au-doped TiO2 nanotube arrays utilized as chemical sensors and biosensors have been given great attention [33]. In fact, there is great variation in the reported structures and chemical composition of TiO2 nanotubes, and there is yet no full explanation for the general shape and formative mechanism of the nanotubes.
The aim of this study is to investigate the effect of Hg2+ doping and of the annealing temperature in TiO2 nanotubes (NTs) formation using tetrabutyl-orthotitanate and mercury acetate precursors. In this study, the TiO2 thin films doped with mercury Hg2+ ions were prepared by a sol–gel dip-coating method under heat treatment between 600 and 1000 °C. Moreover, the morphology, structure and optical properties of thin films of TiO2 doped with Hg2+ allow us to examine the influence of Hg2+ doping and of the annealing temperature on the nanotubes’ growth. Recently, extensive research has been conducted on the synthesis of TiO2-doped nanotubes because of their improved properties compared to those of undoped ones. This work is the first report of titanium oxide nanotubes doped with mercury Hg2+ ions with a view to promising applications in photocatalysis activity.
2 Experimental
2.1 Synthesis method
2.1.1 Synthesis of Hg2+-doped TiO2
In this study, nanocrystalline undoped TiO2 and Hg2+-doped TiO2 thin films were prepared by the sol–gel dip-coating techniques, which is based on the hydrolysis of alkoxides, in alcoholic solutions, in the presence of an acid catalyst, in three steps. The first step consists in the dissolution in 1 mol of butanol (C4H9OH) as a solvent of 4 mol of acetic acid (CH3COOH), 1 mol of distilled water, and 1 mol of tetrabutyl-orthotitanate (C4H9O)4Ti [34]. In the second step, a solution of Hg2+ was prepared by dissolving 1 mol of acetate mercury salt (C2H3O2)·2 Hg) in HNO3 and 2 mol of acetic acid (95%). In the third step, the solutions of TiO2 were doped with 5% of an Hg2+solution. The concentration of the Hg ions is x = 5, where x is the atomic percent of the Hg ion and is defined as x = [Hg/(Ti + Hg)] × 100. Subsequently, 5% of Hg-contained solutions were added into the TiO2 sols. Then, the resultant yellowish transparent solutions were ready to use.
The TiO2 thin films doped with Hg2+ were deposited on silicon (001) substrates by dip-coating. The substrates are immersed in the coating solution and then withdrawn at a regulated speed of 6.25 cm·s−1. After each coating, thin films were dried for 30 min at a distance of 40 cm from a 500-W light source. The drying temperature of the light source is approximately equal to 100 °C. Subsequently, thin films were heat treated in the temperature range from 600 to 1000 °C with a temperature increase rate of 5 °C min−1 in the furnace under air atmosphere for 2 h.
2.2 Characterizations of Hg2+-doped TiO2
The structure of the films of Hg2+-doped TiO2 was analyzed by X-ray diffraction (XRD) using a Bruker/Siemens Hi-Star 2d Diffractometer and Cu Kα radiation. The patterns were scanned at room temperature over the angular range 2θ = 20–70° with steps of 0.02°. The Raman spectra were recorded at room temperature using an Aramis Horiba Jobin Yvon Confocal Raman Microscope LabRAM HR combined with a Raman-IR microanalytical spectrometer equipped with a motorized xy stage and an autofocus. The spectra were generated with the 632.8-nm He–Ne laser excitation. The spectral resolution of this apparatus is estimated to be less than 0.5 cm−1 for a slit aperture of 150 μm and a confocal hole of 300 μm. The FTIR spectra were obtained with a Fourier Transform Infrared Spectrometer (PerkinElmer). The scanning wavelength in the infrared domain was 4000–400 cm−1. The morphological study was performed using field emission scanning electron microscopy (FE-SEM) (JEOL, JSM-6700). A Veeco Dektak 3ST Auto 1 surface profiler was used to determine film thickness. The optical properties of the films were examined using a photoluminescence (PL) measurements made with a Jobin Yvon-Spex spectrofluorometer (Fluorolog version-3; Model FL3-11) with a 450-W high-pressure xenon arc lamp as the excitation source. PL excitation and emission spectra were acquired at room temperature for a spectral resolution of 0.2 nm and a slit width of 0.25 mm. Further optical characterization of the samples was done by UV–vis reflectance spectrophotometer (JASCO). The reflectance spectra were taken over the range 800–200 nm.
3 Results and discussion
3.1 Structural properties
3.1.1 XRD and Raman analysis
Fig. 1 shows XRD patterns of the TiO2 thin films doped with 5% of Hg2+ before annealing (Fig. 1a), obtained at different annealing temperatures: 600 °C (Fig. 1b), 800 °C (Fig. 1c), and 1000 °C (Fig. 1d). As illustrated in Fig. 1a, untreated Hg2+-doped TiO2 thin films exhibit an amorphous structure. However, at an annealing temperature of 600 °C, the Hg2+-doped TiO2 thin films start to crystallize (Fig. 1b) with an anatase phase of titanium oxide [35]. In addition to the anatase phase, the presence of rutile can be observed (Fig. 1c) [36]. Both continue to coexist at the temperature of 800 °C. At the temperature of 1000 °C, complete transformation into the rutile phase has taken place. Furthermore, the crystalline phase of compounds formed by Hg2+ ions was indicated in peaks corresponding to the mercury titanate (HgTiO3) phase (Fig. 1d) [37,38]. In our case, we obtain this structure from titanium alkoxide and mercury acetate by a sol–gel method in the air, but in other cases mercury titanate (HgTiO3) can be prepared from HgO and TiO2 at high pressure [39]. This means that Hg2+ ions are indeed doped into the structure of titanium oxide and that the doping amount of Hg2+ ions maybe change the structure of thin films of TiO2 and provoke a partial nanotube formation which generates from rutile and mercury titanate (HgTiO3) phases. In fact, the intensity of the characteristic peaks increases with increasing the annealing temperature and grain sizes, the size of TiO2 nanoparticles being estimated using Scherrer's equation [40]. The computed values of grain sizes are given in Table 1.

(Color online). Evolution of diffraction patterns of 5% Hg-doped TiO2 thin films before annealing (a) and obtained at various annealing temperatures [(b) 600 °C, (c) 800 °C, (d) 1000 °C)]: ♦: anatase; *: rutile; ■: HgTiO3.
Influence of the annealing temperature on the average particle size of Hg-doped TiO2 film, observed by XRD and SEM analyses.
| T (°C) | DRX analysis calculated | SEM analysis estimated | ||
| Phase | (hkl) | Average particle size (nm) | Average particle size (nm) | |
| 600 | Anatase | (101) | 49 | / |
| Anatase | (200) | 11 | / | |
| 800 | Rutile | (110) | 30 | / |
| Anatase | (200) | 24 | / | |
| 1000 | Rutile | (110) | 34 | 20–60 |
| HgTiO3 | (021) | 39 | 35–80 | |
| Nanotube | / | / | 50–400 |
The Hg2+-doped TiO2 thin films were further characterized by Raman spectra, which are shown in Fig. 2. The Raman spectra (Fig. 2a and b) show vibration modes of the tetragonal anatase phase identified at 143, 198, 396, 447, and 638 cm−1. Similar positions were also observed in previous reports for anatase phase [41]. At an annealing temperature of 800 °C, the intensity of the peaks of anatase decreases and rutile phase is observed (see Fig. 2b). It is well known that the bands centered around 234, 430 and 609 cm−1 can be attributed to the vibration modes of rutile phase [42]. Moreover, these peaks also are assigned to the characteristic phonon mode of titanium oxide nanotubes reported by [43,44]. In Fig. 2c, there are two new peaks located at 141 and 445 cm−1 in the Raman spectra of Hg2+-doped TiO2 thin films annealed at 1000 °C. These peaks are clearly attributed to the mercury titanate phase (HgTiO3). The presence of the bands characteristic of mercury vibration modes in the Raman spectra reveals that this material segregates there in TiO2. The latter observations are in good agreement with XRD results.

Raman spectra of the 5% Hg-doped TiO2 thin films obtained at annealing temperatures of 600 °C (a), 800 °C (b) and 1000 °C (c): A: anatase; R: rutile; H: HgTiO3; Si: substrate.
3.1.2 FTIR analysis
Fig. 3 shows the infrared absorption spectrum of the 5% Hg2+-doped TiO2 thin films annealed at different temperature (600–1000 °C). These spectra were used for the detection of the presence of functional groups in the material. The absorption band at 980 cm−1 and 750 cm−1 is due to the stretching vibration of TiOH [45,46]. The band around 650 cm−1, 512 cm−1 was attributed to the vibration mode of TiOTi bond [47] and another bond appears around 350 cm−1, this is the OTiO band corresponding to the crystalline of titanium in the anatase form [48,49]. Also, the bands at 512 cm−1 and 750 cm−1 are presented as vibration modes of mercury titanate (HgTiO3) [39]. In addition, some TiOTi bridges were broken, while other TiOH bonds are formed depending on the amount of Hg2+ ions. This is possibly linked to the formation of nanotubes by dehydration of TiOH bonds. As the annealing temperature increases, this band becomes sharper, suggesting that the TiOH bonds convert into a strong network of TiOTi in the TiO2 skeleton. Also, TiOTi bonds or TiOHOTi hydrogen bonds were generated. This implies that the number of bonds characteristic of the crystallization of titanium dioxide increases with the annealing temperature and results in the formation of an Hg2+-doped TiO2 nanotubes structure comparable to that of the undoped one [34]. The FTIR study confirms the Raman and XRD results.
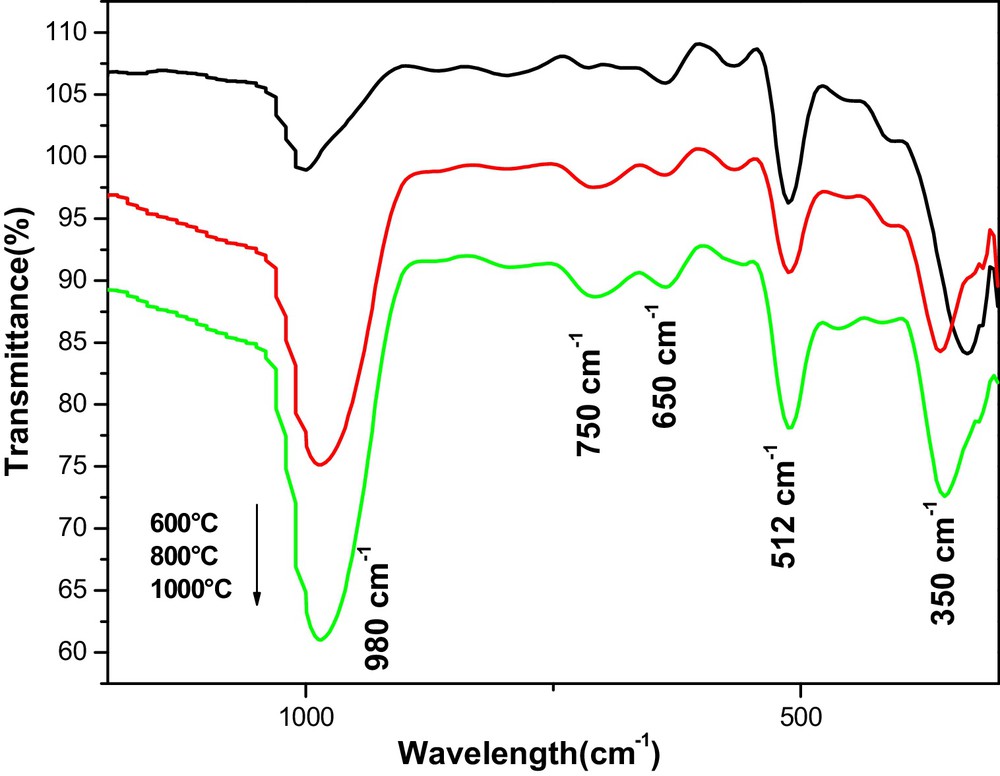
(Color online). FTIR spectra of 5% Hg-doped TiO2 thin films, obtained at various annealing temperatures (600, 800, 1000 °C).
3.1.3 SEM analysis
Fig. 4 shows SEM micrographs of TiO2 thin films doped with 5% Hg and annealed at different temperatures (600 to 1000 °C). The SEM investigations showed that the structure of the thin films changes depending on the annealing temperature. The micrographs of the thin films treated at 600 °C (Fig. 4a) contain structures in the form of tangled nanostructures due to agglomerates of round-shaped nanoparticles of anatase with preferred orientation. These nanoparticles begin to transform into nanosheets from the anatase and rutile phases at the temperature of 800 °C (Fig. 4b). At temperatures higher than 1000 °C (Fig. 4c and d), a specific morphology is reported, including nanoparticles of rutile, HgTiO3, and nanotubes, and it is stated that the structure of the nanosheets bends and rolls to form nanotubes, as reported by [50]. The SEM micrograph observations are in good correlation with the results found by XRD and the Raman spectra. The nanoparticles have diameters of about 20–60 nm for the rutile phase and about 35–80 nm for the mercury titanate phase (HgTiO3). Hence, the nanotubes have diameters ranging between 50 and 400 nm, approximately.
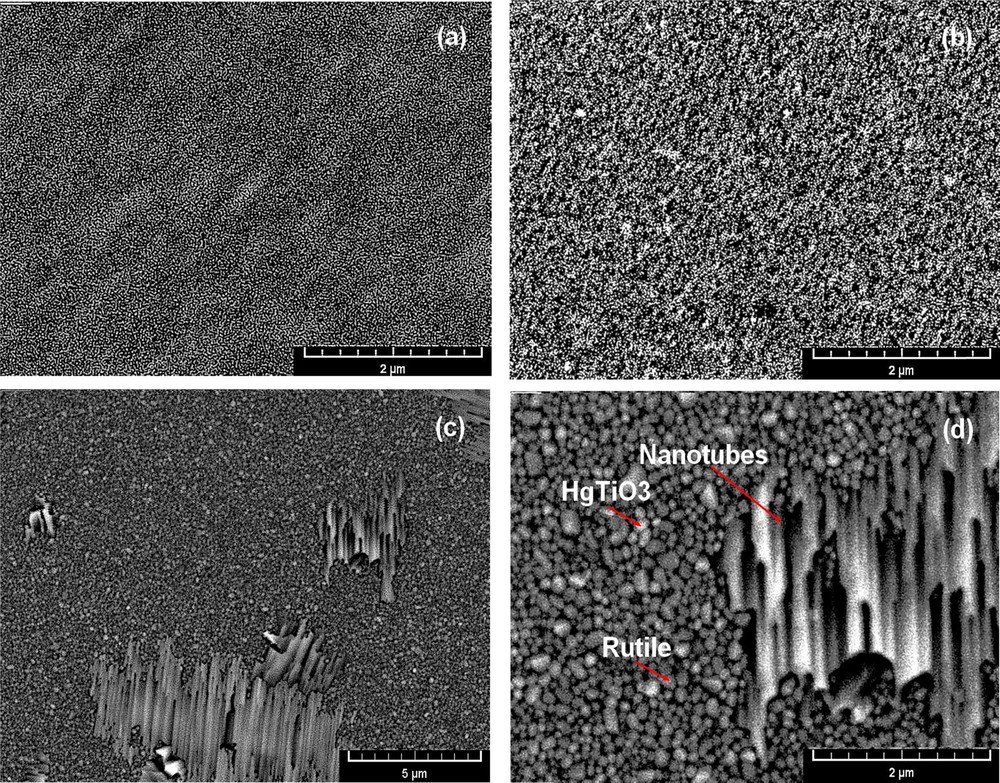
(Color online). SEM micrographs of Hg-doped TiO2 thin films obtained at various annealing temperatures: (a) 600 °C, (b) 800 °C, and (c,d) 1000 °C.
At a temperature of 1000 °C, these nanosheets will be transformed into nanotubes from the nanoparticles of rutile and the HgTiO3 phase (Fig. 4c). So, in this case, the nanosheets roll up and form nanotubes. Indeed, the annealing temperature and doping by mercury ions can interrupt initially the structuring of TiO2 particles: 3D loading octahedra TiO6 exfoliated into layered crystalline sheets. Such TiO2 sheets act as supports to adsorb mercury nanoparticles. According to the scroll mechanism, during the reaction, the octahedra were broken and a zigzag structure was formed when the free octahedra shared edges between the Ti4+ ions with the formation of hydroxy-bridges, leading to the growth of another phase. The crystalline sheets formed by the lateral growth and the formation of oxo-bridges between the Ti centers (TiOTi bonds) in the direction cooperated, increasing the tendency of the sheet to roll up in order to saturate these bonds dangling from the surface and lower the total energy, resulting in the formation of TiO2 nanotubes [51].
There are few comparative studies on the mechanisms of nanotube formation by the sol–gel method in the literature. This is the reason why we wanted first of all to analyze the effect of doping and of the annealing temperature on the formation and growth of nanotubes. After heat treatment at different temperatures, we began to observe the formation of clusters of nanotubes, which consist of nanostructures on primary, second and third growth of nanoparticles (Fig. 4c). It is conjectured that the nanoparticles of rutile and HgTiO3 phases generate the formation and growth of nanotubes. Based on the SEM micrographs, we can conclude that annealing at 1000 °C is not yet enough to completely transform all the nanoparticles into nanotubes. This means that the reaction leading to nanotube formation is still incomplete at 1000 °C (Fig. 4d). Therefore, in our case, this temperature is not sufficient to transform all the nanoparticles into Hg2+-doped TiO2 nanotubes. However, other studies show that those nanotubes can form at low temperatures [52].
In our studies, at annealing temperature from 600 to 1000 °C, we were able to form nanoparticles and nanosheets at low temperatures (600–800 °C) and nanotubes at high temperature (1000 °C). These results disagree with previous works that found that at high temperature nanosheet and nanotube structures are destroyed and changed into that of a composite of nanorods and nanoparticles [53,54].
4 Optical analysis
4.1 Reflectance
The reflectance spectra recorded for the Hg2+-doped TiO2 thin films annealed at different temperatures are shown in Fig. 5. For annealing temperatures ranging between 600 °C and 1000 °C, the reflectance reaches 90% in the visible region. It can be seen that an increase in the annealing temperature and mercury doping cause, in addition to the fundamental absorption of TiO2 (around 370 nm), another absorption peak between 400 and 500 nm, which is probably due to the effect of the doping (Hg2+) ions. The absorption peak located at 370 nm corresponds to the electronic transition from the valence band of oxygen (2p orbital of oxygen: O2p) to the conduction band of titanium [55]. This absorption band also reveals TiO2 nanotubes (370 nm) compared to pure bulk anatase (373 nm) [56], while the absorption in the range from 400 to 500 nm is caused by the doping of TiO2 thin films with Hg2+. We also note that the Hg2+-doped reflectance spectra show a slightly to longer wavelength with increasing the annealing temperature, associated with a dramatic decrease in the optical gap (3.51 to 3.10 eV) because the rutile phase has lower optical band gap compared to the anatase one. The band gap was determined using the equation in [57]; there is decreasing trend of the band gap with increasing the annealing temperature. This reflects an anatase-to-rutile phase transformation. The lower band gap of the rutile phase makes the absorption edge around the visible region. The decrease in band gap values of the nanotubes compared to those previously reported can be attributed to the presence of oxygen vacancies created by the chemisorbed hydroxyl groups. As inferred from the FTIR analysis, the presence of hydroxyl group on the surface of TiO2 nanotubes creates oxygen vacancies, whereas the aggregation of the vacancies provokes a decrease in band-to-band transition energy.

(Color online). Reflectance spectra of the Hg-doped TiO2 thin films obtained at annealing temperatures of 600 °C (a), 800 °C (b), and 1000 °C (c).
We think that the effect of Hg2+ on TiO2 can be distinguished from the reorganization of nanostructures as nanotubes. This decrease might be the result of the change in film density and of an increase in grain size. The band gap reduction is favorable to the enhanced photocatalytic application of TiO2 in the visible region.
4.2 Photoluminescence
Fig. 6 shows the PL spectra of the samples annealed at different temperatures (600–1000 °C). From Fig. 6, it is clear that the three samples have different photoluminescence behaviors. For the TiO2 thin film doped with Hg2+ deposited on the Si substrate, the spectra, once deconvolved, revealed the presence of four main PL bands based on ultraviolet and red emission. The bands are located at 544.12 nm (4.38 eV), 585.05 nm (4.72 eV), 612.06 nm (4.93 eV) and 637.37 nm (5.14 eV), respectively.

(Color online). PL spectra of the Hg-doped TiO2 thin films obtained at annealing temperatures of 600, 800 and 1000 °C.
The bands around 544.12 nm are due to a green–yellow emission from the transition charge-carrier trapping of Hg2+-doped TiO2, while the yellow emission localized around 585.05 nm is associated with phonon emission in the yellow region from a recombination of free excitons [56]. The peaks centered around 612.06 nm and 637.37 nm can be attributed to red emission bands from the indirect transition of Hg2+-doped TiO2 thin films. The valence band and conduction band of Hg2+-doped TiO2 arose from O-2p and Ti-3d electrons, respectively. For TiO2 nanotubes, because of the high surface-to-volume ratio, substantial numbers of Hg2+ ions are exposed at the surface. As evidenced by FTIR studies, a sufficient number of them exist as O–Ti–OH. The presence of Ti–OH bonds distorts the TiO6 octahedra and introduces localized energy states within the band gap. These charge-carrier trapping surface states, with different energy levels, become luminescent centers. Consequently, all these bands have higher bands gaps compared to the undoped one (3.67 eV).
The PL intensity of thin films of TiO2 doped with Hg2+ increases with increasing the annealing temperature and it also depends on the structure of thin films and the size of the nanoparticles [58]. It is generally accepted that surface shape plays an important role in the photoluminescence spectra of nanostructures. This is explained by the effect of electron confinement related to the surface and the volume. Furthermore, the red shift observed is induced by a charge transfer from anatase to rutile. This gradual emission increase in the near-infrared NIR luminescence intensity is attributed to the phase transformation caused by the formation of the rutile phase at elevated temperature and the ultimate collapse of the TiO2 nanotubes. In our case, as the temperature increases, phase conversion starts at 600 °C and one obtains a mixed structure at a higher temperature, i.e. 1000 °C. At the same time, shallow traps and defect levels may be present in the depth of the band gap, which may develop other sub-bands around a central peak that mainly originates from the morphological distribution of the nanostructures. The results of PL (Fig. 6) are consistent with the FTIR and reflectance data and with SEM observations.
5 Conclusion
In the present work, we have successfully prepared and characterized thin films of TiO2 doped with Hg2+ using a sol–gel dip-coating technique. XRD, FTIR and Raman spectroscopy studies reveal that the films crystallize in different structures, anatase, rutile, mercury titanate (HgTiO3) and nanotube phases as a function of the annealing temperature (600–1000 °C). Moreover, in this work, we discussed extensively the effects of Hg2+ doping and of the annealing temperature on the formation and growth of nanostructures. At a higher temperature (1000 °C), we observed the growth of arrays of nanotubes of Hg2+-doped TiO2. These arrays contain nanostructures on primary, second and third growth of nanoparticles. From these arrays of nanostructures, we believe that the growth of nanotubes is generated. SEM observation confirms that we have nanostructures, with nanoparticle, nanosheet and nanotube morphologies. The diameters of the nanotubes formed are in the range of around 50–400 nm. PL and reflectance studies predict an increase in photocatalytic activity for doped films compared to undoped ones because of the presence of defect states due to Hg2+ and to the higher annealing temperature.