

1 Introduction
The current European policy on water results from the Water Framework Directive (WFD) of 2000 [1], which establishes guidelines for the protection of surface water, underground water and coastal water in Europe. The main objective of the WFD is to maintain or restore the quality of water in Europe with the aim of reaching good chemical and ecological conditions, before a deadline set for 2015, by controlling the effects brought about by human activity [2–4]. The WFD of 2000 was adapted to the different European member states, and was followed up by other directives, notably that of 2006 concerning dangerous substances (Directive 2006/11/EC). In France, the WFD was incorporated into French legislation by a law passed on 21 April 2004 [4]. Among the numerous actions that took place following this law, was the campaign known as “Monitoring and Reduction of Substances present in Water” (or in French: “Recherche et réduction des substances présentes dans l’eau”; circular dated 7 May 2007). As part of this national campaign, a list was set up of the substances to be monitored in the aim of reducing their presence or suppressing them completely. There were two categories of unwanted substances: priority substances (PS) presenting a significant risk for the environment, and dangerous priority substances (DPS) considered to be persistent, highly toxic or to lead to bioaccumulation [2,4]. The selection of priority substances can either be based on individual substances or families of substances (metals, chlorobenzenes, anilines, alkylphenols, etc), or on the basis of the industrial site or sector (agro-food industry, chemicals industry, etc). In France, 50 substances are concerned and have been divided into four main categories (DPS list, PS list, list I and list II) each with their own national objectives of reduction and/or elimination. Of these 50 substances, 41 (13 DPS + 20 PS + 8 S) give information on the chemical state of the water, and certain metal ions and their derivatives, such as the DPS Hg and Cd (objective of 50% reduction by 2015 and total elimination from discharge water by 2021–2028) and the PSs Ni and Pb (objective: 30% reduction by 2015). Eight major metals, namely As, Cd, Cu, Cr, Hg, Ni, Pb, and Zn, are a particular focus of attention in that they are used in the calculation of an indicator known as the metox index (for toxic metals) which is used to quantify certain toxic forms of pollution. It is an officially recognized index developed by the French Water Authority, a public organization involved in actions to counter pollution, and is used to calculate the taxes that certain high-risk installations (those susceptible of becoming a serious threat, causing pollution or other treats to the environment) must then pay to the Water Authority.
The human origins of the metals present in the environment are diverse [4]. They arise either from localized urban or industrial discharges or from dispersed sources such as transport or spreading on agricultural land. Many industries are concerned by the issue of metal release [5–8]. We can mention waste incineration, fossil fuel power plants, the timber industry, wine production, the plastics industry, paper or cardboard pulp manufacturers, the glass industry, surface-finishing installations and the steel industry. The presence of metals in wastewater can be accounted for either by their direct use during various industrial processes or by their presence in chemical reagents and/or related materials commonly used in the various activities of the factories producing the effluent. Since the end of the 1970s, industry, and particularly the surface treatment or surface-finishing sector (ST sector) that is widespread across France and the whole of Europe, has made a serious effort to limit its impact on aquatic environments [7,8]. In spite of the considerable improvements made in decontamination, this sector of industry still has a poor image [9–11]. Even though industrial wastewater respects current legislation, the effluent from ST plants, which is decontaminated using physical and chemical approaches, still contains a non-negligible load of metals that can be a cause for concern [12–14]. The metals make their way to the rivers, either by direct discharge or indirectly passing first by municipal wastewater treatment plants.
As far as we are aware, no studies have been devoted to determining the precise levels of the metals contained in ST effluent and its variability both quantitative and qualitative. It is in this context that we monitored 28 metals in the discharge from a surface-finishing plant. The discharge was taken at the outlet of a decontamination setup based on a process to render the metals insoluble. The present study reports and discusses the analytical results of a one-year follow up. The values are expressed both as concentrations and as total fluxes, to facilitate comparison with the limits laid down by the law.
2 Experimental
2.1 Industrial site
The study was carried out in collaboration with Galvanoplast (Les Aynans, France), a company specialised in chemical surface treatment of parts mainly for the automotive and building industries. During the different stages of treatment of the parts (mainly galvanization and flake coating) several metal species are released in the process water. This wastewater can be more dilute as in rinsing water, or more concentrated as in the bath solutions varying the load of pollutants released. Spent process water, i.e. rinse water and baths of the same type are stored together making 4 broad categories of effluent depending on their chemical composition: acido-basic effluent, chromic effluent, Zn and Ni effluent and concentrated acid effluent. These effluents, which are mainly polluted with Zn, Ni and Cr(VI), are the main issues to be dealt with by the industry. They are sent to a precipitation decontamination plant working with a continuous process. Only two categories of wastewater receive specific pre-treatment: chromic effluent undergoes a dechromatation step (reduction of Cr(VI) to Cr(III) by sodium bisulphite) and Zn–Ni baths are decomplexed by treatment with hypochlorite (bleach). The effluents are then known as pre-treated and decomplexed effluents. Note that chromic decomplexation effluent (containing mainly Cr(III) and Co) and decomplexed effluent (containing mainly Zn, Ni, and F) are not sent to the main treatment part at the same time, at least a day is left between processing these two types of effluent. All the water is then treated by metal sulphide precipitation and the resulting purified water, termed discharge water, is directed straight into the river.
2.2 Industrial discharge
To carry out our monitoring programme, every week we sampled the discharge characteristic of a day's work. Overall, the metal composition of 49 effluent samples was determined over a 1-year period. To respect the standards laid down by the local authorities (Table 1), the ST plant is required to carry out regular analyses of its discharge: levels of Cr(VI), Ni and Zn must be tested daily and three other metals, Cr(III), Cu and Fe, weekly. Each of the aliquots for analysis came from a sample characteristic of a day's work in the plant. The results for these 6 metals are expressed as mean daily concentration (MDC in mg·L−1) and as maximum daily flux (MDF in g·day−1) calculated knowing that the flow of purified water at the discharge outlet is 192 m3 per day.
Authorised levels of emission for the concentration (μg·L−1) and flux (g·day−1) for industrial discharges.
| Metal | Analysis frequency | MDCa authorised in μg·L−1 | MDCb discharged in μg·L−1 | MDFc authorised in g·day−1 | MDFb discharged in g·day−1 |
| Zinc | Daily | 3000 | 956 ± 1444 | 1300 | 184 ± 277 |
| Nickel | Daily | 2000 | 701 ± 1045 | 860 | 135 ± 201 |
| Chromium VI | Daily | 100 | 1.33 ± 4.62 | – | 0.26 ± 0.89 |
| Chromium III | Weekly | 2000 | 490 ± 558 | – | 94.1 ± 107 |
| Copper | Weekly | 2000 | 3.32 ± 7.56 | 860 | 0.64 ± 1.45 |
| Iron | Weekly | 5000 | 1626 ± 2029 | 2160 | 312 ± 390 |
a Mean daily concentration.
b Mean daily concentration (or weekly concentration, depending on the metal) over one year (data provided by the company).
c Maximum daily flux.
2.3 Assaying the metals
The metals (Ag, Al, As, Ba, Cd, Co, Cu, Cr, Cr(VI), Fe, Hg, Li, Mn, Mo, Ni, Pb, Pd, Pt, Sb, Se, Sn, Sr, Te, Tl, Ti, V, W, and Zn) were assayed by a certified laboratory following a standard protocol using an ICP-AES instrument [13]. The results are expressed in μg·L−1. The pH was measured using a portable pH meter (model 3110 WTW, Alès, France) and the values of the discharge pH were found to be relatively stable at around 7.9 ± 0.1, which was the mean value for all discharge samples.
3 Results and discussion
3.1 Analytical monitoring of the discharge
The primary aim of the study was to identify and quantify the metals present in the 49 samples taken over a year. The number of metals detected out of the 28 potential candidates varied between 6 and 13 with an average of 9 ± 2 (Fig. 1). Thirteen metals were found at least once: Co, Cr, Cu, Fe, Hg, Li, Mn, Mo, Ni, Pb, Se, Sn and Zn. This first result shows strong contamination with multiple metals concerning a relatively constant number of elements (RSD = 22%). Of the 13 metals found, 6 systematically occurred at detectable levels i.e. Co, Cr, Fe, Mn, Ni and Zn, which were essentially due to the industrial activity. The seven other metals, i.e. Hg, Se, Cu, Pb, Li, Mo and Sn, were found 7, 16, 21, 21, 22, 27 and 28 times respectively in the 49 samples. It is more difficult to determine the origin of these metals [7,14]. However, it can be assumed that the rarity of certain metals in the samples such as Sn and Mo is related to activities involving a variety of products (different parts treated at different times) and a variety of treatments (several different processes for different substrates) [12].

Number of metals found in each effluent sample over 49 weeks of sampling (1 sample taken per week).
Fig. 2 shows the variations of the concentrations (in μg·L−1) of the six metals found systematically in all 49 discharge samples. For Co and Mn a low variability in the quantities involved was noted (RSD values of 18 and 20% respectively). On the other hand, for the four remaining metals, the results (Fig. 2) show high variability (RSD of 70%, 81%, 56% and 62% for Cr, Fe, Ni and Zn respectively) with regular peaks. Table 2 illustrates examples of concentration of several metallic substances found in 5 of the industrial discharges (sample Nos. 1, 10, 19, 31 and 45). The levels of pollution were expressed both as concentrations in μg·L−1 and discharge flux in g·day−1. Overall, the results (Fig. 1 and Table 2) indicate the high variability of the discharges, confirming the annual values given to us by the ST company itself (high RSDs in Table 1). This can be accounted for by the great variability in the number of parts to be treated. As could be expected, the greater the industrial activity, the higher the concentrations of metals in the effluents at the inlet of the decontamination plant [14,15]. However, the decontamination plant's operation is constant and does not take into account these variations in the intensity of the factory's activity which can explain the higher concentrations found in the outflow [7,8,14,15].

Concentrations of Co, Cr, Fe, Mn, Ni and Zn (μg·L−1) in the 49 weekly sampling.
Examples of concentrations of metals in five representative samples of industrial wastewater (daily average concentration in μg·L−1 and flux discharged in g·day−1; flow rate = 192 m3·day−1).
| Metal | LQa | Sample 1 | Sample 10 | Sample 19 | Sample 31 | Sample 45 | |||||
| DCb | FDc | DCb | FDc | DCb | FDc | DCb | FDc | DCb | FDc | ||
| Hg | 0.1 | < LQ | – | 0.5 | 0.096 | < LQ | – | < LQ | – | < LQ | – |
| Cu | 5 | < LQ | – | 96 | 18.4 | 20 | 3.8 | < LQ | – | 19 | 3.6 |
| Li | 10 | 15 | 2.9 | 28 | 5.4 | 13 | 2.5 | < LQ | – | < LQ | – |
| Se | 10 | < LQ | – | 25 | 4.8 | < LQ | – | < LQ | – | 31 | 5.9 |
| Pb | 10 | 20 | 3.8 | < LQ | – | < LQ | – | 19 | 3.6 | 27 | 5.2 |
| Sn | 10 | < LQ | – | < LQ | – | 96 | 18.4 | 77 | 14.8 | < LQ | – |
| Mo | 10 | 17 | 3.3 | 21 | 4 | < LQ | – | < LQ | – | < LQ | – |
| Co | 10 | 417 | 80 | 920 | 176 | 629 | 121 | 654 | 125 | 614 | 118 |
| Cr | 5 | 156 | 29.9 | 776 | 149 | 1670 | 320 | 399 | 76.6 | 710 | 136 |
| Fe | 5 | 676 | 129 | 1398 | 268 | 5020 | 963 | 5296 | 1016 | 1025 | 196 |
| Ni | 10 | 368 | 70.6 | 680 | 130 | 1698 | 326 | 1500 | 288 | 520 | 99 |
| Zn | 10 | 410 | 78 | 878 | 168 | 4365 | 838 | 2337 | 448 | 702 | 134 |
| Mn | 10 | 28 | 5.4 | 51 | 9.8 | 33 | 6.3 | 47 | 9 | 61 | 11.7 |
a Limit of quantification in μg·L−1.
b DC = mean daily concentration in μg·L−1.
c FD = flux discharged in g·day−1.
3.2 Impact of the effluent at the inlet of the decontamination plant on the composition at the outlet
The second aim of the study was to find a relationship between the concentrations of metals in the effluent and the different types of wastewater at the inlet of the decontamination plant. In the results reported in Fig. 2, it can be noted that the levels of Co and especially of Mn remained relatively stable while for Cr, Fe, Ni and Zn concentration peaks occurred regularly. The reason could be that sending dechromated effluent into the decontamination plant leads to an increase of the Cr levels in the discharge. Six discharge samples (Nos. 7, 13, 19, 28, 35 and 49) were taken 24 h after dechromated effluent entered the decontamination unit. In these effluent samples, we observed a strong increase in the concentrations of Cr. Nine discharge samples (Nos. 4, 13, 19, 22, 25, 31, 37, 43 and 47) were also taken 24 h after decomplexed effluent (from the treatment of Zn–Ni baths by treatment with hypochlorite) entered the decontamination unit. In these samples, we also noted a strong increase in the concentrations of Zn, Ni and Fe (Fig. 2). When these two effluents are sent in a short span of time, Cr, Zn and Ni peaks can be seen together (samples 13 and 19). This shows the impact of these two types of effluents that are sent into the decontamination plant on the concentrations found in the final discharge. To demonstrate the impact of decomplexation effluent, four campaigns of daily discharge sampling were carried out. They served to monitor the concentrations of Zn and Ni as a function of the presence or absence of decomplexation effluent (campaigns 1,2 and 4 with and campaign 3 without). For this part of the study, the first samples were taken just before the fresh effluent was sent in, i.e. at t = 0 (campaign 1), t = 168 h (campaign 2) and t = 540 h (campaign 4) (Fig. 3). A sharp rise was noted in the concentrations of Ni and Zn in the effluents of the three campaigns 24 h after the decomplexation effluent was introduced (t = 24 h, t = 192 h and t = 528 h). The sample taken at t = 8 h (campaign 1) showed no significant increase in the concentrations of Zn or Ni. Eight hours was not sufficient to observe the impact, at the outlet, of an increase in pollution at the inlet of the plant. It was necessary to wait at least 72 h after the peak before concentrations returned to values similar to those noted before the decomplexation effluent was introduced. The same was observed in campaigns 1, 2 and 4. To sum up, the impact of introducing an effluent is notable for 4 days.
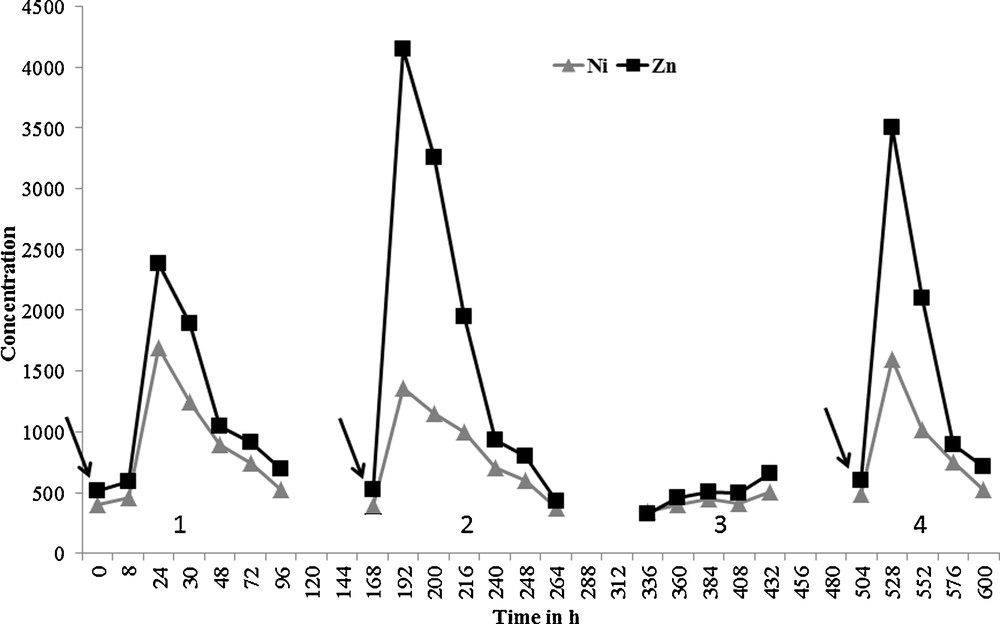
Influence of the introduction of decomplexation effluent (campaigns 1, 2 and 4) or not (campaign 3) on the concentrations of Ni and Zn (in μg·L−1) in the discharge sampled over a period of one month. The arrows indicate the time of introduction of the decomplexation effluent into the decontamination plant.
3.3 Discharge metal flux and current legislation
To calculate the values of the annual discharge flux, the Water Authority enables industries to consider values as zero when they are below the LQ [13]. We used the same approach to calculate the daily mean concentrations and the mean fluxes from our data reported in Table 3. The three main preoccupations in the ST industry are Zn, Ni and Cr(VI). The latter substance was never found (concentrations lower than the LQ) in any of the samples taken indicating the efficiency of the dechromatation treatment. The mean daily fluxes of Ni and Zn were 145 and 227 g per day. These values were very similar to those provided by the company in their compulsory annual declaration i.e. 135 g·day−1 Ni and 184 g·day−1 Zn (Table 1). The values for Cr and Fe were also comparable (Table 1). Moreover, the company's effluent respects currently authorized levels both for Zn and Ni and also for Cr(III), Cu and Fe, the three other metals that the company must monitor to maintain its industrial licence (Table 1). However, if the metal discharged is expressed in kilogrammes per year, the quantities can be seen to be non-negligible. For the six metals systematically found in the effluent, the discharge flux was 28 kg·yr−1 Co, 31 kg·yr−1 Cr, 104 kg·yr−1 Fe, 36 kg·yr−1 Ni, 57 kg·yr−1 Zn and 2 kg·yr−1 Mn. In total, 264 kg of metals (total for the 13 metals detected) were discharged per year, stressing that residual pollution in the effluent is far from negligible. Similar conclusion was published by several researchers working on effluents from mining industries [14–16].
Mean daily concentration (MDC) and maximum daily flux (MDF) for the 13 metals found in the discharge.
| Metal ion | MDC discharged (μg·L−1) | MDF discharged (g·day−1) |
| Co | 586 ± 103 | 113 ± 20 |
| Cr | 656 ± 457 | 126 ± 88 |
| Fe | 2172 ± 1577 | 417 ± 303 |
| Ni | 756 ± 423 | 145 ± 81 |
| Zn | 1184 ± 731 | 227 ± 140 |
| Mn | 45 ± 9 | 8.69 ± 1.76 |
| Hg | 0.1 ± 0.2 | 0.02 ± 0.04 |
| Cu | 14 ± 24 | 2.73 ± 4.66 |
| Li | 11 ± 14 | 2.17 ± 2.64 |
| Se | 9 ± 13 | 1.66 ± 2.46 |
| Pb | 10 ± 13 | 2.01 ± 2.48 |
| Sn | 46 ± 41 | 8.82 ± 7.93 |
| Mo | 16 ± 18 | 3.10 ± 3.41 |
4 Conclusion
The present study reports the analytical results obtained while monitoring the metal levels in the liquid discharge from a surface treatment plant. It is, to our knowledge, the first study to accurately detail the qualitative and quantitative composition, and the variability over time during a whole 1-year cycle of sampling. Of the 28 metals analyzed, 13 were detected and 6 (Co, Cr, Fe, Mn, Ni and Zn) were systematically present at quantifiable levels. This showed broad and highly variable polymetallic contamination. Authorized levels of discharge were never exceeded. The analytical results also showed the strong dependence of the levels in the discharge on the effluent at the inlet of the decontamination plant. It would be interesting to use the results obtained to optimize the management of the pollution peaks by fine-tuning the decontamination operation when problem effluent is to be disposed of. Moreover, in the framework of setting up a finishing treatment based on the use of selective ion exchange resins, to back up the current decontamination treatment by sulphide precipitation, the data in the present study could guide the company in its choice of chelating resins.
Acknowledgments
The authors thank the Agence de l’eau Rhône–Méditerranée–Corse, the Conseil régional de Franche-Comté and the Fonds européen de développement économique et régional (FEDER) for financial support (Project NIRHOFEX 2013-2016, “Extraction, Quantification, Removal and Risk Evaluation of Emerging Pollutants in Water Discharge from Treatment Surface Industries”). The authors also thank Peter Winterton (University Toulouse-3, Toulouse, France) for his critical reading of this paper, and Philippe Antoine (Galvanoplast Industrie, Les Aynans, France) for helpful discussions.