

1 Introduction
Obtaining more efficient organic conductors or semiconductors constitutes an important research field since the discovery of the TTF/TCNQ system in 1973 [1,2]. From this date until the present day, the applications of these materials have been abundant, for instance as electrode materials [3–7], potentiometric sensors [8,9], high-density molecular-based information storage media [10], and electrochromic devices [11]. The main characteristics identifying an organic conductor are mixed-valence (partial charge transfer state) and segregated stacking [12,13]. So, for the characterization of this class of solids, the knowledge of the mixed-valence value, originated by the co-existence of, at least, two oxidation states of a given species, is essential, this fact allowing electron transfers across the solid. Ionic complexes with complete charge transfer, such as KTCNQ (charge-transfer degree, ρ = 1) [14] or neutral covalent complexes, such as TCNQ-perilene (ρ = 0) [15,16], are found only in one oxidation state for each species, being insulators or, at best, semiconductors. On the contrary, mixed-valence complexes with partial charge transfer (0 < ρ < 1) can act as conductors, as is the case of TTF–TCNQ ρ = 0.59) [17], which presents more than one oxidation state.
TCNQ is the most commonly electron donor used to form organic conducting salts, this justifying the importance of the characterization of mixed-valence complexes based on the TCNQ0/+ couple. The voltammetric and chronoamperometric behaviours of this redox pair couple, deposited by abrasive attachment or drop casting on electrodes such as Au, Pt, glassy carbon or ITO [18–21], show that the electrochemical process is controlled by a nucleation and growth mechanism, in agreement with Eq. (1):
| (1) |
In the reduction reaction, the cation is introduced into the film to compensate the negative charge formed in the solid and, in the oxidation reaction, the cation returns back to the solution [20].
If all the TCNQ is reduced [12], no mixed-valence is present, and, consequently, the film cannot be a conductor. But when the TCNQ is only partially reduced, mixed-valence complexes are formed, this constituting one of the conditions necessary for obtaining a conductor material.
As a consequence, the determination of the stoichiometric ratio between the different oxidation states of a given species (or “state of charge”) present in the same solid will be a very important factor for the characterization of a possible conductor organic compound. In fact, it has become a critical factor in the comprehension of the behaviour of this kind of materials [18].
Among the methods used for determining if a solid is included in this category and, thus, the magnitude of the charge transfer, are found electrochemical quartz microbalance, X-ray diffraction, NIR or FTIR spectroscopy and Raman spectroscopy [18,19,22,23]. All these high-cost techniques require a high degree of specialization and a high number of measurements, this implying a large measurement time.
In this paper, an alternative method is proposed, in which only the obtaining of the spectrum of the solid is required, provided that a previous calibration, by measuring absorbances (A) at different wavelengths (λ) and concentrations (c) for each component, has been made for the concrete mixed-valence salt system. Once the corresponding molar extinction coefficients (ɛ) have been calculated, we can obtain the stoichiometric ratio between the different oxidation states R as the ratio between solution concentrations (R = c1/c2) by a simple iterative method.
The goal is to provide a versatile procedure susceptible to be applied to thin films of organic salts fixed to a solid support, in particular to the specific cases of abrasive attachment [24] and drop casting [21], though it should be applicable to other procedures for obtaining thin films, such as direct electrocrystallisation [25] or Langmuir–Blodgett attachment [26].
2 Experimental
7,7,8,8-Tetracyanoquinodimethane, TCNQ, over 98% pure and KCl over 99.9% pure were supplied by Fluka and used as received. Acetone, of purity > 99.5%, was supplied by Aldrich. The rest of the reactants were of analytical quality and used directly. All aqueous solutions were prepared in twice-distilled water from a Milli-Q system (18 mΩ) immediately before the experiment, in order to avoid any possible instability in solution.
Voltammetric measurements were made on an Autolab PGSTAT30 potentiostat controlled via GPES software. The working electrode was a glassy carbon disk with a surface area of 0.785 ± 0.005 cm2, the auxiliary electrode a glassy carbon electrode, and the reference electrode, to which all potentials given here are referred, Ag|AgCl (3.0 M KCl).
For spectroscopic measurements, a Varian Cary ELO 100 Bio spectrophotometer (0.02-nm resolution) was used with Hanna quartz cuvettes of 1.0-cm path length.
The spectra used for the calibration of TCNQ were obtained directly from solutions of known concentrations of TCNQ in acetone. TCNQ−was obtained in the laboratory by electrocrystallisation using the following procedure: an exactly weighted quantity of TCNQ was deposited onto a glassy carbon electrode that was immersed in a solution containing K+ ions. Then, a scan was made from 0.2 V until a final potential of –0.1 V at v = 1 mV/s. This potential is negative enough to reduce all the TCNQ in the presence of potassium ions, as was previously reported [21]. Coulometric measurements of the reduction process showed that the charge corresponded exactly to the amount of TCNQ deposited onto the electrode surface. After this exhaustive reduction, the electrode is removed from the solution and immersed in an exactly measured volume of acetone, this allowing the preparation of a stock solution of known concentration of TCNQ−.
3 Results and discussion
3.1 Proposed model
Previous requirements to ensure the applicability of the method are:
- • the species involved in the mixed-valence complex must absorb in the UV-visible range;
- • the spectra of both species must follow the Lambert–Beer law in the range of concentrations studied;
- • the spectra of both species must be different at least at two wavelengths.
Let us to call Ox/Red to the species involved in the mixed-valence complex.
Let us consider a mixture of concentrations c1 of Ox and c2 of Red. Provided that the Lambert–Beer law is followed, the total absorbances, A and A′, measured at the wavelengths λ1 and λ2, respectively, are given by:
| A = ɛ1c1 + ɛ2c2 | (2) |
| A′ = ɛ′1c1 + ɛ′c2 | (3) |
When there are no experimental difficulties measuring the molar extinction coefficients involved in Eqs. (2) and (3), it is easy to obtain the ratio R = c1/c2:
| (4) |
However, if the absorbance corresponding to one of the species (Ox or Red) is very low at one of the selected wavelengths, λ1 or λ2, the uncertainty in the corresponding molar extinction coefficient is high, this preventing the use of Eq. (4), directly. In this case, a calculation procedure must be used.
Let us assume that ɛ′1 is low, and note B = ɛ′1/ɛ1. Replacing ɛ′1 in Eq. (3) and operating, the following expression is obtained:
| (5) |
So, the plot of [A/(A′–AB)] vs. R must be linear.
Particular cases:
(a) ɛ′1≈ 0
In this case, B≈0 and Eq. (5) simplifies to:
| (6) |
and R can be determined directly.
(b) General case: B is not zero at all, but its value cannot be determined with sufficient accuracy. The full Eq. (5) must be employed.
To use this equation, it is essential to calculate an accurate B value. The strategy here proposed consists in considering B as an adjustable parameter and calculating it by using a different approach based on a method previously described for chronoamperometric curves [27] and difference spectroscopy [28]. Eq. (5) can be written as:
| F(A,B) = α·R + β | (7) |
where,
| (8) |
The plot of F(A,B) vs. R should yield a straight line and the values of α and β can be obtained from a simple least-squares analysis. Since B is unknown, it will be calculated by the following iterative method. First, it is assumed that one knows that the actual B value is comprised within a known interval [Bmin, Bmax]. This interval is divided into k subintervals of the same amplitude, δ, and thus k + 1 values of B can be tested (proof values). F(A,B) can be calculated for every proof value of B, and by applying the linear regression analysis for Eq. (7), α, β, and the residual sum of squares, Sres, are obtained. Sres must have a minimum value in the vicinity of the actual value of B. Hence, if Sres is minimum for a given proof value, Bj, the interval can be restricted to [Bj–δ/2, Bj + δ/2], which must include the actual value of B. So, the procedure is applied repeatedly until the desired precision is achieved.
3.2 Application to the TCNQ/TCNQ− mixed-valence complex
Fig. 1 shows the UV-visible spectra of both species as functions of the concentration, together with the absorbances (insets) at 396 nm (λ1) and 846 nm (λ2). These λ values correspond to the range where the absorbance values are relative maxima.
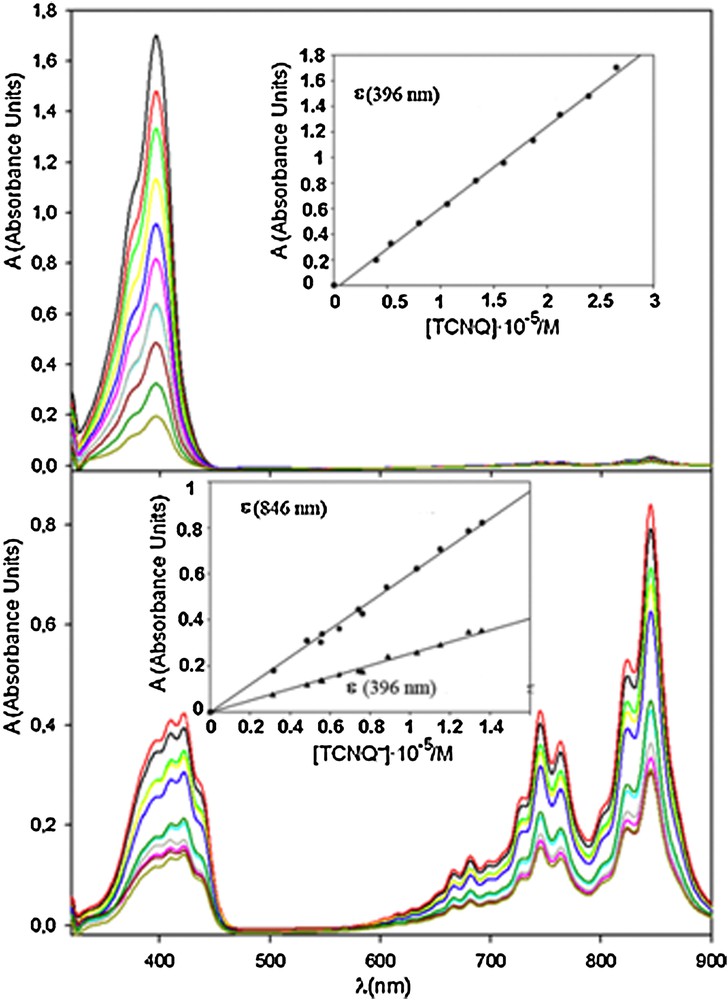
(Colour online.) UV-visible spectra for TCNQ0 (up) and TCNQ−(down) at different concentrations. Insets: calibration curves corresponding to these spectra.
As can be seen, the A vs. c plots were linear and the extinction molar coefficients obtained from their slopes were 25,010 M−1·cm−1 (ɛ2) and 62,312 M−1·cm−1 (ɛ′2) for TCNQ−at 396 nm and 846 nm, respectively, and 63,719 M−1·cm−1 (ɛ1) for TCNQ0 at 396 nm. In the latter case, the low signal/noise ratio at 846 nm prevented the calculation of an acceptable value for ɛ′1.
The UV-spectra of solutions containing both TCNQ0 and TCNQ−at different R-values were recorded (Fig. 2).
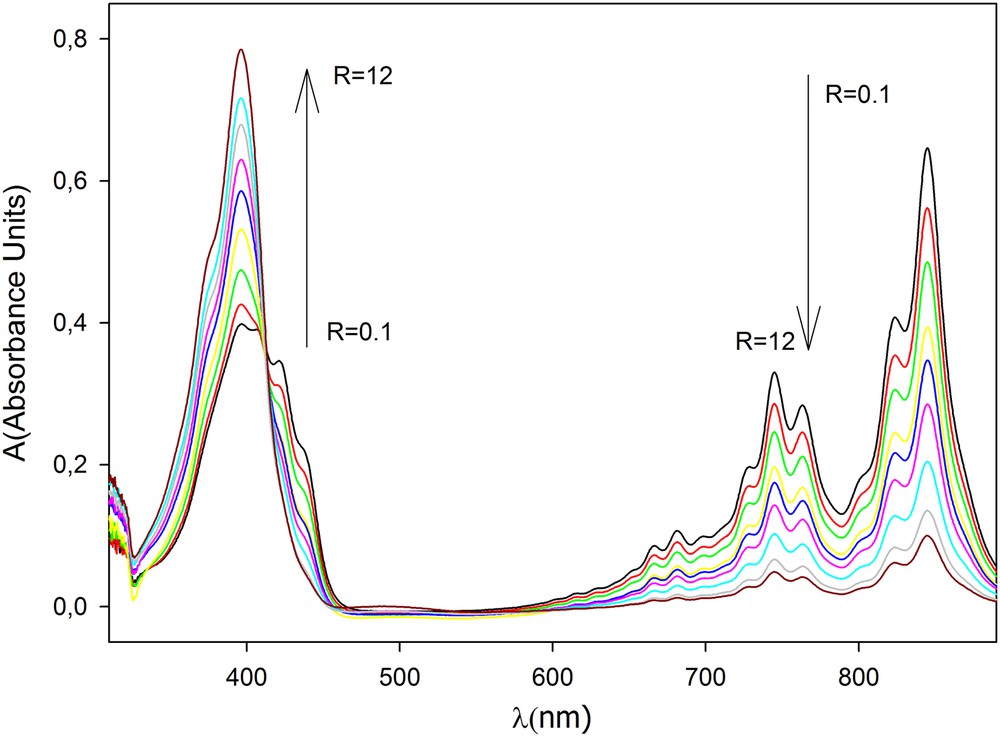
(Colour online.) Spectra obtained for solutions containing both TCNQ0 and TCNQ−at different R-values between R = 0.1 and R = 12.
Fig. 3 shows the application of the above-described procedure to the general case of the data obtained from the spectra. As can be seen, the plots have the shapes expected, and a value of B = 0.06442 was obtained.
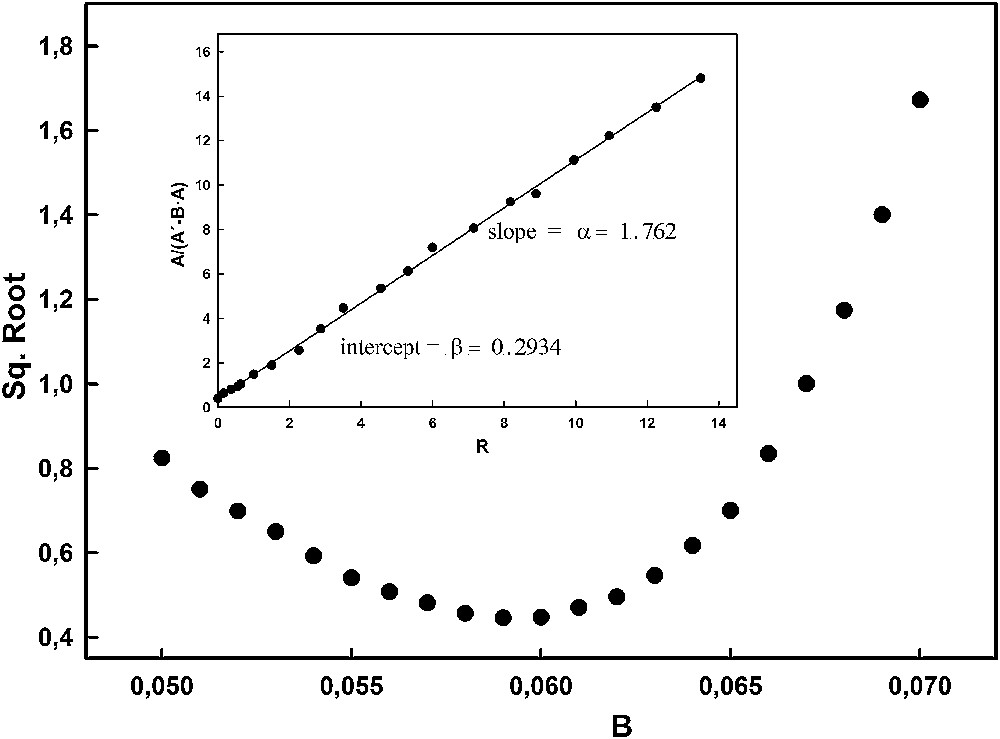
Residual sum of squares for the series of data represented in Fig. 2 at increasing B values between 0.05 and 0.07. Inset: Plots of A/(A′–BA) for B = 0.06442 vs. R.
The plot corresponding to equation (5) for the calculated B value is linear (inset in Fig. 3), this indicating that this value is correct. The parameters corresponding to this equation are:
B = 0.06442, α = 1.7622, β = 0.2934.
The procedure has been also applied to other pairs (λ1,λ2) with λ1 ranging between 388 and 404 nm and λ2 ranging between 838 and 854 nm.
In Table 1 are shown the results obtained with some of these pairs as an example. The parameters (B, α and β) obtained at each pair of wavelengths are characteristic of the TCNQ0/TCNQ−mixtures.
Data obtained for TCNQ0/TCNQ−mixtures according to Eq. (5) for various pairs of wavelengths λ1 and λ2. ACs corresponds to the absorbance value obtained from spectrum shown in Fig. 4 .
| (λ1,λ2)/nm | B | α | β | ACs (λ1) | ACs (λ2) | R (Cs) |
| (388, 854) | 0.05035 | 2.1637 | 0.4156 | 0.3274 | 0.2279 | 0.52 |
| (396, 846) | 0.06442 | 1.7622 | 0.2934 | 0.3673 | 0.3420 | 0.48 |
| (396, 838) | 0.05088 | 2.3213 | 0.3476 | 0.3673 | 0.2667 | 0.49 |
| (404, 838) | 0.06030 | 1.9888 | 0.3956 | 0.3486 | 0.2667 | 0.51 |
It must be noted that, although in the obtaining of mixed-valence salts of TCNQ−the eventual dimer formation could potentially affect the charge-transfer degree, this is irrelevant in the actual case, because the parameter obtained with the proposed method is the state of charge and not the charge-transfer degree.
3.3 Validation of the method
For the validation of the proposed method, the well-known Cs2TCNQ3 system, (Cs+)2(TCNQ−)2(TCNQ)1 was selected. For this system, the R value is 0.5, obtained independently by coulometric [29] and X-ray [30] measurements.
It is important to take into account that the proposed method is only applicable if solid mixtures of TCNQ and TCNQ−dissociate in solution to free TCNQ and free TCNQ−, as is the case for Cs2TCNQ3.
Cs2TCNQ3 salt was experimentally synthetized by electrochemical reduction of TCNQ in the presence of CsCl, as described in [28]. The solid obtained in the reduction was removed from the electrode and dissolved in acetone. Then, the corresponding spectra, shown in Fig. 4, were recorded. The absorbance values (ACs) at selected wavelengths are shown in Table 1. From these values, and by applying equation (5) with the calculated parameters for each pair of wavelengths, a value of R (Cs) = 0.50 ± 0.02 was obtained (Table 1), in good agreement with the expected B value of 0.5.
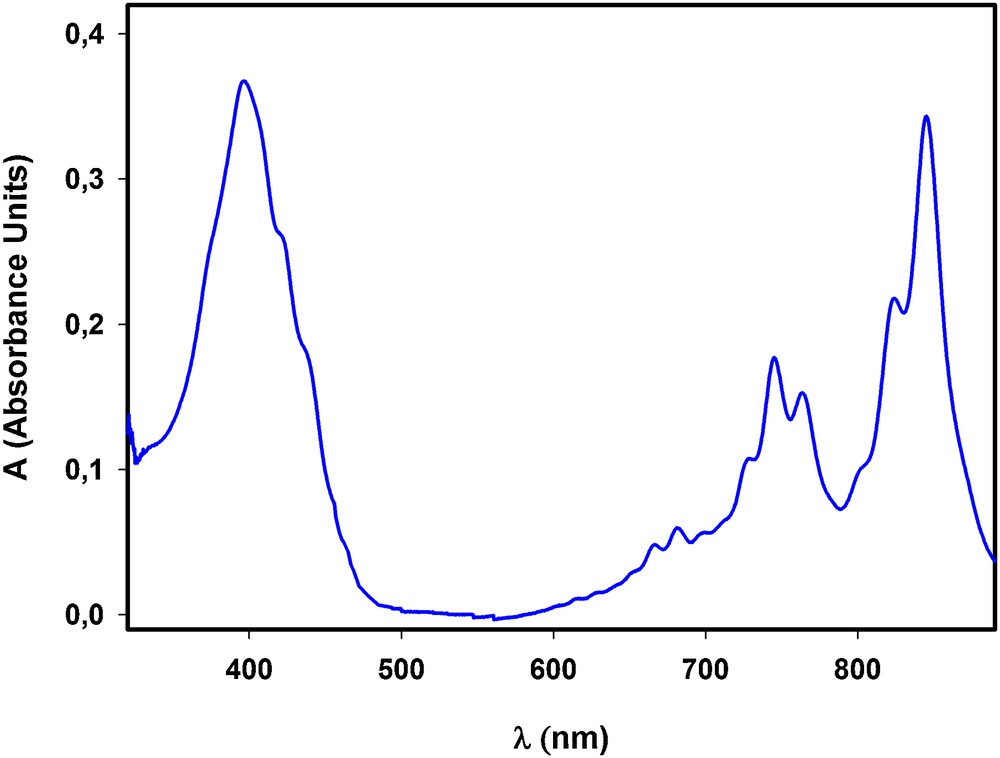
(Colour online.) Spectrum obtained for a Cs2TCNQ3 salt dissolved in acetone.
From all these results, it is evident that when equation (5) is calibrated for a given system, it is not necessary to make additional calibrations for the different media in which this system can be involved, other than to record one UV-visible spectrum. So, it is not necessary to know how much matter is present on the electrode surface at the initial time (abrasive voltammetry), or at a given moment in the redox process, this being an advantage, since it is not easy to control the amount of matter that has been dissolved.
3.4 Application to tetraethylammonium salts.
The method has been applied to salts of TCNQ formed with tetraethylammonium (TEAM+) cation, whose electrochemical behaviour has been reported in the literature [31], but their state of charge has not been determined, as far as the authors know. For TEAM+, a known quantity of TCNQ0 was deposited onto the electrode surface and then the electrode was immersed into a 0.1 M aqueous solution of tetraethylammonium bromide. Fig. 5 shows the voltammogram recorded for this solution. After the first voltammetric scan, the solid obtained in the reduction was removed from the electrode and dissolved in acetone. The UV-visible spectrum of this product is also shown in Fig. 5.

(Colour online.) Voltammograms at 1 mV/s of the first reduction process of TCNQ in 0.1 M K+ and 0.1 M TEAM+ solutions, with the same initial amount of TCNQ. Inset: Spectra obtained for TEAM+ in acetone.
Application of equation (5) with the absorbance values obtained from this spectrum, together with the corresponding B, α and β values found above, yielded a result of R = 2.0 ± 0.23.
When experiments were made with different starting quantities of TCNQ0, similar R-values were obtained; this was also the case when the same starting quantity of TCNQ0 was used and two to five voltammetric cycles were recorded. So, the R value is independent of the starting quantity of TCNQ0 and of the number of voltammetric cycles. The only remark to take into account is that, as the deposited TCNQ0 quantity decreases, the imprecision of the absorbances in the UV-spectra increases because of their decreasing values and, consequently, the uncertainty in R increases.
The data obtained from coulometric measurements were in good agreement with those reported here. So, from these measurements, it was concluded that 32 ± 3% of the TCNQ0 deposited on the electrode was reduced, this corresponding to R ≈ 2.
According to these results, it can be proposed that the salt obtained in the reduction of TCNQ in TEAM+ should be (TEAM+)1 (TCNQ−)1 (TCNQ)2
In addition to providing the state of charge of the salt, the proposed method can be very useful to unequivocally establish the reproducibility of the solid obtained, or even to detect non-reproducible solid formation, by means of simple spectroscopic measurements.
Finally, this procedure can be applied in a general manner to compounds potentially forming part of mixed-valence systems, other than the TCNQ derivatives.
4 Conclusions
The proposed method provides an alternative way for the determination of the state of charge of TCNQ0/−mixed-valence compounds by means of simple spectroscopic measurements.
The parameters (B, α, and β) obtained for each pair of wavelengths are characteristic of the TCNQ0/TCNQ− mixtures.
It has been successfully applied to the well-known Cs2TCNQ3 salt (R = 0.5) and tentatively for TCNQ-tetraethylammonium system (R = 2), whose structure has been not reported to date.
This method could be used under a wide variety of experimental conditions, being adequate to investigate the influence of such conditions in the state of charge of the salt.
Acknowledgements
Financial supports from Junta de Andalucía (Research Group FQM-0198), University of Córdoba and Spanish Government (Project CTQ2011-28973) are gratefully acknowledged.