

1 Introduction
For liquid water, which is a hydrogen-bonded liquid, there still remain fundamental questions. A consideration of these questions is crucial for interpretation of the vibrational spectra of the liquid.
The bending and stretching modes of water molecules are near 50 THz and 100 THz, respectively. Below the bending and stretching bands, there are two pronounced features near 5 and 20 THz in the experimentally measured spectrum of water [1]. The low frequency spectrum is dominated by a resonance structure in the range between 10 and 30 THz, which is attributed to molecular vibrations [2–4].
In the 0–10 THz region, two peaks are identified. A well-defined peak at 5.1 THz is attributed to the stretching of hydrogen bonds and a peak near 1.8 THz is assigned to the bending of the hydrogen bonds between water molecules [2–4]. These peaks can be explained by the dipole moments induced by the dipoles on the surrounding molecules [5–7]. The 5.1 THz peak can be associated with primarily oxygen-oxygen motion [8]. Simulations have provided insight into the physical properties of water. The spectrum of liquid water has been calculated using rigid-molecule molecular dynamics [5–10]. The simple point charge model for water produced results, which compared well to experimental results from 0.03–30 THz [11]. The features in the range below 10 THz have been reproduced by molecular dynamics simulations using pairwise additive potentials and rigid molecules [5–9].
An important question for interpretation of vibrational spectra concerns the typical size of the volume, or equivalently, the number of molecules influencing molecular motion associated with vibrational modes of liquid water. With respect to this question observations include the following.
The molecular environment surrounding each water molecule can be represented by a small subset of a bulk simulation [12] or isolated clusters of varying size and temperature [13]. Molecular clusters of water are of interest for study because of their presence in the earth's atmosphere [14]. High-resolution IR studies of dimers and trimers have been reported [15,16]. The high frequency vibrations of water clusters, which are within the bending and stretching bands, have been measured experimentally [17–19]. These systems have been studied extensively by a variety of theoretical methods [20–32], and the structures of the smaller clusters are well known. Cluster vibrations have been studied using molecular dynamics (MD) [20–22,26], normal mode analysis based on Monte Carlo (MC) [24,25], molecular mechanics [27], and by using semi-empirical [26] and ab initio [26,29–32] determination of the structures.
DFT has been successful in description of vibration spectra of energetic materials, for both single molecules and molecular crystals [33–41]. Such calculation results allow interpretation of absorption spectra dependence upon molecular structure in various materials, commonly encountered in a variety of detection scenarios. For example, the calculated absorption spectra of isolated molecules can be used to identify a material's intramolecular vibrational modes. Various studies have used the general concept of constructing dielectric response functions using DFT for numerical simulation of explosives detection scenarios [41–43]. In these studies the DFT calculations were implemented using the computer program GAUSSIAN09 (G09) [44]. Earlier studies have examined the properties of water molecules and water clusters [45–53].
2 Calculations and results
The present study considers DFT calculation of absorption spectra of vibrational states, which includes the THz range of frequencies. In this section are presented the procedure for calculation of absorption spectra corresponding to vibrational states [41–43].
DFT calculations can be used to compute an approximation of the IR absorption spectrum of a molecule or molecules [54–60] following standard procedures. Reference [60] presents a fairly detailed review of these procedures.
2.1 Ground state resonance structure of crystal-like water clusters
In this sections are presented the results of computational investigations using DFT concerning crystal-like ordered water clusters of various sizes. These results include the stable structures of the water clusters after geometry optimization and IR spectra. A DFT quantum model, B3LYP [61,62] and basis function 6-311+G(d) [63–65] was used for geometry optimization and calculation of IR spectra. Geometry optimization and vibrational analysis (IR) were also performed with a water solvent background using the SCRF (self-consistent reaction field) technique, with a background whose dielectric constant was that of water, having a value of 78.3553 [44] at room temperature (298.15 K).
A graphical representation of molecular geometries of crystal-like water clusters consisting of 5, 12, 24 and 38 molecules are shown in Fig. 1 (a) through (d), respectively. The relative positions of the molecules associated with each of the crystal-like molecular clusters are selected according to [51]. The relaxed or equilibrium configurations of the liquid phase water clusters consisting of 5, 12, 24 and 38 molecules are given in Tables 16, 19, 22, and 25, respectively of reference [66]. The ground-state oscillation frequencies and IR intensities for the different molecular clusters, corresponding to their relaxed equilibrium configurations, are calculated by DFT according to fixed atomic positions. In the cases of crystal-like water clusters consisting of 5, 12, 24 and 38 molecules, these values are given in Tables S1 and S2 of supplemental materials, without and with a water solvent background, respectively. The IR spectrum for the crystal-like water clusters consisting of 5, 12, 24 and 38 molecules are shown in Figs. 2 and 3, without and with a water solvent background, respectively. Also shown in Figs. 2 and 3 are THz absorption spectra of liquid phase water at approximately 20 °C. These spectra were calculated using experimentally determined values of the permittivity function [1].
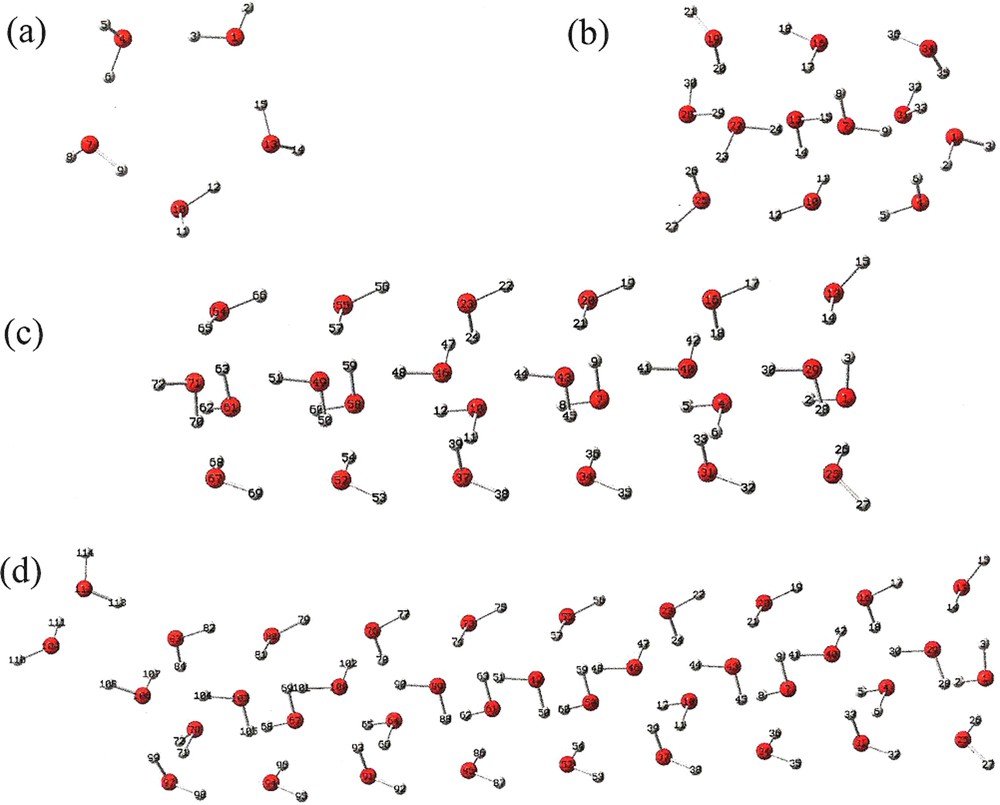
(Color online.) Molecular geometry of crystal-like water cluster consisting of (a) 5 (Table 16 of [34]), (b) 12 (Table 19 of [34]), (c) 24 (Table 22 of [34]), (d) 38 (Table 25 of [34]).
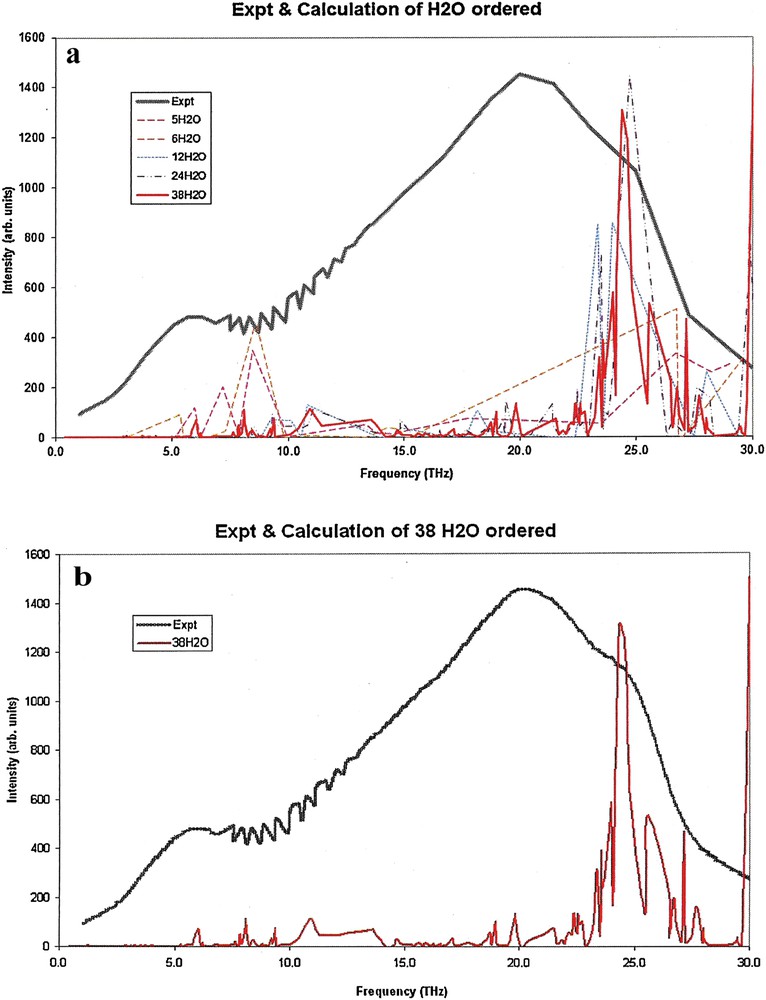
(Color online.) DFT calculated THz absorption spectra for crystal-like molecular clusters of water compared with experimentally measured spectra. a: spectral contributions are shown for each of the clusters of size 5, 6, 12, 24, and 38. The experimental spectrum is shown as a solid black line; b: spectral contributions shown include only the cluster of size 38, and the experimental spectrum which is shown as a solid black line.

(Color online.) DFT calculated THz absorption spectra for crystal-like molecular clusters of water, with water background, compared with experimentally measured spectra. a: spectral contributions are shown for each of the clusters of size 5, 6, 12, 24, and 38, in a continuum background water solvent. The experimental spectrum is shown as a solid black line; b: spectral contributions shown include only the cluster of size 38, in a continuum background water solvent, and the experimental spectrum which is shown as a solid black line.
2.2 Ground state resonance structure of liquid-like water clusters
In this section, the initial configuration of the liquid-like clusters, prior to relaxation, was constructed using results of an 8 ps molecular dynamics simulations, which used model designations and parameters DFT/BLYP (code is CP2K, GTH pseudo-potentials, DZVP basis, 280 eV cutoff), T = 300 K, 0.5 fs time step, constant volume. The input to that simulation was a configuration from the end of a long (1 ns) flexible MM (potential was TIP3P) simulation with T = 300 K and 0 pressure. The procedure of constructing the initial configuration of the liquid-like clusters entailed cutting out clusters of whole water molecules, which included all O atoms within some distance of a particular central O atom (distances are 2, 3, 4, 5, 6 Å) [67]. DFT geometry optimization was applied to the initial configurations. The DFT vibrational analysis was performed for optimized structures of the liquid-like clusters. For the liquid-like clusters, the calculations were performed with the same DFT functional and basis as those for the crystal-like clusters.
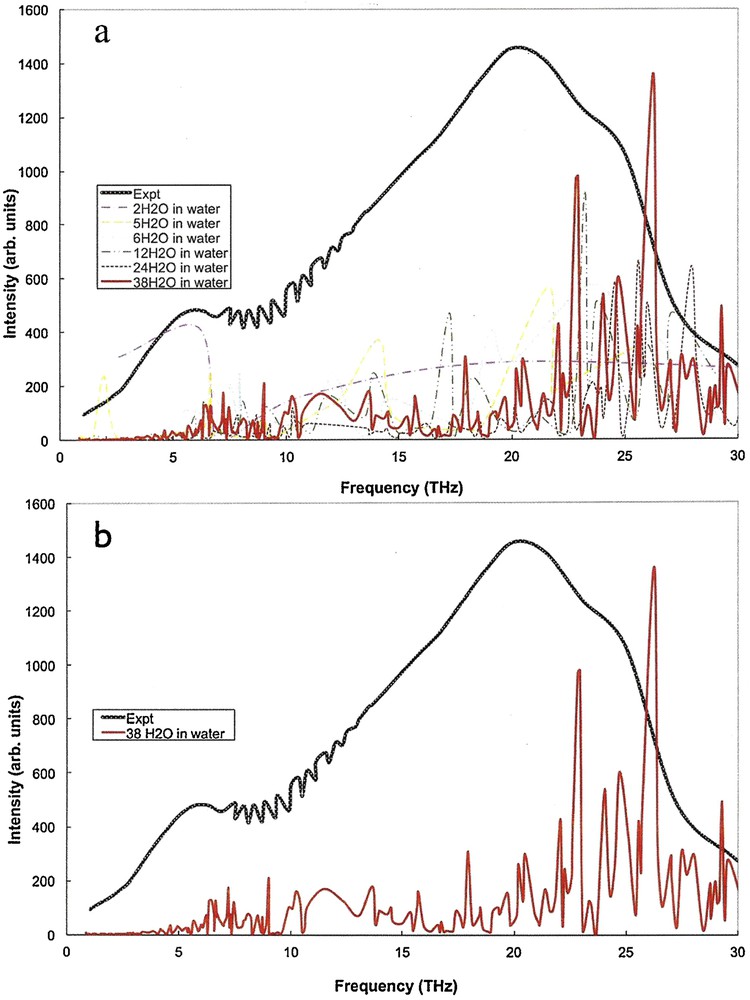
A graphical representation of molecular geometries of water liquid-like clusters consisting of 2, 5, 12, 24 and 38 molecules are shown in Fig. 4 (a) through (e), respectively. It is significant to note that the relative positions of the molecules associated with each of the molecular clusters are selected according to the water molecules in a liquid-like cluster prior to relaxation. The relaxed or equilibrium configurations of the water clusters consisting of 2, 5, 12, 24 and 38 liquid-like ordered molecules are given in Tables 1, 4, 7, 10 and 13, respectively, of [66]. Again, the ground-state oscillation frequencies and IR intensities for the different molecular clusters, corresponding to their relaxed equilibrium configurations, are calculated by DFT according to fixed atomic positions. In the cases of water clusters consisting of 2, 5, 12, 24 and 38 liquid-like ordered molecules, these values, which represent calculations of THz absorption spectra, are given in Tables S3 and S4 of supplemental materials, without and with a water solvent background, respectively. IR intensities as a function of frequency for the water clusters consisting of 2, 5, 12, 24 and 38 liquid-like ordered molecules, are shown in Figs. 5 and 6, without and with a water solvent background, respectively. Again, also shown in Figs. 5 and 6 are experimentally measured values of the THz absorption spectra of liquid phase water [1].
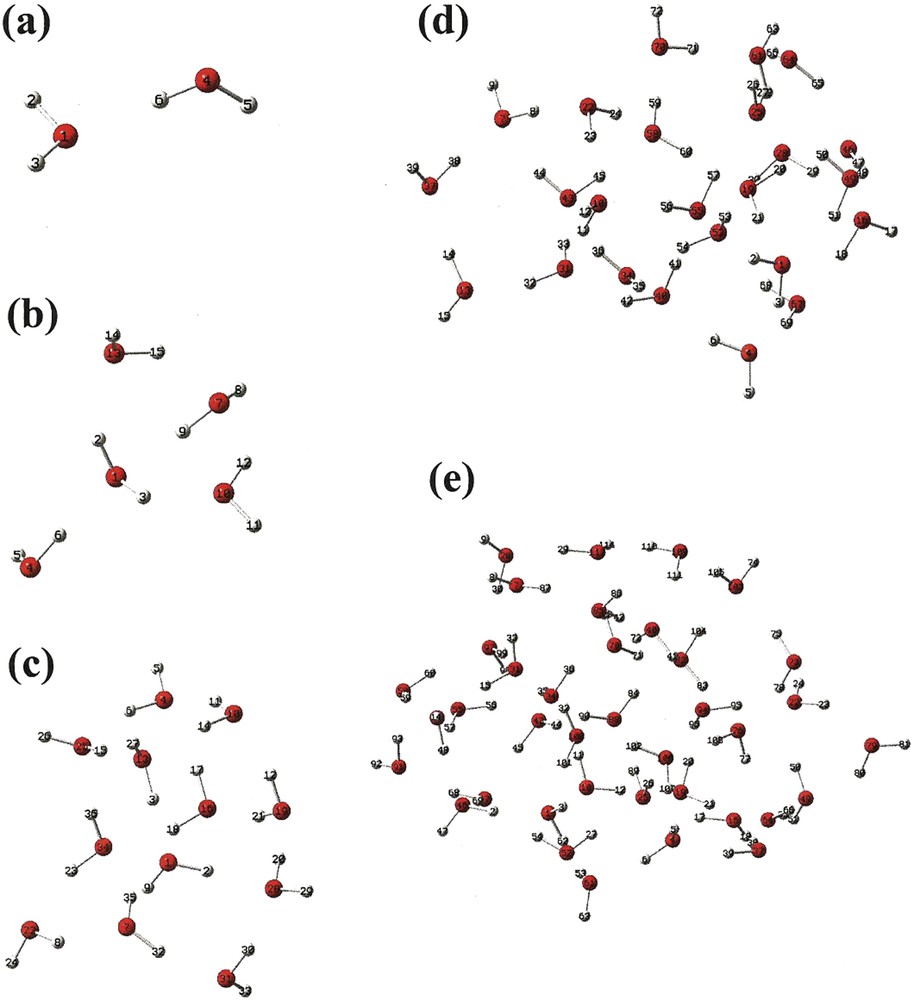
(Color online.) Molecular geometry of liquid-like water cluster consisting of (a) 2 (Table 1 of. [34]), (b) 5 (Table 4 of [34]), (c) 12 (Table 7 of [34]), (c) 24 (Table 10 of [34]), (d) 38 (Table 13 of [34]).

(Color online.) DFT calculated THz absorption spectra for liquid-like molecular clusters of water compared with experimentally measured spectra. a: spectral contributions are shown for each of the clusters of size 5, 6, 12, 24, and 38. The experimental spectrum is shown as a solid black line; b: spectral contributions shown include only the cluster of size 38, and the experimental spectrum which is shown as a solid black line.
(Color online.) DFT calculated THz absorption spectra for liquid-like molecular clusters of water, with water background, compared with experimentally measured spectra. a: spectral contributions are shown for each of the clusters of size 5, 6, 12, 24, and 38, in a continuum background water solvent. The experimental spectrum is shown as a solid black line; b: spectral contributions shown include only the cluster of size 38, in a continuum background water solvent and the experimental spectrum which is shown as a solid black line.
3 Discussion
Vibrational spectra for clusters of water molecules in crystal-like and liquid-like clusters have been calculated using DFT. For both types of clusters the positions of molecules are optimized to minimize the total energy. In the liquid phase, the total energy is expected to have multiple minima. At substantially low temperature below the melting point, these minima can be associated with the configuration energy of an amorphous solid, whose structure is not characterized by translational invariance of a crystalline lattice having long-range order. It is significant to note, however, that both liquids and amorphous solids may be characterized by short-range order originating from the hydrogen bonding between the molecules. Although bond lengths and bond angles vary through the structure, these variations are small relative to the size of bond lengths and angles.
The vibrational spectrum of a single isolated water molecule consists of three lines corresponding to three eigenmodes, whose frequencies are 107.55 THz, 105.18 THz and 56.55 THz. Within a molecular cluster of water molecules, owing to interaction between the molecules, the single molecule modes spread into bands whose width is on the scale of frequencies corresponding to intermolecular coupling. Referring to Figs. 2, 3, 5 and 6, this effect can be observed for both crystal- and liquid-like water clusters. This effect of single molecule vibrational modes spreading into bands has been demonstrated for the case of THz spectral features of molecular clusters of RDX [68].
An understanding of the general difference between spectral features of the crystal-like and liquid-like molecular clusters of water follows from comparison of the nature of vibrational modes in crystalline and amorphous structures.
In the crystalline structure, the coupled modes, which are characterized by a well-defined wavenumber, spread through the entire lattice. The vibrational frequencies with various wavenumbers fill bands whose width is on the scale of intermolecular vibrational frequencies. The low frequency modes are associated with the long wavelength oscillations of the unit cells. These acoustic type modes should not contribute noticeably to the IR spectrum since these modes do not substantially change the dipole moments in the molecular structure. The optically active modes generally occupy a higher range of frequencies. In the amorphous structure, the level of disorder is such that mixing of various wavenumbers can occur, resulting in the localization of vibrational modes. The disorder in the positions of molecules and their coupling leads to a broadening of the spectrum, which is wider than in crystal-like clusters.
Figs. 2, 3, 5 and 6 show the optical type modes in the IR frequency range of 3–30 THz. The optical bands are higher than the range of acoustic modes, but still substantially lower than the frequencies of intramolecular vibrations. Even at the long wavelength limit, optical modes are associated with variations in position and orientation of molecules at relatively small distances. In the crystal-like clusters shown in Figs. 2 and 3, the spectrum consists of a small number of relatively narrow frequency bands having widths on the scale of relatively uniform distributions of intermolecular couplings.
For substantial disorder, the fluctuations of the frequencies associated with intermolecular coupling that can be comparable or in excess of the width of frequency bands in crystalline structure. This large broadening can be observed from comparison of Figs. 2, 3 and Figs. 5, 6. The spectrum of the liquid-like clusters consists of a large number of peaks that are spread over a range of frequencies, which are wider than the width of the frequency bands in the spectrum of the crystal-like clusters.
Next, it is to be noted that the long wavelength spectrum of the molecular clusters is affected by the finite size of the cluster used for DFT calculations. In particular, the low frequency range Δf corresponding to these modes for the 38-molecule cluster (Fig. 4 e) is for L = min (Lx, Ly, Lz) ≈ 1 nm, where Lx, Ly, Lz are the volumetric dimensions of the molecular cluster and Cs is the speed of sound (1400–1500 m/s). Accordingly, an estimate of Δf ≈ 1.5 THz is obtained.
Comparison of Figs. 2 and 3, IR spectra for crystal-like clusters, indicates that the presence of a water solvent background induces a shift of spectral peaks to lower frequencies, which is appreciable relative to that of liquid-like ordered structure. This result is consistent with the relatively narrow distribution of frequencies in the crystal-like clusters, where the effect of the background leads to a relatively uniform shift of all frequencies that are within bands. For the liquid-like clusters, comparison of Figs. 5 and 6 with Figs. 2 and 3 indicates a less noticeable shift of spectral peaks to lower frequencies as a result of the presence of a water solvent background. This result is consistent with a wide distribution of frequencies, as well as a wide distribution of shifts, associated with intermolecular forces influenced by a solvent background. It is important to note that a large number of disordered configurations are possible for liquid water at temperature above melting. Our calculation is of just one possible configuration, and to properly reproduce results for the liquid would require averaging of spectra over an ensemble of configurations. We expect that the overall spread of frequencies is reasonably represented in our calculated spectrum, but other features may not be.
The absorption spectra shown in Figs. 2, 3, 5 and 6 are compared with the experimentally determined absorption coefficient α of liquid water for the frequency range 0 to 30 THz [1]. In that the absorption coefficient α is defined by the relation
| (1) |
4 Summary
The calculations of resonance structure of vibrational modes associated with crystal-like and liquid-like ordering of molecular clusters of water molecules using DFT are meant to provide physical interpretation of measured spectra in terms of molecular level response characteristics. With respect to spectroscopic methods of analysis, the calculated resonance spectra presented serve the purpose of isolating spectral features for correlation with the structure of molecular water clusters.
As indicated above, using DFT for the calculation of absorption spectra is according to the perspective of computational physics, which is that a numerical simulation represents another source of “experimental” data. With respect to this perspective, the results of computational experiments given in this paper, which are the THz absorption spectra for molecular clusters of water for different cluster sizes, molecular ordering and ambient environments, are presented as experimental-like data to be available for further analysis and interpretation by comparison with other laboratory and computational experiments. We mention in passing that the calculations clearly show that water clusters of size used here need a continuum background to replicate the experimental spectrum (Fig. 3). The question therefore arises how many discrete water molecules would be required to replicate the experimental spectrum without background. This we posit as a question for further study.
Acknowledgments
Funding for this project was provided by the Office of Naval Research (ONR) through the Naval Research Laboratory's Basic Research Program.