

1 Introduction
Because of their large exposed surfaces and specific properties, the new generation of semi-conducting oxide nanoparticles (NP) are attractive for several applications in energy. They have been tested for applications, like H2O electrolysis and H2 formation and in heterogeneous photocatalysis. In photocatalysis, a photon is absorbed to generate electron-hole pairs and active intermediates, important for oxidation reactions. Basic fundamental aspects have been summarized in previous review articles [1,2]. The more recent aspects of solar energy conversion and the technical barriers in semi-conductor-based catalysis have been very recently reviewed [3,4]. The used materials might enable light absorption, separate electron-hole pairs, migration of the two active species and their transfer to the surface was reagents are absorbed and can be modified. Titanium oxide is the most used representative oxide but iron oxides have also been introduced because of their absorption in the visible range and also of magnetic properties that helps catalysts recovery after reaction [5]. In order to design new efficient Fe-based catalysts, it was demonstrated that isolated Fe-ions and dispersed iron oxide NP with several allotropic varieties can be obtained by using 2D hexagonal SBA-15 silica as support. Fe/SBA-15 catalysts were used for selective oxidation reactions in the gas phase [6,7] as well as in the liquid phase for the transformation of phenol derivatives, such as catechol and hydroquinone [8] and also for water purification treatments (in particular by dyes decomposition [6,9,10]). To the best of our knowledge, interrogations remain about the nature of Fe-species responsible for the catalytic activity of Fe-SBA-15 catalysts and also about their long-term stability since a silica dissolution associated with a photo-activated corrosion of Fe-species have been observed, at neutral pH and in basic aqueous solutions [11].
We previously reported about Fe/SBA-15 catalysts obtained with SBA-15 silica prepared in standard conditions, using a copolymer triblock as structuring agent and tetraethoxyorthosilane, TEOS, as Si-precursor and an initial highly acidic HCl solution aimed at favoring TEOS hydrolysis and condensation (2 mol·L−1, [12]). Because of a condensation treatment in hydrothermal conditions at 130 °C for 24 h, parallel main mesopores were interconnected. Indeed, Fe-species deposited inside silica pores by the two-solvents 2S technique with pentane and calcined (700 °C, air) were transformed into bundles of attached Fe-oxide nanoparticles (NP) formed by hundreds of NP grown in adjacent mesopores. The formation of similar bundles of attached nanoparticles has been studied for Pt0-replication inside SBA-15 silica [13], for Fe-oxides [12] and also for Co oxides [14,15]. Basic characterizations performed by UV–Visible spectroscopy, SEM, TEM and XRD indicate the presence of another kind of crystalline Fe-oxide and also of dispersed species. With the used silica, small magnetite and main external hematite NP were observed. The hematite NP was formed by a diffusion through silica walls that occurs upon calcination when FeCl3·9H2O was used as an Fe precursor. These catalysts were active for photocatalytic tests performed with H2O2 on a dye containing aqueous solutions. The present work contains complementary data about 4 Fe/SBA-15 catalysts prepared with a less condensed SBA-15 obtained with a single SBA-15 silica obtained with a more diluted initial HCl solution (0.3 mol·L−1). The 4 Fe/SBA-15 catalysts are characterized by TEM, SEM/EDS, XRD, Ar sorption and UV–Visible NIR spectroscopy. Their photocatalytic activity is then tested for methanol oxidation by quantification of formaldehyde as a function of reaction time at 18 °C and with added H2O2. We have selected this reaction to differentiate between a true oxidation reaction and a simple absorption.
Three practical questions are considered. The precipitation of silica grains at pH 0.5 rather than 0.0 is partially eliminating connections between the external surface and the mesopores as well as between adjacent mesopores. Less external hematite NP and bundles of attached NP are then formed by the replication technique that we use (2S). We will see also that NIR and UV–Visible spectra collected on a laboratory equipment can give significantly original information (about O-vacancies in NP in particular). Selected images collected on one sample after catalytic tests are finally introduced.
2 Materials and methods
2.1 Preparation of the catalysts
2.1.1 Reagents and references
All reagents have been obtained from Aldrich with warranted ACS Purity and have been used without any pre-treatment. H2O2 is an aqueous solution at 35 (in weight, wt) %. Commercial methanol has a density of 0.792. Two crystalline solids have been used as references to analyze the data:
2.1.2 SBA-15 silica support
An ordered porous silica SBA-15 has been prepared in acidic HCl 0.3 mol·L−1 with P123 copolymer triblock (molecular weight 5800 g·mol−1, Sigma–Aldrich) as structuring agent and TEOS (Sigma–Aldrich) as silica source. Relative proportions of reagents have been reported by Choi et al. [16]. TEOS has been added drop-by-drop and stirring has been stopped just after TEOS addition, as recommended to favor the formation of isolated silica grains [17]. After 24 h at 35 °C, solid and synthesis liquor were introduced inside a stainless steel autoclave with an internal cover of Teflon. The solid fraction, isolated by filtration on paper, was calcined at 500 °C in air with a rate of 2 °C by min (in thin bed). Calcination was performed with a muffle oven equipped with a catalytic tower and air extraction at a flux of 5.7 m3/h, up to 500 °C (rate of 2 °C·min−1 for 6 h). Cooling down was programmed at 2 °C·min−1 until 200 °C. Only freshly calcined silica was further used.
2.1.3 Iron loading
A technique of nanoreplication, the two-solvent method (2S) [12,18], has been used and applied with cyclohexane CYC or HEX solvents. Aqueous solutions 2 mol·L−1 of the two precursor salts, Fe (NO3)3·6H2O and FeCl3·9H2O, were used to prepare catalysts with 11 wt% of iron. In summary, 1 g of freshly calcined SBA-15 silica was suspended inside 75 mL of solvent in a mortar, 1.1 mL of the aqueous solution of the salt was then added drop-by-drop. After less than 10 min of contact, solid and solution fractions were separated by decantation and the solid was left to dry in ambient conditions for at least 12 h before calcination.
Calcination has been systematically performed in air up to 700 °C with a muffle oven and using a rate of 2 °C by min in air to convert the deposited salts into oxides. The final 700 °C temperature was determined with an accuracy of ± 5 °C by a secondary thermocouple and the solids were directly quenched to room temperature.
2.1.4 Physicochemical techniques of characterization
Silica composition was obtained by the CNRS center of analysis of Solaize. Fe/Si ratios have determined with a XEPOS spectrometer (Spectro Ametek). Samples were analyzed in their powder form. Quantitative data were determined using the MicroPowder method. The main textural features of silica and Fe/SBA-15 samples, such as their specific surface areas, pore volumes, and diameters were evaluated on an ASAP 2020 by Ar sorption. The powders were out-gassed at 250 °C for more than 3 h prior to analysis (to a vacuum of 10−3 mmHg). Mesopore size distribution was calculated using the Barrett, Joyner and Halenda formalism (BJH) applied to the desorption branch of the isotherm. Specific surface areas were obtained from the relative pressure range 0.05–0.25 using the Brunauer, Emmett and Teller (BET) method. The overall porous volume was measured from a single point at a relative pressure P/P0 = 0.98. Approximated microporous volumes were evaluated using the t-plot technique. Wide-Angle X-ray Scattering has been measured within the range 5–90° with a D8 Advanced diffractometer using a Bragg–Brentano geometry and equipped with a copper anode Cu Kα (λ = 0.15418 nm). A rate of 2 °C/min and a distance between points of 0.02° were used. UV–Visible NIR spectra have been systematically collected in reflectance (R %) and on powders with a Varian Cary 5000 spectrometer equipped with a Diffuse Reflectance cell covered of polytetrafluoroethylene (PTFE, Teflon, internal cell, 7 cm of diameter). Teflon powder (ALDRICH, Teflon®, 100 μm) has also been used as a white reference. Spectra have been collected in the wavelength range 200 to 2500 nm and with a rate of 600 nm·min−1 for rapid scans and less rapidly (200 or 100 nm·min−1) when necessary to observe details. Scanning electron micrographs were collected with a special SEM-FEG apparatus, scanning electron microscope equipped with a Field Emission Gun, HITACHI SU-70 working with an acceleration voltage of 1 kV and at a working distance of 1.4 mm of the powdered sample (no necessary metallization). Chemical analysis by energy dispersive spectroscopy (EDS) has also been measured with this apparatus with a spot of several hundred nm diameter. Complementary information about the mostly present internal iron oxide particles have been obtained by the transmission electron images obtained at 100 kV on a microscope JEOL100CX (100 kV) with micrographs collected in transmission. The powders were studied in their bulk form (no added solvent) and deposited on specific grids (400 mesh copper grid covered with an ultrathin carbon membrane). The analyzed spots in that case are not larger than 20 nm.
Hematite crystals diluted in several inorganic matrices (silica, calcium carbonate, illite) and quantifications based on XRD data coupled with visible diffuse reflectance spectra have been recently reported by a research group specialized in geochemistry [19]. The limits that have to be introduced before using the conclusions of this previous work are discussed and extrapolated to obtain a first quantification of hematite in our samples.
2.1.5 Photocatalytic evaluation
A glass reactor surrounded by water with a constant temperature maintained at 18 °C was used. Methanol initial concentration was fixed by adding 0.512 g methanol to 91.5 g of distilled water. The pH was adjusted at 2.6 by H2SO4 (1 M) addition. After 30 min of equilibration in the dark, 8.5 mL (35%) of H2O2 is added and light is opened. Formaldehyde, as a methanol oxidation main product, has been followed in first analysis. Colorimetric tests (Nash, 1953 [19]) can be used since formaldehyde reacts with ammonium acetate and pentane-2,4-dione to give a yellow compound absorbing at 412 nm. Aliquots of the reaction liquid have been collected as a function of time. Aliquots of less than 0.25 mL each time (from a total volume of 100 ml) have been selected to avoid perturbation of the reacting solution. After dilution by a factor 20 in volume in a B solution obtained by mixing 0.3 g of acetic acid, 0.2 g of acetyl acetone and 15 g of ammonium acetate (in 100 mL of water), a yellow colour is slowly developing. The reaction takes one hour. By the reaction proposed by Nash [20], 3,5-diacetyl-1,4-dihydrolutidine, DDL, Fluoral P®, is formed with a yellow absorption at 412 nm. To remove suspended oxide particles, we have used filtration by 0.2 μm nylon filters. We have independently tested that the amount of formaldehyde trapped inside the used filtration device can be neglected. Concentration has been followed by measuring the absorbance at 412 nm and applying Beer–Lambert law. Independent calibration curves have been obtained independently using 10 calibration points.
To quantify the amount of Fe (III) due to the catalyst leaching, quantifications have been performed on the solutions extracted after 1 h 30 of test with potassium thiocyanate. Dissolved Fe (H2O)63+ ions react with thiocyanate anions to give a red Fe (SCN)2+ complex with an absorption maximum at 475 nm. The measured absorption is directly proportional to the iron complex concentration (followed by Beer–Lambert law, calibration curves established with 10 solutions). Lixiviation measurements have been performed between 1 day and several months after catalytic tests (as clarified in Table 3).
Summary of Ar sorption results.
| Sample | Specific surface area (m2·g−1)* | Vp (cm3·g−1)** | D (BJH desorption) (Å)*** | C | Vμp t-plot (cm3·g−1)* | Vμp/Vp (%) |
| SBA-CC | 539 | 0.877 | 98 | 42.53 | 0.012 | 1 |
| Fe (11)_CYC_Cl_700 | 444 | 0.826 | 96 | 40.78 | 0.044 | 5 |
| Fe (11)_HEX_NO3_700 | 325 | 0.641 | 90 | 39.37 | 0.054 | 8 |
3 Results and discussion
Sample names and fabrication conditions are summarized in Table 1. The samples are labeled Fe (n)_Solv_Salt_700. The n values correspond to the targeted iron wt%. Wt% in Si, Fe and Cl elements were determined with X-ray fluorescence XEPOS spectrophotometer (SPECTRO AMETEK). Samples were analyzed in their powder form and quantitative data were determined using the MICROPOWDER Method. Values are expressed in wt% and summarized in Table 2. Solvent can be either cyclohexane, CYC or hexane, HEX. Labels NO3 and Cl are used to distinguish Fe (NO3)2·6H2O or FeCl3·6H2O. Otherwise strictly identical experimental conditions [calcination, solvent volume to solid weight ratio and recovery of the powders (solvent being mainly eliminated by decantation)] have been applied. A contamination of 0.04 wt% of iron is systematically detected and due to a contamination of the PROLENE® film. Some Cl wt% is not fully eliminated in the calcined SBA-CC (HCl 0.3 mol·L−1). The detected Cl wt% is half the one measured with a previous calcined SBA–CC (HCl 2.0 mol·L−1). Result obtained with the same silica in its uncalcined form SBA-CU (HCl 2 mol·L-1) is included also in Table 2. Upon calcination, more than 75% of the Cl-contamination present in an uncalcined SBA-15 is eliminated.
Samples labels and preparation conditions.
| Label | Preparation conditions | Hydrothermal treatment | Calcination |
| SBA-CC | HCl 0·3 mol·L−1 | 130 °C, 24 h | 500 °C 2 °C/min 6 h |
| Fe (11)_HEX_NO3_700 | HEXANE Iron nitrate Fe(NO3)3·9H2O | Yes | 700 °C 2 °C/min then quenching to room temperature |
| Fe (11)_CYC_NO3_700 | CYCLOHEXANE Iron nitrate Fe(NO3)3·9H2O | – | – |
| Fe (11)_HEX_Cl_700 | HEXANE Iron chloride FeCl3·6H2O | – | – |
| Fe (11)_CYC_Cl_700 | CYCLOHEXANE Iron chloride FeCl3·6H2O | – | – |
Chemical analysis made with an X-ray fluorescence apparatus [XEPOS spectrometer (Spectro Ametek)]. The samples were analyzed in the form of powder. Quantitative data were determined using the MicroPowder method.
| Sample | Si (wt%) | Cl (wt%) | Fe (wt%) |
| SBA-CC (HCl 0.3 mol·L−1) | 46.00 | 0.05 | 0.03 |
| SBA-CU (HCl 2 mol·L−1) | 45.00 | 0.40 | 0.07 |
| SBA-CC (HCl 2 mol·L−1) | 46.00 | 0.10 | 0.06 |
| Fe (11)_HEX_NO3_700 | 39.45 | 0.03 | 10.50 |
| Fe (11)_HEX_Cl_700 | 38.18 | 0.19 | 12.00 |
| Fe (11)_CYC_NO3_700 | 37.18 | 0.04 | 13.00 |
| Fe (11)_CYC_Cl_700 | 38.00 | 0.03 | 12.00 |
Sorption results are summarized in Table 3 1. Only a small decrease in porous volume is observed between the Fe (11)_CYC_Cl_700 and blank silica (0.826 cm3.g−1 compared to 0.870 cm3.g−1) The microporous volume, which is altered in uncalcined samples, is re-opened in calcined ones. A larger difference is observed between blank silica and Fe (11)_HEX_NO3_700 that keeps only an accessible porous volume of 0.640 cm3. Since TEM measurements have shown that the initial aqueous solutions were mainly occluded inside silica pores in 2S conditions, these observations are consistent with a thermally induced diffusion of Fe-species that give mostly NP located outside the silica grains for the first sample (CYC, Cl) whereas more Fe-species remain inside the silica pores in the second one (HEX, NO3).
3.1 MEB and TEM study of a selected sample
The orientation of silica grains after their deposition on a MEB and/or TEM sample older is random as illustrated with the MEB image shown in Fig. 1a. Elongated and/or short grains are observed and smaller disordered silica fragments are also present.
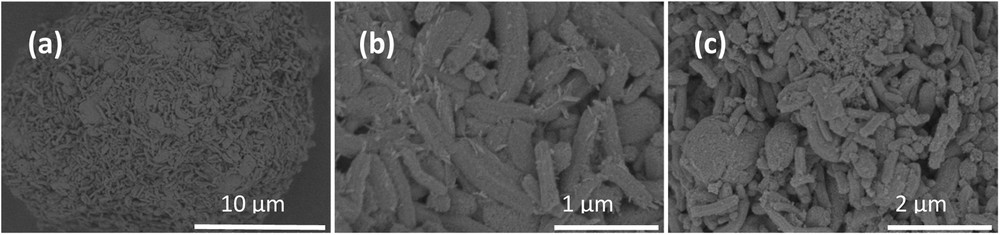
SEM micrograph collected on selected samples: (a) blank silica; (b) Fe (11)_HEX_Cl_700; (c) Fe (11)_CYC_Cl_700.
A detailed TEM study has been made with the uncalcined Fe (11)_HEX_Cl_U sample (Fig. 2). On the selected image, two main grains are observed:
- • one vertical with the main elongation of mesopores perpendicular to the electron beam;
- • a second grain with the main axis of its mesopores parallel to the electron beam.
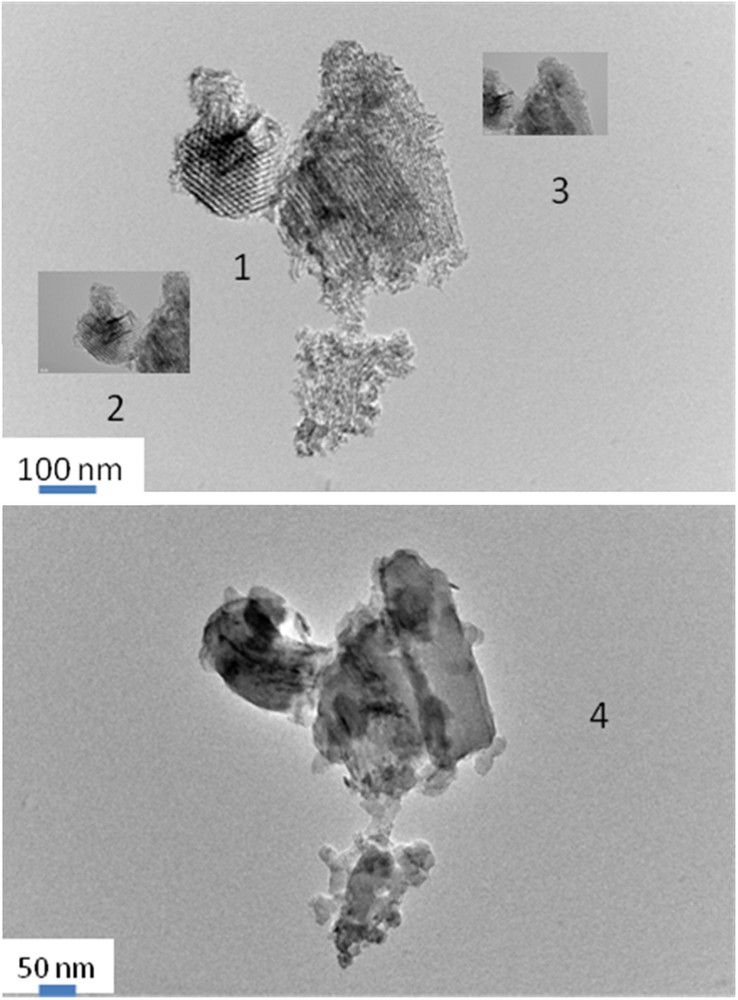
Evolution of silica grains under the electron beam of a 100-kV microscope. 1: (micrograph collected immediately for sample under the electron beam); 2, 3: micrographs collected as a function of time (1 and 2 min); 4: micrograph after a long time of exposure to the electron beam, silica grains having a melted aspect.
The second grain, on the left of the micrograph is important because dark spots due to Fe-rich species are clearly present inside the silica pores seen in section. The two grains evolve rapidly upon exposure to the electron beam (comparison (1), (2), (3)) and on the last recorded micrographs (4), the silica grains have a melted aspect. Starting from isolated or molecular Fe-species, which sizes are below the detection limit of TEM (typically < 2 nm), some mobile Fe-containing NP are formed under the reducing and heating conditions in situ under the electron beam of the TEM microscope. With the presented micrographs, attributions, based on a limited number of reticular distances, could be ambiguous and are therefore not detailed. Nevertheless, this TEM study was important to show that Fe/SBA-15 samples can contain Fe-species (isolated ions or too small NP, typical sizes lower than 2 nm) that are too small to be detected by XRD.
3.2 Physicochemical characterization of calcined silica and Fe/SBA-15 catalysts
In WAXS measurements (Fig. 3), blank SBA-15 gives a broad diffraction circa 22° and smaller peaks at larger angles that correspond to several angles and inter-atomic distances inside the amorphous silica walls. Two small diffractions are observed circa 35 and 62° with the four studied samples. Indexations (311) and (440) can be proposed for a spinel phase with a cubic unit cell. Diffractions expected for magnetite Fe3O4 (ICDD card 19-0629) and maghemite (ICDD card 02-1035) are very close but the intensity of the (111) diffraction expected circa 21°, not observed with Fe (11)_CYC_NO3_700 and Fe (11)_HEX_NO3_700 is a strong argument in favor of maghemite. Similar positions of diffraction peaks can be observed on the diffractograms that have been reported for ferrofluids [5]. It is not the case for the diffractogram of Fe (11)_CYC_Cl_700, which also contains traces of magnetite. The diffraction peaks of the two kinds of replicated spinel NP are very broad and coherent domain sizes estimated by Scherrer equation are 55–65 Å. On the X-ray diffractogram of the Fe (11)_CYC_Cl_700 sample, additional narrow peaks are observed, in particular one, which is detected at 33°, and there is also an increased intensity of the diffraction peak located at 35°. We associate these two observations to the presence of hematite NP. From the FWHM of these peaks, coherent domain sizes of 120 Å are obtained.

(Color online.) Wide-angle X-ray diffractions of the four Fe-loaded SBA samples calcined at 700 °C (a) Fe (11)_HEX_NO3_700; (b) Fe (11)_CYC_NO3_700; (c) Fe (11)_HEX_Cl_700; (d) Fe (11)_CYC_Cl_700 and reference diffractograms collected on (e) blank silica, (f) maghemite.
To obtain information about the shape of Fe-NP and locate them, we have used TEM and FEG–SEM micrographs. Selected TEM images of the four Fe/SBA-15 samples are compared on Fig. 4. Fig. 4a displays two grains of Fe (11)_CYC_NO3_700 sample, one grain containing a lot of Fe-species and one quasi-empty. On Fig. 4b, one elongated grain of Fe (11)_HEX_Cl_700 with its main elongation axis perpendicular to the electron beam is presented. Two very crystalline particles can be detected on the outlet of the main mesopores. Fig. 4(c (1) and c (2)) are relative to selected grains of Fe (11)_CYC_Cl_700. The first image contains a non-ambiguous external Fe-NP (EXT). Internal and external NP can be present. The length of the NP following mesopores can be either long or very short in a given synthesis. A heterogeneous size distribution and Fe-NP inside and/or outside silica grains are then observed. It is exceptional to attribute a NP-location on TEM images collected in transmission. To obtain clearer information about the external NP, we have used FEG–SEM. The presence of external NP (Fig. 1b with Fe (11)_HEX_Cl_700 and Fig. 1c with Fe (11)_CYC_Cl_700)2. Only the first sample contains very thin external NP.
Fig. 5 displays the NIR spectral range (2500 to 780 nm). In that range, three main composite bands are detected circa 1400, 2000 and 2200 nm. These bands can be attributed to overtones (i.e. harmonics) and combinations modes of fundamental vibrations and deformations detected in a classical IR spectrum. Attributions have been reported for other silicas (obtained by sol-gel [21] for instance) and can be summarized as follows:
- • the first group of bands circa 1400 nm is due to harmonics of the elongation of O–H bonds in silanole Si–OH groups or water that can be isolated (1367 nm), geminal (2 on the same Si atom, 1384 nm), belonging to water or water molecules in strong interactions by H-bonds with superficial silanole groups (1404 nm) and to water molecules in interactions with other water molecules (1457 nm);
- • the second group of bands circa 2000 nm is a combination of elongation and deformation modes and is mainly sensitive to water molecules. Decompositions and precise attributions of bands are still debated;
- • the last group of bands circa 2200 nm is due to combinations of elongation and deformation mode of O–H bonds in silanole groups and bending in Si–O–Si bridges. The main interest of this last component is its ability to discriminate ordered mesoporous silica from amorphous silica. There is indeed a clear new signature circa 2331 nm, which corresponds to amorphous silica when SBA-15 is mixed with a less porous amorphous silica component (not shown).

(Color online.) Diffused reflectance spectra from 1000 to 2500 nm, including NIR spectral range: (a) Fe (11)_HEX_NO3_700; (b) Fe (11)_CYC_NO3_700; (c) Fe (11)_HEX_Cl_700; (d) Fe (11)_CYC_Cl_700; (e) blank silica.
On the NIR spectra of the Fe/SBA-15 samples compared to the blank silica reference, there is a general decrease of the intensities of the three spectral components after Fe-loading and calcination at 700 °C. This observation indicates that the hydrophilic character of silica is strongly modified and its hydrophilic character is decreased.
Fig. 6 displays the spectra collected with the same samples in the UV–Visible spectral range (780 to 200 nm) as a function of the wavelength (nm). With the used equipment, last values above 205 nm can be safely considered. The presented spectra have been corrected from the source (350 nm) and the detector (800 nm) changes over. Four overlapping broad peaks with maxima circa 250, 339, 388 and 487 nm are detected. We have checked (not shown) that in that range the contribution of silica was very small and can be neglected. The first peak is common to several Fe-containing zeolites were Fe-species are introduced in substitution sites [22–24]. For instance, in a Fe-MCM-41 obtained by a hydrothermal treatment and with 0.9, 1.1 and 1.8 wt% of Fe as well as for a ferrisilicate [24], a band circa 265 nm has been attributed to isolated distorted Fe-ions attached by Si–O–Fe bonds (i.e. grafted) to silica, tetrahedral (in dehydrated samples) or distorted by water coordination. The two bands at 339 and 388 nm are attributed to other Fe-species, isolated octahedral and becoming more and more condensed (pairs, then polynuclear clusters). However, 339 nm is a little too high in energy for an attribution to isolated octahedral (FeO6)9− species. This band position rather corresponds to Fe (III)-ions in pairs or polynuclear (from x = 2 to n) Fe-species of small nuclearity. A deeper analysis is necessary to explain the last band at 487 nm. A good description of the way by which the Fe (3d) atomic orbitals are separated in energy for an octahedral coordination can be found for instance in [25]. The fundamental state associated with a (t2g)3 (eg)2 electronic configuration is 6A1g. Two distinct excited states 4T1u (4G) and 4T2u (4G) are possible and therefore, two bands only are expected. To explain the observed third band, a bi-electronic transition [6A1g + 6A1g] to [4T1u (4G) + 4T1u (4G)] can be introduced. An attribution of the last observed peak to such a bi-electronic transition, both symmetry and spin forbidden, is not allowed for isolated Fe (III) ions. By contrast, this transition is observed for hematite NP in which strong magnetic interactions are involved between adjacent Fe (III) ions and selection rules are modified.

(Color online.) Diffused reflectance spectra from 200 to 1500 nm, including UV spectral range (from 400 to 200 nm): (a) Fe (11) _HEX_NO3_700; (b) Fe (11)_CYC_NO3_700; (c) Fe (11)_HEX_Cl_700; (d) Fe (11)_CYC_Cl_700; (e) blank silica.
The contribution of oxide NP due to delocalized electronic levels is expected on the right side of the last peak at 487 nm. Among bulk iron oxides, only hematite is a semi-conductor. For NP, the situation is different and semi-conducting properties have been reported by physicists for both hematite and maghemite NP [26]. With NP of both hematite and maghemite submitted to an excitation light, an electron excitation can occur and gives loosely bounded pairs of electrons and holes. The generated electrons are delocalized on a length that is much larger than the oxide lattice constants and define the excited electron Bohr diameter. As the dimensions of iron oxide particles decreases and approaches this Bohr diameter, electronic properties start to change. This quantum-size effect explains why the band gap observed with NP of different sizes and shapes can be significantly different and differ from the one of bulk oxides.
To study this effect and obtain an estimation of electronic transitions values, we have used a plot of (F(R)·E)2 versus E. E, which is the excitation photon energy, is calculated from the relation 1238/ν, where ν is the wavelength in Fig. 7 expressed in nm. F(R) is the Kubelka–Munk transformation of the reflectance signal, R, and is calculated as (1 – R)2/2R of the reflectance signal measured by the diffuse reflectance accessory. This plot is equivalent to more frequently reported (α·E)n plots as a function of E, in which α is the absorption coefficient, which are called Tauc plots [27]. In first approximation, we have preferred to use an expression based on F(R) rather on α because this expression does not require an estimation of the optical penetration depth. A value of δp = 118 nm at λ = 550 nm has been reported for hematite [4], but in our samples that contain several NP sizes and several oxides, this value is difficult to estimate. In first approximation, (F(R)·E)2 curves as a function of E have been used and are presented in Fig. 8. An electronic transition circa 2.2 eV is measured with all the samples and also with the reference ferrofluid sample. This electronic transition can then be associated mainly with the replicated spinel particles. There is an additional electronic transition visible with Fe (11)_CYC_Cl_700 and Fe (11)_HEX_Cl_700 samples. The measured values (circa 2.1 eV, obtained by linear regression for R2 values greater than 0.99). This second contribution is attributed to hematite NP. Its position is higher than the experimental value of 2.0 eV that we have measured on our reference hematite sample (which was containing much bigger hematite NP, circa 100 nm in size compared to 12 nm here). These evaluations are correct since size and band gap are expected to be inversely related with semi-conducting oxides NP [4].

(Color online.) A. (F(R)·E)2 as a function of E (eV) curves for: (a) Fe (11)_HEX_NO3_700; (b) Fe (11)_CYC_NO3_700; (c) Fe (11)_HEX_Cl_700; (d) Fe (11)_CYC_Cl_700; (e) blank silica; (f) ferrofluid reference. B. Lower energy side of part (A), enlargement × 15.

(Color online.) (F(R)·E)2 curves as a function of E (eV): signals due to silanoles and O-vacancies on spinel oxide NP. Y scale, × 2000 compared to Fig. 7B.
On (F(R)·E)2 versus E plots obtained with at a much larger vertical scale (Fig. 8), small events corresponding to localized electronic transitions are detected between 0.50–0.65 and 0.90–1.00 eV. Signals attributed to surface silanoles of silica are mainly detected with reference silica in that spectral range. O-vacancies of iron oxide NP that can be isolated at low energy and ordered at a larger energy are also expected by comparison with results published about perovskites NP [28]. With perovskites of formulation SrxTiO3(1−d), structural techniques were used to establish the formation of isolated O-vacancies and pairs/clusters of vacancies (relative energies of 0.65 and 0.95 eV). These signals are not observed with the reference hematite used here whereas O-vacancies are clearly observed with the ferrofluid (maghemite) reference. With this reference, the two signals are located circa 0.64 and 0.84 eV. With the used resolution, similar positions can be proposed with our four Fe/SBA-15 samples. The presence of O-vacancies containing spinel oxide is consistent with XRD results (large observed FWHM).
We have also tried to quantify the hematite proportion in wt% in our samples by coupling information obtained in XRD and in DR spectroscopy. DR spectroscopy is expected to be 100 times more sensitive than XRD but care should be taken before to use spectroscopic results for a direct quantification of hematite. Indeed, geochemists have studied in details hematite spectra in several matrices (quartz, illite and calcium carbonate for instance) [19]. DR spectroscopy is, as expected, more sensitive than XRD. However, at low concentration, typically for less than 1% of hematite in weight, the matrix influences significantly the detected spectral features. It is then necessary to eliminate carbonates (possible with a special cell and a vacuum/N2 purge, the necessary equipment is available in the LRS). Since our samples are polluted by both carbonates and chlorine impurities, we have not tried to use a more precise quantification by DR spectra. The detection of hematite by XRD rather indicates a wt% that is larger than 4 wt%. However, this value has been obtained with bulk hematite and is possibly under-estimated with NP.
3.3 Photocatalytic reactivity
We have worked on methanol aqueous solutions prepared by mixing 90.85 mL of distilled water, 8.5 mL of H2O2 and 0.65 mL of methanol. We have used an acidic initial pH (2.8) adjusted by adding drops of an aqueous H2SO4 (1 M) solution and a fixed temperature of 18 °C. After equilibration 30 min in the dark, light is opened and aliquots of 0.5 mL are taken as a function of time, with a syringe equipped with a filter and analyzed by the colorimetric technique proposed by Nash to quantify formaldehyde [20].
Catalytic results are summarized in Fig. 9. Formaldehyde amount significantly increases when light in open and its variations as a function of time are different with the four studied catalysts Fe (11)_CYC_Cl_700, Fe (11)_CYC_NO3_700, Fe (11)_HEX_Cl_700 and Fe (11)_HEX_NO3_700. This confirms that, for a given silica, both the solvent and the salt used as precursor influence the nature and relative % of the Fe-species in Fe/SBA-15 catalysts prepared in otherwise identical experimental conditions. Formaldehyde concentrations measured after 1260 min of test are summarized in Table 4. Small values are obtained with the samples containing a small hematite contribution for Fe (11)_CYC_Cl_700 and Fe (11)_HEX_NO3_700 (0.931, 0.856 and 0.929 mmol). A significantly better value is measured with Fe (11)_CYC_NO3_700 that contains mainly internal replicated NP (1.666 mmol). As indicated in our previous work, the internal replicated particles are accessible to visible light and more reacting than external hematite NP. These values are small but are in fact comparable with values reported with titania-containing catalysts, whereas titania is considered as a standard in photocatalysis, and UV irradiation was required [29].
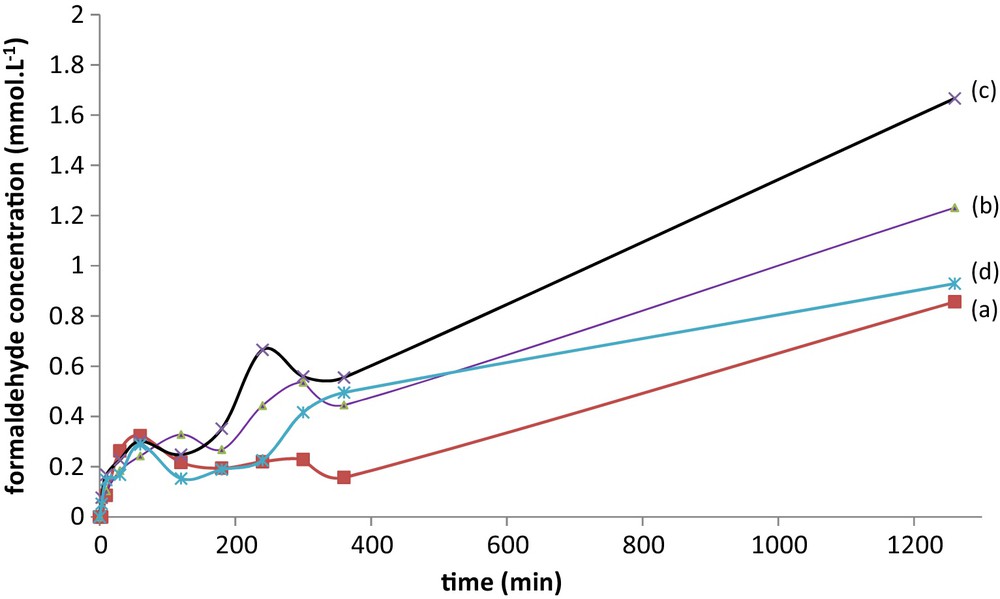
(Color online.) Catalytic tests on (a) Fe (11)_HEX_ NO3_700; (b) Fe (11)_CYC_NO3_700; (c) Fe (11)_HEX_Cl_700; (d) Fe (11) _CYC_Cl_700; experimental conditions: 18 °C, 75 mg of catalyst, 100 mL of solution prepared for 0.16 mol·L−1 methanol and H2O2 (wt 35%) 0.999 mol·L−1.
Formaldehyde concentration measured after 1260 min of catalytic test. Experimental conditions: 18 °C, 75 mg of catalyst, 100 mL of solution prepared for 0.16 mol·L−1 methanol and H2O2 (wt 35%) 0.999 mol·L−1.
| Sample | Formaldehyde concentration after 1260 min of reaction (mmol·L−1) |
| Fe (11)_HEX_NO3_700 | 0.8563 |
| Fe (11)_CYC_NO3_700 | 1.2312 |
| Fe (11)_HEX_Cl_700 | 1.6663 |
| Fe (11)_CYC_Cl_700 | 0.9289 |
Diluted Fe-species in aqueous solutions after the catalytic tests have been measured using the KSCN chemical technique. The obtained values are summarized in Table 5. The lixiviation values are comprised between 3 and 9% of the introduced Fe-species. A particularly low value (3%) is observed with the Fe (11)_CC_Cl_700 sample, enriched in crystalline hematite NP.
Lixiviation results: amount of iron detected in aqueous solutions after catalytic tests. Experimental conditions: 18 °C, 75 mg of catalyst, 100 mL of solution prepared for 0.16 mol·L−1 methanol and H2O2 (wt 35%) 0.999 mol·L−1.
| Sample | Measured iron in the aqueous solution after the catalytic test (expressed in mg·L–1) | Percentage of iron lixiviation | Days between catalytic test and analysis |
| Fe (11)_CYC_Cl_700 | 5.2 | 5.0 | 30 |
| Fe (11)_CYC_NO3_700 | 5.8 | 6.2 | 29 |
| Fe (11)_HEX_Cl_700 | 4.9 | 5.3 | 32 |
| Fe (11)_HEX_NO3_700 | 2.5 | 2.7 | 31 |
4 Conclusions
The SBA-15 silica used here is clearly less connected and less favorable to the formation of external hematite NP than the SBA-15 used in our previous work. Since the two silica were obtained in the same conditions, synthesis at 35 °C, 24 h and then hydrothermal condensation at 130 °C, 24 h, the observed differences are rather associated with the initial pH of the synthesis (close to 0.0 with HCl 2 mol·L−1 and 0.5 with HCl 0.3 mol·L−1). Traces of Cl are difficult to eliminate and remain after calcination at 700 °C in air. The dispersion of oxide NP inside silica grains is heterogeneous but no large bundles of attached iron oxide NP grown in adjacent mesopores are observed. A complete analysis of UV–Visible spectra is interesting since:
- • the UV-signatures of O-vacancies can be recognized in replicated particles;
- • a conventional treatment of (E·F(R))2 plots as a function of E gives preliminary results.
The band gap associated to hematite (2.1 eV) is larger than the one observed with a reference sample in which significantly larger NP of hematite were present (2.0 eV for diameters of 100–200 nm compared to 2.1 eV for 12 nm here). This evaluation in itself is validated since size and band gap are expected to be inversely related with semi-conducting oxides NP.
Fe/SBA-15 catalysts can be activated by visible light and by an addition of H2O2 for methanol oxidation. Possible ameliorations are now necessary to control the stability of these samples, affected by silica dissolution and Fe-lixiviation in water. Furthermore, only formaldehyde is quantified here and several other products of oxidation and/or dehydrogenation can be expected to be formed, as already described with titania catalysts activated by metallic Pt particles [30].
Acknowledgements
The work of Nabil Tabaja has been made possible thanks to a Franco-Libanese agreement of thesis in co-tutelle between the University Pierre and Marie Curie, Paris and the Libanese University, Beyrouth and has been financed by the Group of Research MAPE (Nanosized Porous Materials, Preparation, Advanced Characterization and Environmental Applications, Beyrouth, Libanese University). S. Abramson PHENIX, Laboratoire de physico-chimie des électrolytes, UMR 8234, Université Pierre-et-Marie-Curie, Paris, France, is acknowledged for his advices about ferrofluid-containing materials.
1 The methods used to calculate specific surface areas, porous volumes, and main mesopore dimensions, as measured on the desorption branch of sorption isotherms, are indicated in the footnotes of Table 3. Ar has been used rather than N2 because in the presence of the Fe-species and after calcination, the isotherms have an ink-in-the-bottle shape due to partially plugged mesopores. Capillary evaporations of the two gases at 77 K are different and smaller pores sizes can be obtained using Ar (3.6 nm) rather than N2 (4.7 nm).
2 The sizes and shapes of silica grains are heterogeneous but no more than in already reported data.