

1 Introduction
There are numerous techniques known for the synthesis of carbon nanotubes (CNTs) [1,2]. Aerosol-assisted vapor phase deposition methods are considered to be among the most economically feasible techniques for the large-scale synthesis of CNTs [3–13]. This is due to a relative simplicity of the equipment and to the fact that the carbon precursors, mainly liquid hydrocarbons, usually used in the system with various metal catalysts are inexpensive. One of the investigated precursors has been toluene, an available liquid hydrocarbon. Pinault et al. [14], using either an aerosol generator or an injection system, synthesized aligned multiwalled CNTs (MWCNTs) at 800 or 850 °C from solutions of ferrocene Fe(C5H5)2 dissolved in toluene or cyclohexane; for an efficient catalyst residue removal, the annealing treatment of raw carbon nanotubes under flowing argon in the temperature range from 1700 to 2000 °C was applied. Similarly, Meysami et al. [3,15] used an aerosol-assisted chemical vapor deposition technique for investigating the synthesis of CNTs from several liquid hydrocarbons in the system with ferrocene at 800 °C. Singh et al. [16], based on the experimental set-up elaborated by Andrews et al. [4], used toluene solutions of ferrocene to prepare aligned MWCNTs. To this aim, a two-stage furnace was used. The first stage was preheated to 200 °C and served as a zone for vaporization of precursors that were entered by injection with a syringe pump. In the second stage of the furnace, the nanotubes were synthesized at various temperatures in the range from 550 to 900 °C. A mixture of argon and 10% hydrogen was used as a carrier gas. The addition of hydrogen to a carrier gas, first, reduces the decomposition temperature of ferrocene and, second, reduces an average molar weight of the gas [17]. The latter factor has a direct influence on collisional phenomena by controlling the size of the catalytic particles and increasing their number density. A modified method of Singh et al. was proposed for the growth of aligned arrays of CNTs from the toluene/ferrocene precursor system [18]. Namely, the activity and lifetime of the catalyst was studied by switching from the precursors solution to a pure toluene feedstock during the growth of nanotubes. Das et al. described the synthesis of MWCNTs by pyrolysis of solutions of ferrocene in benzene, toluene, xylene, and trimethylbenzene [19]. Temperatures in the range 600–800 °C and argon mixed with 10% hydrogen as a carrier gas were used. The solutions were introduced to the preheater by a syringe pump. By using substituted ferrocenes in toluene solution and the same injection method, Mohlala et al. synthesized MWCNTs and carbon fibers at 800–1000 °C and 5% hydrogen in argon [20]. Ma et al. reported the preparation of small carbon “trees” in a quartz tube reactor from the toluene/ferrocene precursor system [21]. Ferrocene was introduced into the reactor through its sublimation at 150 °C in the entrance section of the reactor otherwise preheated in the hottest zone to 1150 °C, whereas toluene was transported to the reactor as vapors by argon bubbling. Fedorovskaya et al. synthesized arrays of vertically aligned CNTs grown on n-doped silicon substrates by means of an aerosol-assisted catalytic chemical vapor deposition technique in flowing argon from ferrocene solutions in toluene that were injected into the reactor preheated to 800 °C [22].
It is apparent from this brief review that the toluene/ferrocene system was frequently utilized in various chemical vapor deposition methods aimed at CNTs synthesis. In our approach, we used a simple experimental set-up equipped with an affordable ultrasound aerosol generator to investigate a possibility to synthesize carbon materials of different morphologies, and not necessarily CNTs, from the common toluene/ferrocene solution system. For this purpose, we used two reaction temperatures, i.e. 850 and 1000 °C. A pure argon gas was used for mist transportation and for the protection of carbon products against oxidation. A study of low-pressure hydrogen adsorption was conducted for the selected product.
2 Materials and methods
Toluene C6H5(CH3) (POCH Poland) and ferrocene Fe(C5H5)2 (Sigma Aldrich) were used as received. In this regard, ferrocene served primarily as a source of iron catalyst formed via thermal decomposition of this compound. Carbon nanomaterials were prepared by the aerosol-assisted synthesis method in an experimental set-up comprised of an ultrasound aerosol generator, a quartz tube reactor, ID = 20 mm, length = 840 mm, and an open-ended quartz boat support for product collection, the latter placed in the maximum temperature zone. The details of the method were published elsewhere [23]. Post-reaction gases after cooling down in a condenser were directed into the ventilating hood. The reactor was installed in an electrical tube furnace preheated to the selected temperature of 850 °C or 1000 °C. The aerosol mist generated from the toluene solution of ferrocene (4 wt%) was transported through the reactor in argon, 1 L/min. After 50 min, the aerosol-generating system was switched off and the reactor was cooled down to ambient conditions under continuing argon flow. Black-colored raw products were formed that were carefully scraped from the crucible. Based on a check-up microscopic examination, the products consisted of a major fraction with distinct morphological features and of a minor fraction consisting of amorphous carbon. Survey TGA scans in air evidenced that the optimal temperature to remove by mild oxidation the reactive amorphous carbons was 440 °C. The clean-up oxidation of each raw product placed in an alumina crucible was carried out with air at this temperature for 1 h. After oxidation, the resulting materials were refluxed with a 8 M HNO3 solution for 1 h to dissolve/remove residual iron according to a published procedure [24]; subsequently, they were rinsed with de-ionized water several times until reaching pH = 7. Finally, the filtered solid products were dried in an oven at 150 °C during 2 h.
The efficiency of iron removal via acid extraction was evaluated by combustion of the materials samples in oxygen at 900 °C and the determination of the weight of the residue, assumed to be Fe2O3 in both cases. The morphology of the samples was investigated with scanning electron microscopy (Hitachi, model S-4700). Individual nanosized carbon objects were studied by transmission electron microscopy (JEOL, model JEM 1011). For investigation of the resistance to oxidation and determination of temperature conditions for amorphous carbon removal via mild oxidation, thermogravimetric analyses in air were carried out with a heating rate of 5 °C/min. Raman measurements were conducted on a Horiba Jobin Yvon LabRAM HR micro-Raman spectrometer equipped with a CCD detector, excitation wavelength 532 nm, beam intensity 10 mW. Powder XRD measurements were done with the X’Pert Pro system, Panalytical, using the Cu Kα source. The BET surface areas of the samples were determined by low-temperature adsorption of nitrogen on Micromeritics Gemini 2380. H2 adsorption experiments were conducted at −196 °C, in the pressure range from 0 to 100 kPa, by the gravimetric method using a low-pressure Sartorius microbalance. Prior to the adsorption runs, the samples were conditioned in air at 105 °C for 2 h. The measurements started with sample outgassing at room temperature for 6 h until a static vacuum of 10−2 Pa was reached in the system. As a standard procedure, each experimental point was recorded after a 20-min equilibration time although, routinely, the condition for adsorption equilibrium was met earlier than that.
3 Results and discussion
Fig. 1 presents typical images of the raw product prepared at 850 °C. The prevailing feature is the bundles of not rigidly straight fiber-like objects with lengths of ca. 400 μm. They contain visibly rounded bulges originating from Fe particles (Fig. 1B and D). In this regard, the occasional curvature of 1D carbons (nanotubes, nanofibers, etc.) has often been linked to the use of hydrocarbons with a cyclic molecular structure (benzene, xylene, cyclohexane, fullerene, toluene, etc.) as precursors [25–28]. In the case of linear hydrocarbons, the thermal decomposition seems to proceed via monoatomic or dimeric/trimeric carbon moieties, and the resulting carbon nanotubes are straight [26].
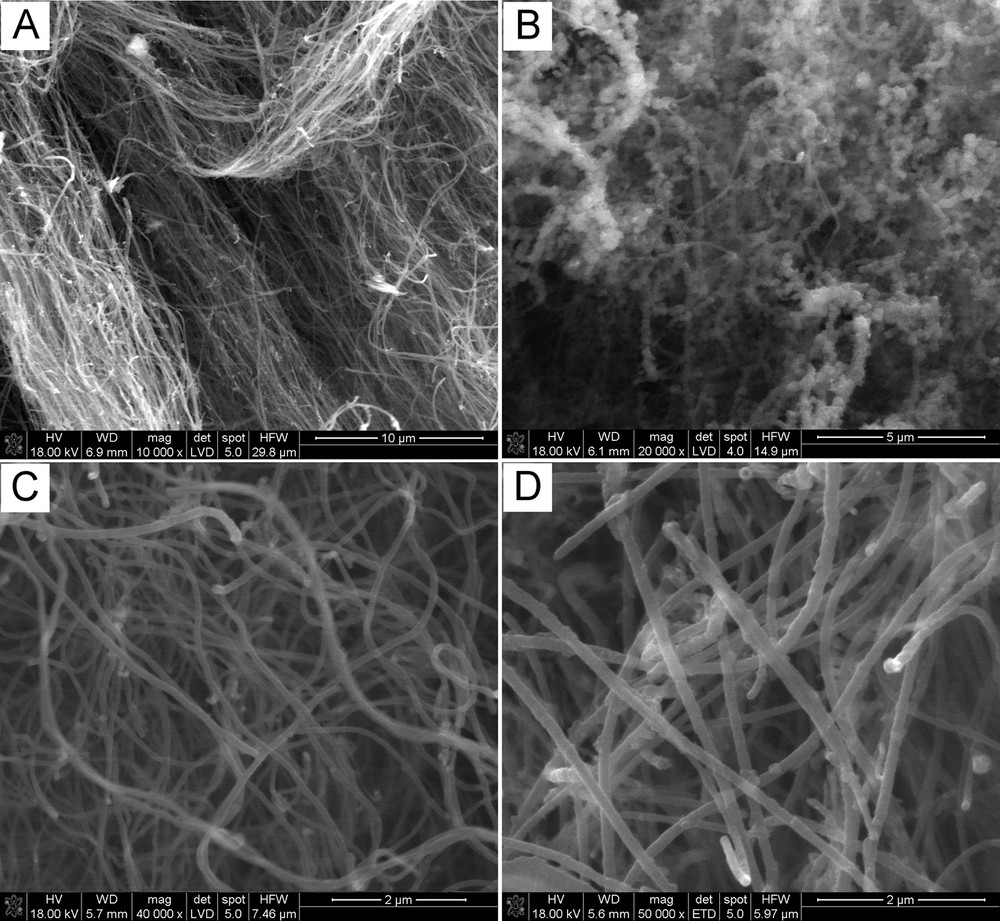
Typical SEM micrographs of the raw product prepared at 850 °C.
Fig. 2 shows the SEM images of carbons made at 1000 °C. This product has a remarkably different morphology compared with the earlier discussed material resulting from the synthesis at 850 °C. In Fig. 2A, a side view of now stacked carbon layers confirms the prevailing morphology features distinct from tubular ones. On the top of the stack, one can see moieties of spheroidal morphology, frequently fused together, supporting a notion that precursor decomposition included at some point an intermediate stage with a viscous liquid phase (Fig. 2B and C). Besides, only very few fibrous objects with diameter ca. 100 nm were identified as shown, for instance, in Fig. 2D. All this is consistent with a different mechanism of carbon species assembling at 1000 °C compared with the case of the fiber-like features prepared at 850 °C.
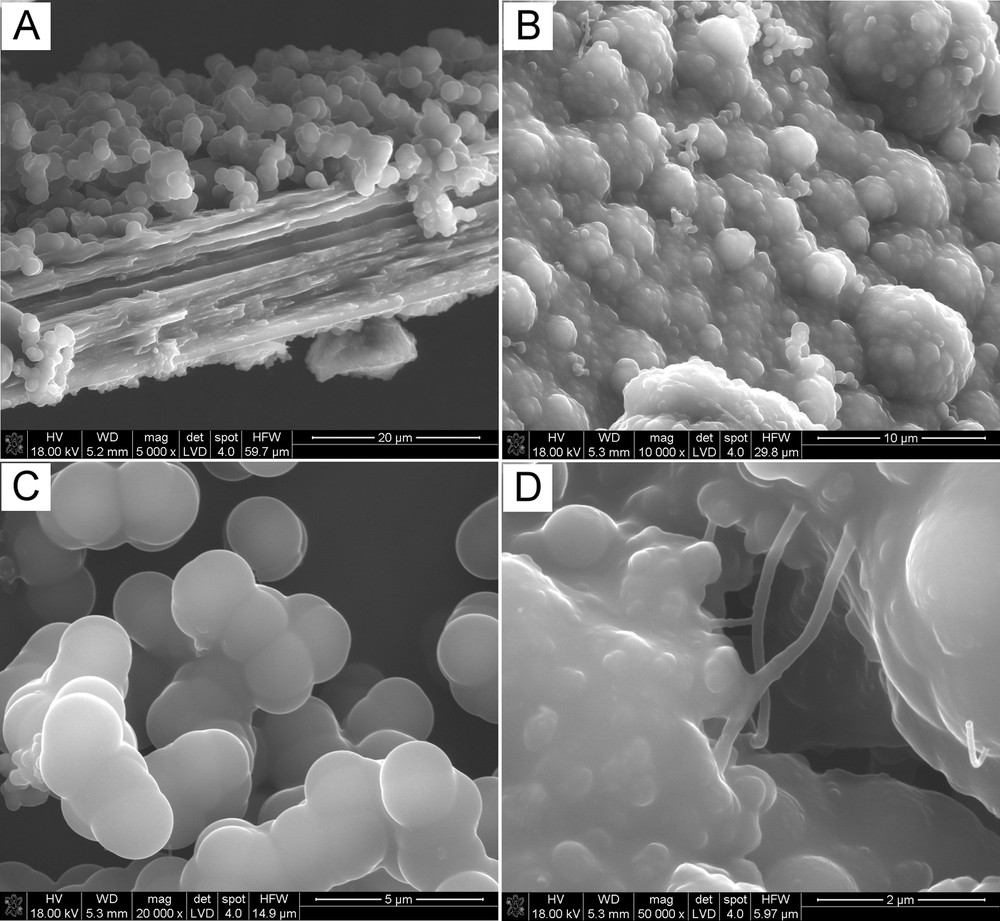
Typical SEM micrographs of the raw product prepared at 1000 °C.
Fig. 3 includes TEM micrographs of both kinds of carbons after the mild oxidation and acid purification steps. Fig. 3A–C refers to the product prepared at 850 °C, whereas Fig. 3D–F is for the product prepared at 1000 °C. Fig. 3A–C confirms the prevailing tubular morphology for this material, seen earlier by SEM as fibrous, with the nanotubes of diameters as small as 20 nm and as big as 130 nm (Fig. 3A). In addition, some of the thickest species appear to be void-free solid fibers. The dark objects seen as embedded in the body of the thick tubes and fibers are the Fe catalyst particles that were not removed by acid purification. The encasement of Fe particles in the walls of such 1D carbons seems to be a unique and attractive feature of this product. It is apparent that the product synthesized at 850 °C is made of the characteristic of 1D carbons with the prevailing nanotube morphology.
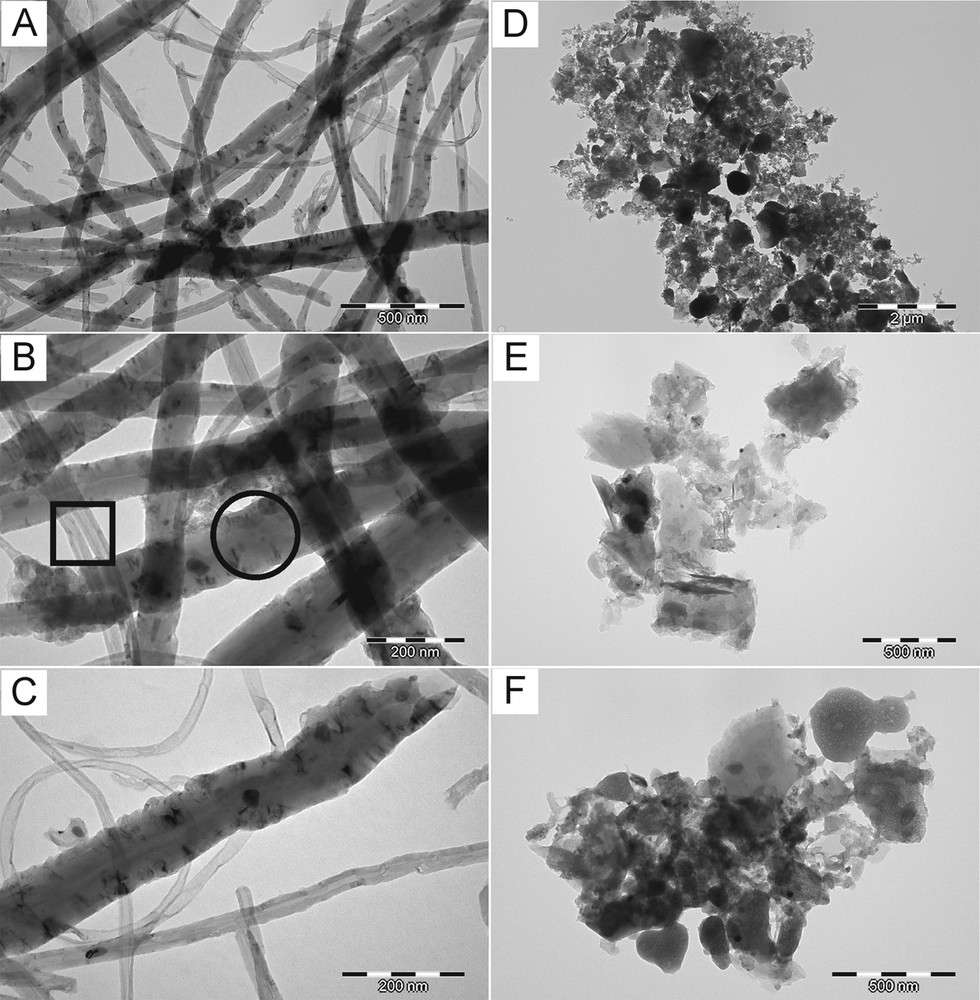
Typical TEM micrographs of final products after acid treatment: (A, B, and C) product prepared at 850 °C; (D, E, and F) product prepared at 1000 °C. In B: square–multiwalled nanotubes, circle–thick fiber.
Fig. 3D–F shows a completely different and featureless morphology for the product prepared at 1000 °C. Here, the catalyst particles much larger than those present in the 1D carbons are observed (compare with Fig. 3A–C). The presence of large particles of iron could be linked to specific properties of nanomaterials. In this regard, the melting point of metals depends on particle radius in the nanosized range. For instance, gold particles in a few nanometer size range can have a melting point lower even by a few hundred degrees than that of the bulk material, 1064 °C [29]. From the available studies on melting temperatures as a function of the diameter of the metal particles, it follows that Fe particles smaller than 10 nm have a melting point below 1000 °C, to be compared with 1536 °C for the bulk metal [30]. It appears in our study that iron originating from ferrocene efficiently forms large spheroidal particles passing through a liquid state, possibly via coalescence of smaller droplets. The formation of large droplets of catalyst can be responsible for the stacked planar morphology of carbons seen at 1000 °C, whereas the presence of numerous separate Fe nanodroplets at 850 °C is advantageous for the growth of 1D carbons, instead. In addition, the TEM evidence for encapsulation of Fe particles in the carbon matrix will, first, alter the activity of the catalyst and, second, make acid purification somewhat ineffective.
The TGA measurements in air for the raw products show definite differences in their resistance to oxidation (Fig. 4). The carbon product made at 850 °C (curve A), which is composed mainly of 1D carbons, starts to oxidize at ca. 450 °C, whereas the oxidation of the product prepared at 1000 °C (curve B) begins, approximately, one hundred degrees below, i.e. at 350 °C. This can be reasonably related to the different proportions of amorphous carbon in both materials; since the amorphous variety is more reactive and prone to oxidation, it stems that the 1000 °C-derived product contains more of it. It is worth noticing that the mild oxidation at 440 °C intended to remove highly amorphous carbons resulted for the 850 °C product in some 4 wt% loss, whereas for the 1000 °C product, it amounted to a much higher value of 14 wt%, which is consistent with the above. Also, based on the content of the residues originating from the embedded iron, read from the flat end-portion of the curves, the 1000 °C product shows approximately twice as much iron compared with the 850 °C product, i.e., 10 wt% vs 5 wt% (as Fe2O3). These TGA-derived values obtained for the raw products can be related to the residue contents upon combustion at 900 °C in oxygen of the acid-purified products (complete removal of carbon and oxidation of iron to Fe2O3). The latter values match, respectively, the former ones within the experimental error of the two methods. This implies that the amount of iron removed by the acid is very low if any, which points out to insignificant quantities of easily accessible Fe-particles in both products.
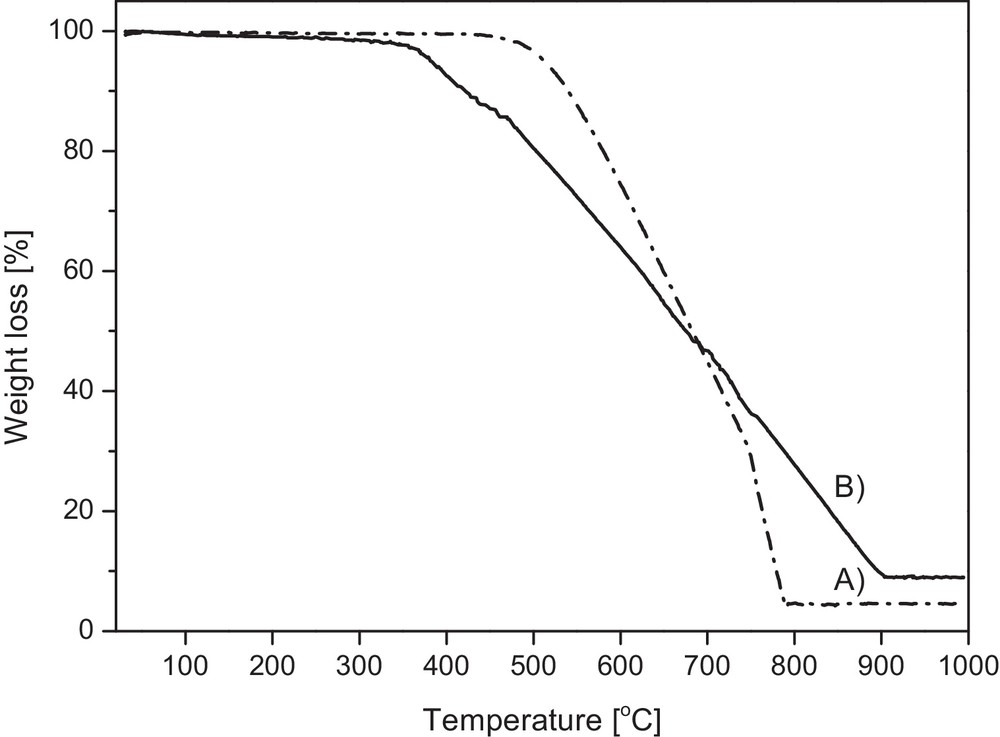
TGA profiles in air for raw carbon products: (A) product prepared at 850 °C, (B) product prepared at 1000 °C.
The acid treatment using specifically HNO3 will have, however, a definite impact by modifying the carbons surface via its partial oxidation. This could potentially have an influence upon the specific material adsorption properties. However, the adsorption of gases with spherical and/or symmetrical electron densities such as hydrogen H2 (examined in this study) or many hydrocarbons CnHm is essentially non-specific regarding surface groups.
The Raman spectra of the acid-purified carbons are shown in Fig. 5. The spectra include three major peaks at 1341, 1573, and 2681 cm−1 (850 °C product, Fig. 5A), and at 1350, 1591, and 2693 cm−1 (1000 °C product, Fig. 5B). The first peak in each series corresponds to the D band and reflects, mainly, the sp3 hybridization of the C-atoms with a contribution from the sp hybridization in disordered structures of sp2 hybridized carbon materials. The second peak is the G band and is linked to carbon atoms with the sp2 hybridization. The third peak labeled in the literature as G’ band is characteristic of all kinds of graphitic materials. An additional small-intensity peak at 2921 cm−1 (Fig. 5A) is associated with a D + G combination mode and it is disorder-related [31]. Such an assignment of the Raman peaks is consistent with the available literature data on carbon materials [31–33]. The overall appearance and intensities of the bands for the product prepared at 850 °C (Fig. 5A) are characteristic of carbon nanotubes [34,35]. In this regard, a distinguishing feature of single- and double-walled carbon nanotubes is the intensity of the G band (ca. 1580 cm−1), being several times stronger than that of the D band (ca. 1340 cm−1) and, additionally, there appears a peak in the range 100–250 cm−1 from the radial breathing mode (RBM) when all carbon atoms move in-phase in the radial direction [34]. Since the latter is absent from the Raman spectrum, one can conclude that the product is composed mainly of multiwalled nanotubes. This is supported by the relatively intense D band at 1341 cm−1. In the case of the product made at 1000 °C, the most intense peak that is related to the D band is found at 1350 cm−1, whereas the G band peak at 1591 cm−1 is weaker. This corresponds with strongly defected graphitic structures.
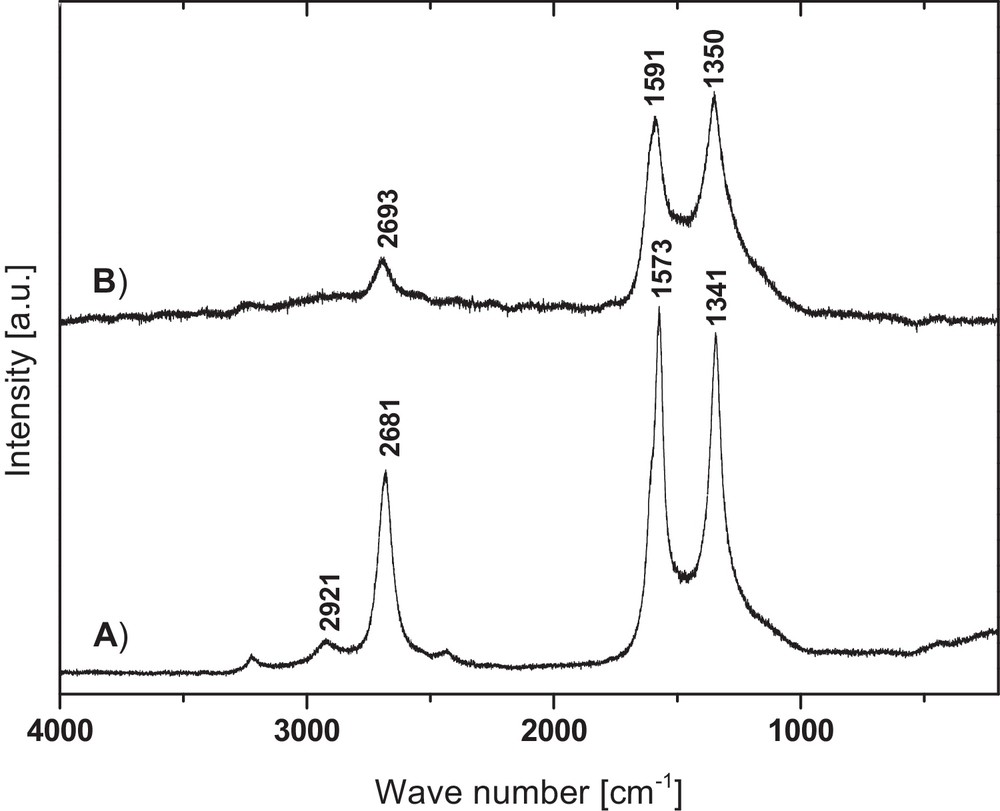
Raman spectra of carbon products: (A) product prepared at 850 °C, (B) product prepared at 1000 °C.
The XRD results support the conclusions drawn from the Raman study. Fig. 6 includes the XRD patterns obtained for both final products after acid purification. The most intense peak at ca. 26° is assigned to graphitic hexagonal (002) planes in the multiwalled carbon nanotubes (pattern A) or in the strongly defected and highly amorphous carbons (pattern B). The other small-intensity diffraction peaks at ca. 43° and 54° are assigned to the (101) and (004) graphitic planes, respectively, whereas the peak at ca. 44° is for the Fe catalyst. It is worth to note that the diffraction peak at 26° for the 850 °C product is rather narrow, which is consistent with a high structural ordering (Fig. 6A). On the other hand, the respective peak for the 1000 °C product is much broader, supporting a rather poor crystallinity in this case (Fig. 6B).
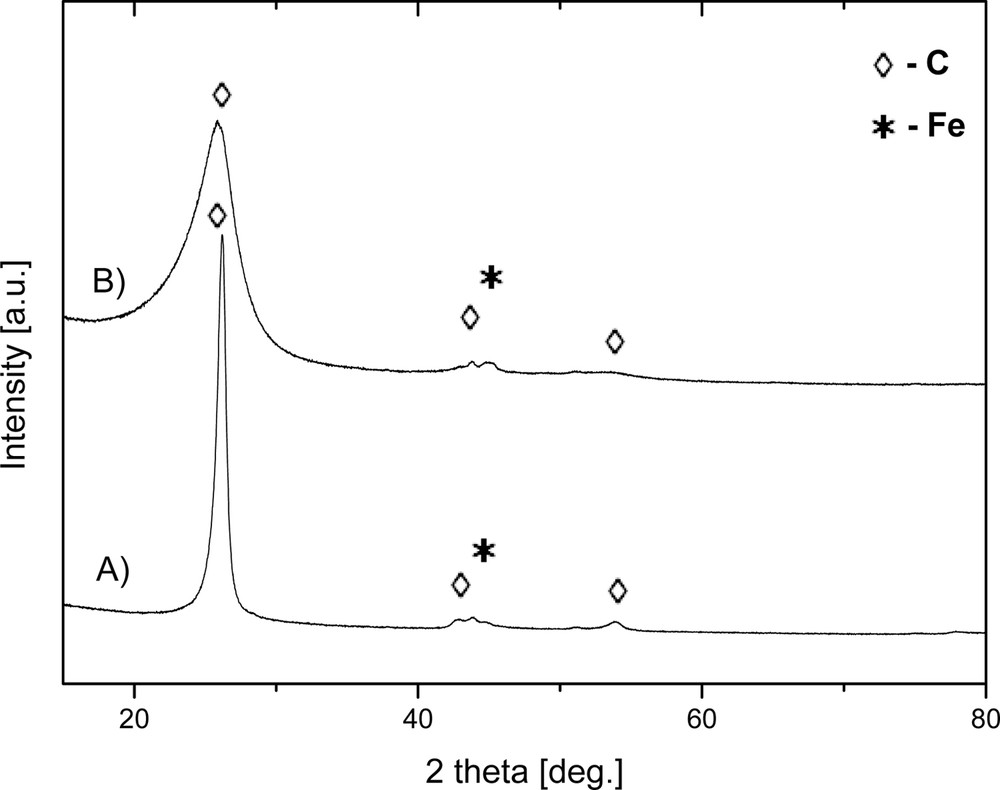
XRD patterns of carbon products: (A) product prepared at 850 °C, (B) product prepared at 1000 °C. The peaks marked by diamonds correspond to the graphite structure, the peaks marked by asterisks correspond to the Fe catalyst.
The BET specific surface areas, SBET, of the acid-purified final products were determined by the standard low-temperature adsorption of nitrogen. The SBET for the product prepared at 850 °C and composed, mainly, of carbon nanotubes reaches the value of 45 m2/g, whereas for the product made at 1000 °C with stacked layer morphology, it is merely 0.5 m2/g. These are relatively low areas, indicative, in the former case, of mesoporous characteristics and, in the latter case, of merely remnant macroporosity. Of the two products, only the one made at 850 °C can be considered for meaningful adsorption studies.
Measurements of low-pressure hydrogen adsorption at 196 °C were carried out for the product prepared at 850 °C and the results are shown in Fig. 7. The adsorption isotherm belongs to type I according to the IUPAC classification. The calculated hydrogen sorption capacity is relatively high, amounting to 138 cm3/g, which corresponds to 1.1 wt%. Based on literature data, the sorption capacity of carbon nanotubes is closely related to their specific surface area [36,37]. In this regard, the determined sorption capacity appears to be much higher than based solely on the magnitude of the surface area. Anson et al. reported similar hydrogen sorption capacities to the one found in this study, but their carbon nanotube surface area was tenfold larger [38]. Facing these facts, one can presume that the BET surface area determined by low-temperature adsorption of nitrogen corresponds rather to the outer surface of the nanotubes, including likely their entangled regions, whereas it excludes the area inside the nanotubes. It is conceivable that the smaller particles of H2 can penetrate inside the nanotubes and probe the additional areas that are unavailable to the larger N2 particles used in BET determinations. Actually, a detailed analysis of the adsorption/desorption isotherms seems to support the notion that the overall sorption capacity greatly depends on the accessible interior of the nanotubes with relatively small-sized entrance diameters. First, it has been proposed that merely 5–10% of total H2 is adsorbed on outer/entangled surfaces of the nanotubes [39]. Second, the observed hysteresis loop starts at 30 kPa on the desorption curve, which corresponds to ca. 6% of the initially absorbed H2, matching well the outer surface desorption stage. For pressures below 30 kPa, both curves no longer overlap, which is consistent with the relatively too small energies of the H2 particles adsorbed inside the nanotubes for them to leave the sorption space. One has to underline that for nanotube entrance diameters of the order of the H2 particle size, the adsorbate (hydrogen)–adsorbent (internal walls of carbon nanotubes) interactions are expected to be enhanced due to their close proximity. This, in turn, will increase the energy of adsorption in the system and, therefore, hinder a removal of the adsorbed particles at lower and lower pressures during the desorption stage. Under some circumstances, this may lead to retention of some hydrogen inside the nanotubes and increased temperatures may be necessary to accomplish total desorption.
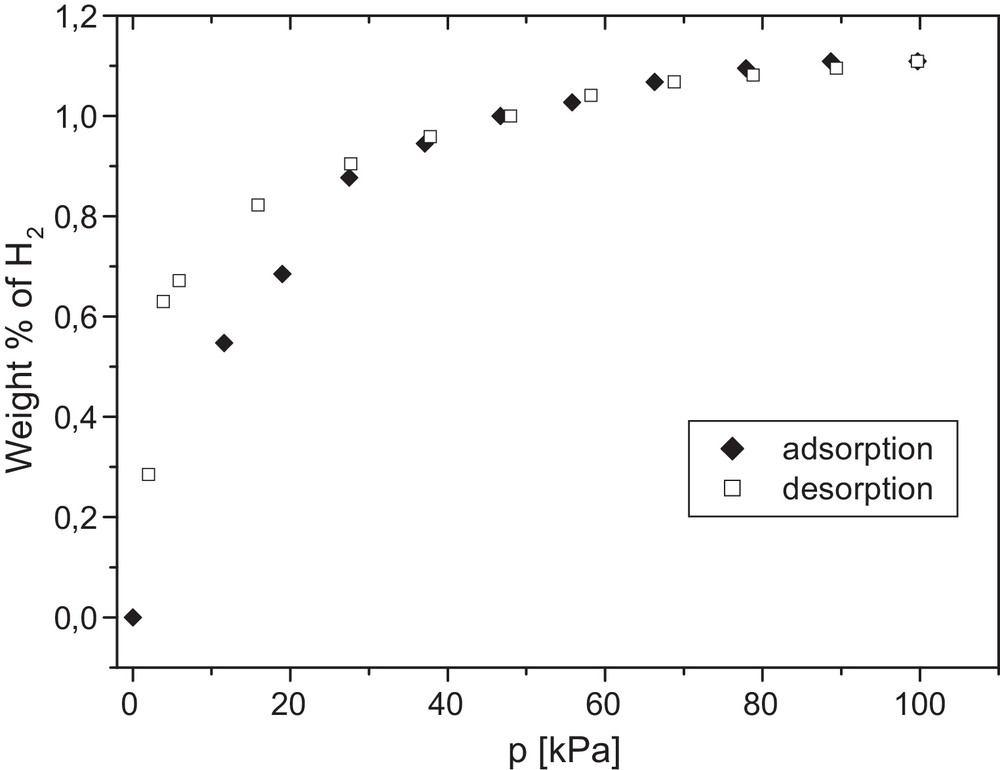
H2 adsorption/desorption isotherms determined for the product prepared at 850 °C.
4 Conclusions
The utilization of the simple toluene/ferrocene precursor system enabled the synthesis of various carbon nanostructures. At the synthesis temperature of 850 °C, the product consisted mainly of multiwalled carbon nanotubes of varying curvature, whereas at the higher temperature of 1000 °C, structures of stacked carbon layer morphology were grown. The important finding of the study is associated with the formation of multiwalled carbon nanotubes with embedded iron particles in the walls; such a material form can act as a robust carbon-supported Fe catalyst. The hydrogen sorption capacity of the product prepared at 850 °C is relatively high, despite the rather low BET specific surface area. The appearance of the pronounced hysteresis loop in the H2 adsorption/desorption isotherms measured at 196 °C is consistent with a high-energy barrier for the desorption of H2 molecules due to the presence of nanotubes with submicroporous pore characteristics.
Disclosure of interest
The authors declare that they have no competing interest.
Acknowledgements
The study was supported by AGH University of Science and Technology Grant No. 11.11.210.213.