

1 Introduction
Molybdenum disulfide MoS2 is an important inorganic material mainly studied as a heterogeneous catalysts, electrocatalysts, photocatalysts, lubricants, anode materials for Li-ion batteries, photoluminescent material, and polymer composites [1]. For all these applications, particular properties can be obtained at the nano-scale level and therefore structural characterization of MoS2 nanostructures is required.
In the literature, non-resonant Raman spectroscopy has been widely used to characterize MoS2 thin films. In particular, the dependence of the A1g and E2g vibrational modes was investigated depending on the number of MoS2 layers [2–5], on interaction with a sapphire or SiO2 substrate [6,7] or for probing van der Waals forces acting between two atomically thin crystals [8]. For nano-crystallized MoS2 films, additional Raman modes associated with the folding of the Brillouin zone along certain directions were observed in comparison to bulk MoS2 [9] but their application was limited due to small inherent intensity.
The resonance Raman effect is a particular case of Raman scattering taking place when the wavelength of the exciting line is in resonance with the electronic absorption of the sample: the vibrations involved in the electronic transition are then strongly enhanced [10,11]. Hence, the use of resonance conditions allows probing both changes of structural and electronic states.
The Raman and resonance Raman spectra of MoS2 nanoparticles were compared in previous studies [12,13]: using resonance conditions, several additional first-order and enhanced second order bands were observed. Some of them corresponding to phonons in the vicinity of the Brillouin zone edge are believed to be disorder induced [13]. Therefore, resonance Raman spectroscopy can be used to detect structural defects or conversely to check for a good crystallinity as it was done for MoS2 nanotubes [14]. Furthermore, a relationship between the intensity ratio of the bands at 455 and 465 cm−1 and the particle size was established [13,15]. In another study, this ratio was shown to increase by decreasing the number of MoS2 layers [5]. However, most phonon modes are significantly broadened or strongly suppressed in single-layer MoS2 under resonance conditions [12].
In this work, two series of fullerene like (IF) MoS2 issued from core shell ZnS@MoS2 preparation and irregularly shaped MoS2 particles (ex ammonium thiomolybdate, ATM) have been characterized by resonance Raman spectroscopy after sulphidation at different temperatures. The main enquiry was on the presence and origin of morphology induced particular features of Raman spectra.
2 Experimental part
The preparation of fullerene-like MoS2 by thermal decomposition of ammonium tetrathiomolybdate, (NH4)2MoS4, (ATM) has been previously described [16]. ATM dark red crystals were obtained by addition of 15 g of (NH4)6Mo7O24·4H2O to 200 mL of a 20 wt% solution of (NH4)2S upon stirring at ambient temperature. The precipitate was filtered off, washed with ethanol, and dried. ATM was decomposed under a H2S/H2 (15% v/v in H2S) flow at different temperatures. These compounds are labeled MoS2-ATM-T where T corresponds to the decomposition temperature.
The preparation of core shell ZnS@MoS2 solids has been detailed elsewhere [1]. Briefly, two solutions pre-heated at 180 °C in ethylene glycol (EG), one of ammonium heptamolybdate and the other one containing ZnS seed, were added to a boiling EG solution of elemental sulfur. The Zn/Mo molar ratio was fixed at 1. The brown powder obtained after 1 h at reflux was then separated and thermally treated under H2S/H2 (8% vol in H2S) at different temperatures. These compounds that corresponded to fullerene-like compounds [1] are labeled MoS2-IF-T where T corresponds to the decomposition temperature.
Transmission Electron Microscopy (TEM) was carried out on a JEOL 2010 device with an accelerating voltage of 200 keV. The samples were dispersed in n-hexane by using ultrasound, and then put onto a porous carbon filament on a copper grid sample holder. In order to protect them from oxidation by air, the samples still covered with liquid hexane were immediately introduced into the TEM vacuum chamber.
The X-ray diffraction (XRD) patterns were obtained on a Bruker diffractometer with Cu Kα emission and identified using standard ICDD files. The mean crystallite size was determined using the Scherrer equation:
Raman spectra were recorded with a LabRam HR Raman spectrometer (Horiba-Jobin Yvon) equipped with a BXFM confocal microscope, interference and edge filters and a charge-coupled device detector. The exciting line of an Ar+ ion laser at 514.5 nm or a He–Ne laser at 632.8 nm was focused using a ×50 long working distance objective. The backscattered light was dispersed with a grating of 1800 grooves mm−1 providing a spectral resolution of 1 cm−1. The position of bands was previously calibrated from the 521 cm−1 band of the Si plate.
3 Results
The fullerene-like MoS2 compounds contained a ZnS phase as an impurity in the form of large (micron-size) crystallites, present due to the preparation technique. In both the cases of MoS2-IF and MoS2-ATM, increasing the treatment temperature was shown to favor the MoS2 crystalline growth and closure of the slabs [1,16], whereas the size of particles made by the stacking of MoS2 slabs did not vary strongly as shown in TEM images (Fig. 1).
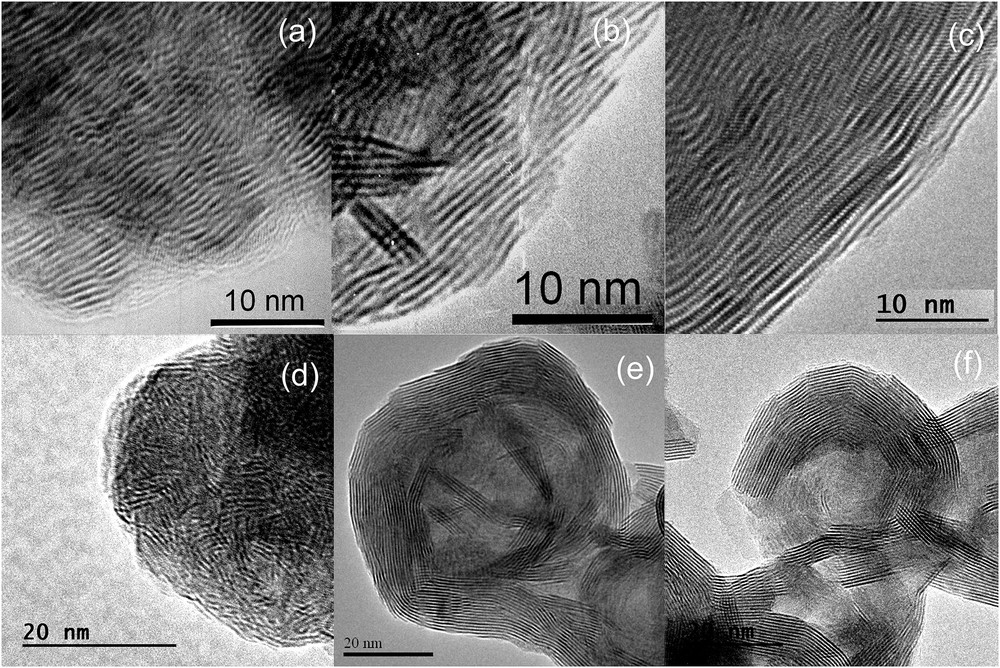
TEM images of (a) MoS2-ATM-400, (b) MoS2-ATM-550, (c) MoS2-ATM-750, (d) MoS2-IF-400, (e) MoS2-IF-550 and (f) MoS2-IF-750.
The comparison of the Raman spectra of MoS2-IF-750 achieved with different exciting lines (Fig. 2) confirmed that mainly the E2g and A1g modes at 384 and 408 cm−1, respectively [13,19] are observed using non-resonant conditions (514.5 nm). The E1g mode near 285 cm−1 (Fig. 2) is also Raman active in bulk 2H MoS2 because it is located at the Γ point in the hexagonal Brillouin zone [13,19]. As this mode is forbidden in backscattering experiments on a surface perpendicular to the c axis [13], its observation revealed that the MoS2 layers were not perpendicular to the laser but were randomly oriented (no polarization effect).

Comparison of non-resonant (514.5 nm) and resonant (632.8 nm) Raman spectra of the MoS2-IF-750 sample.
Additional bands were observed using resonant conditions (632.8 nm). These bands were not due to ZnS since its main band located at 348 cm−1 [20] was not observed. Hence, micron-size standalone ZnS crystallites do not interfere with Raman observations of MoS2. Table 1 gathers the assignments of the observed MoS2 Raman bands from the literature [13,15,21,22]. The band at 227 cm−1 was proposed to be induced by disorder similar to nano-crystallized graphite or SiC [23,24] and corresponds to a longitudinal acoustic mode (LA) located at the M point of the Brillouin zone [13]. This mode observed at 514.5 nm (Fig. 2) would be enhanced at 632.8 nm because of the modification of the electronic band structure of small particles leading to higher resonance. Note that the LA(M) mode was not observed under resonance conditions for MoS2 nanoparticles [15] and was very weak for few layer MoS2 [5]. It is clearly evidenced that resonance conditions are not enough to observe the band at 226 cm−1 with high relative intensity. The second order band at 419 cm−1 depends on the electronic state of MoS2 [13,25] as well as the A2u mode at 468 cm−1 which is only IR active under non-resonant conditions [13]. Finally, the bands at higher wavenumbers were attributed to combinations or overtones. In particular, the band at 453 cm−1 corresponds to the overtone of the one at 226 cm−1 (2 × LA(M)) and is enhanced under resonance conditions by coupling to electronic transitions associated with the excitonic states [26].
Assignments of MoS2 Raman bands.
| Wavenumber (cm−1) | Assignment |
| 189 | A1g(M)-LA(M) |
| 227 | LA (M) |
| 285 | E1g(Γ) |
| 384 | E2g(Γ) |
| 408 | A1g(Γ) |
| 419 | B2g + E1u(Γ-A) |
| 453 | 2 × LA(M) |
| 468 | A2u(Γ) |
| 528 | E1g(Μ) + LA(M) |
| 568 | 2 × E1g(Γ) |
| 600 | E2g(M) + LA(M) |
| 642 | A1g(M) + LA(M) |
The resonance Raman spectra of the MoS2-ATM and MoS2-IF series are compared in Fig. 3. The wavenumbers of the A1g and E2g modes were close to the bulk ones [3,18] for MoS2-ATM-750 and MoS2-IF-750 (385 and 408 cm−1, respectively). However, they were red-shifted for the others. The effect of the laser has to be ruled out since it was negligible for the power value used (100 μW). Furthermore, similar red-shifts were previously observed for MoS2-IF samples [13,15]. They cannot also arise from low stacking since it was equal to 5.1 for MoS2-ATM-400 and higher than 6 for the other samples. One can notice that the relationship between the wavenumber difference Δω(A1g–E2g) and the N stacking value (Δω(A1g–E2g) = 25.8–8.4/N) established for MoS2 large layers [3] does not work in our case. As an out-of-plane strain induces a blue-shift of the two bands, like that for MoS2 nanotubes [14,27], such explanation was also ruled out. In fact, the red-shifts could be explained by in-plane compressive strains [27] between small MoS2 platelets agglomerated in particles.
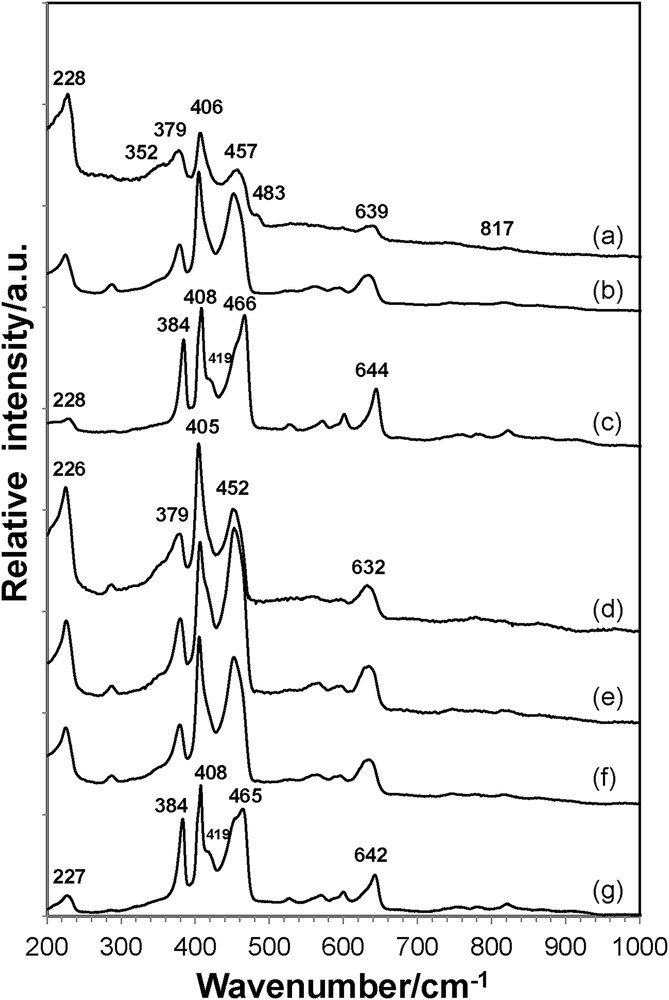
Raman spectra of (a) MoS2-ATM-400, (b) MoS2-ATM-550, (c) MoS2-ATM-750, (d) MoS2-IF-400, (e) MoS2-IF-500, (f) MoS2-IF-600, and (g) MoS2-IF-750.
Fig. 3 also evidences that the high relative intensity of the bands at 228 and 456 cm−1 is not specific to small fullerene-like MoS2 compounds. It is also important to notice that the band at 495 cm−1, claimed to be typical of fullerenes [28], has not been observed in the present study. However, the spectrum of MoS2-ATM-400 contained a small band at 483 cm−1 that could be attributed to the presence of defects [13] possibly located at the grain boundary. Furthermore, MoS2-IF-550 and MoS2-IF-750 exhibited very different relative intensities of the bands at 228 and 456 cm−1 in spite of similar particle sizes (Fig. 1). Hence, the particle size appeared to be a parameter not determining their relative intensities. Furthermore, it clearly appeared that they strongly diminished with the sulphidation temperature (Fig. 3). As the crystallite size strongly increased with the sulphidation temperature [1,16], the relative intensity of the band at 228 cm−1 was plotted as a function of this parameter deduced from XRD (Fig. 4): a clear decreasing correlation was established for the first time. It showed that this parameter was the key contrarily to the particle size. However, it is influenced by another parameter since an intensity ratio of 1.28 was determined for MoS2-ATM-400 at ca 5 nm instead of 0.42 for MoS2-IF-500 samples having the same crystallite size. Considering that relative intensity of the band at 228 cm−1 (and of its overtone) is influenced at low stacking [5], the higher intensity observed for MoS2-ATM-400 could arise from a mean stacking of only 5.1. The influence of the stacking could be negligible otherwise since this parameter was equal to 6.5 for MoS2-IF-400 and higher than 7.5 for the other samples.

Evolution of the I(228 cm−1)/I(405 cm−1) intensity ratio versus the MoS2 crystallite size deduced from the (110) XRD band.
4 Conclusion
As a conclusion, resonance Raman spectroscopy appeared as a powerful technique to probe the MoS2 crystallite size from the relative intensity of the mode at 226 cm−1 activated under resonance conditions. It should be of particular interest for supported MoS2 catalysts which contain very small crystallites that cannot be observed by X-ray diffraction or by standard transmission electron microscopy [29]. In particular, the MoS2 dispersion could be evaluated in situ by this technique [30].