

1 Introduction
Currently, nano-sized molybdenum disulphide attracts vivid attention as a catalyst in hydrotreatment, as well as a photosensitive element in light-electric solar transducers and optronic devices [1]. Various methods for obtaining highly dispersed MoS2 powders were reported [2–7]. Highly dispersed MoS2 in a form of nano-sized spheres or tube-like structures can be formed in the course of hydrothermal synthesis from ammonium heptamolybdate ([NH4]6Mo7O24·4H2O), elemental sulphur and lithium hydroxide in pyridine in the presence of ammonium carbonate and hydrazine hydrate [3]. Recently developed methods for self-spreading high-temperature synthesis of MoS2 from electroblasted nano-powder mixtures of molybdenum and elemental sulphur [4] and mechanical-chemical Mo sulphidation [5] are very attractive. Mechanical grinding of MoS2 synthesized by various methods using liquid dispersion media (heptane, butanol, ethanol, etc.) is a widely used method. Compared to solid-phase mechanical activation (MA), the solvent provides MoS2 nano-particles’ stability in suspensions. For example, coarse MoS2 powders formed at the stage of thermal decomposition of ammonium tetrathiomolybdate (ATTM) [2] are subsequently subjected to mechanical grinding in ethanol. In this paper, the shortcomings of nano-crystalline MoS2 are discussed, as well as its activity variations in reactions of hydrogenation, alkene isomerization and deuterium exchange dependent on ATTM decomposition conditions. The experimental results most relevant to the present research concerning synthesis and application of mechanically activated MoS2 nano-particles were reported in [6–7]. The authors prepared the final product by milling commercial MoS2 bulky particles in a specially designed mill in butanol. The obtained MoS2 had a high concentration of defects, and did not concede to commercially available supported catalysts in its catalytic activity in dibenzothiophene hydrodesulfurization (DBT HDS) and hydrotreating of heavy oil fractions. In spite of the advance made in these studies, the authors of the present article failed to find later publications on the subject.
It is commonly known that the MoS2 slab consists of S-M-S layers linked by weak Van der Waals bonds. Various components intercalated into the Van der Waals gap between the layers essentially affect the physical and chemical properties of the material. Thus, potassium intercalation into MoS2 is favourable for the use of the material as an active component of the catalyst for the conversion of syngas to higher alcohols and other oxygenates used as additives to motor fuels and precursors in petrochemical synthesis [8]. Those catalysts are resistant to poisoning by an ultra-low sulphur content in crudes in contrast to conventional ZnCr and ZnCu catalytic systems.
One of the effective ways to split a multilayer MoS2 slab into monolayer structures is lithium intercalation followed by exfoliation of LiMoS2 layers in water. The formed monolayers with a thickness of about 0.6 nm are stacked up to nano-sized particles by centrifugation [9]. These nano-particles showed essential catalytic activity not only in reactions of naphthalene hydrogenation and hydrogenolysis of DBT and quinolone, but also in hydrotreatment of heavy oils and bitumen [10]. The ultra low concentration of the MoS2 nano-particles in the reaction zone limits their commercial usage. Any manipulation aiming to convert nano-particles to nano-powders causes particle agglomeration and decreases catalytic activity.
The methods of solid intercalation or exfoliation of MoS2 nano-slabs under mechanical-chemical activation conditions were not reported in the literature and even a possibility to realize these processes has not been discussed yet.
The objective of current communication is to report the recent experimental results regarding the effects of the conditions of mechanical-chemical activation of both macrocrystalline MoS2 and its composition with micro-additives of methanol on the structural properties of nano-crystallites and their activity in DBT HDS.
2 Experimental
2.1 Catalyst preparation
Catalysts were prepared from commercial coarse powder of molybdenum disulphide (MoS2, fine grade, DMI-7). The content of the main substance (MoS2) is 99.72%, and the content of the fraction below 7 μm is as high as 99.00%. MoS2 was subjected to mechanical activation (MA) in an inert atmosphere of argon in a vertical vibratory mill at a powder-to-ball weight ratio of 1:60, frequency 16 Hz, and amplitude 2 mm. Small additives of polar liquids, CH3OH and H2O, were added to MoS2 in amounts of 100 and 200 μL, and 100 μL per 3 g of molybdenite, respectively. The weight ratios of the reagents in MoS2:CH3OH and MoS2:H2O were = 38:1 and 18:1, respectively. Durations of MA were 1.5, 3.0, 5.0, and 8.0 h for 100 μL of methanol, and 5, 8, 12, and 16 h for 200 μL of methanol, while 100 μL of water were mechanically activated for 8.0 h. The activated samples were stored in a dry container filled with argon.
The following notations of the catalysts in the text are used: the asterisk in *МoS2 + 100 CH3OH(8) denotes the mechanically activated sample, and 100 CH3OH(8) means the addition of 100 μL of methanol to MoS2 in the course of mechanical co-activation for 8 h.
2.2 Catalyst characterization
2.2.1 X-ray diffraction analysis (XRD)
The samples were analysed using a D8-Discover diffractometer (Bruker, Germany) within an angular range of 8–46° using monochromatic Cu Kα radiation. The sizes of the nano-crystallites (L) were determined from the coherent scattering regions (CSRs) of the samples. The inter-planar distances (D002) were calculated using the Debye–Scherrer equation [11]. The contribution from micro-deformations was estimated from the changes in the values of inter-planner distances (D002) and internal elastic micro-strains Δd/d. The level of crystallographic defectiveness and micro-strains was estimated from the variations in unit cell parameters (c/a; Table 1). The mathematical processing of the results was performed using a PDF-4+ powder database of the International Centre for Diffraction Data (ICDD). The X-ray patterns obtained were processed using program PowderCell 2.4. This program calculates the internal elastic micro-strains Δd/d in accordance with the Williamson–Hall law. The calculation takes into account the intensity of all peaks.
Structural parameters and catalytic activity data of mechanically activated MoS2 samples.
| Сatalyst | L, nm | D002, Å | Δd/d × 103 | c/a | Residual sulphur, Sres, ppm | Reaction rate constant, h−1 | |
| 1 | МoS2(0) | 50 | 6.15 | 2.1 | 3.888 | 405 | 0.22 |
| 2 | *МoS2(4) | 20 | 6.15 | 2.6 | 3.909 | 385 | 0.08 |
| 3 | *МoS2(8) | 12 | 6.20 | 8.8 | 3.954 | 105 | 0.46 |
| 4 | *МoS2 + 100 Н2О(8) | 13 | 6.19 | 3.5 | 3.921 | 161 | 0.25 |
| 5 | *МoS2 + 100 CH3OH(8) | 25 | 6.19 | 2.3 | 3.912 | 3 | 0.65 |
| 6 | *МoS2 + 100 CH3OH(12) | 10 | 6.17 | 8.6 | 3.945 | 172 | 0.26 |
| 7 | *МoS2 + 200 CH3OH(8) | 24 | 6.15 | 3.0 | 3.906 | 50 | 0.39 |
| 8 | *МoS2 + 200 CH3OH(12) | 14 | 6.17 | 2.4 | 3.916 | 7 | 0.35 |
2.2.2 Sedimentation analysis
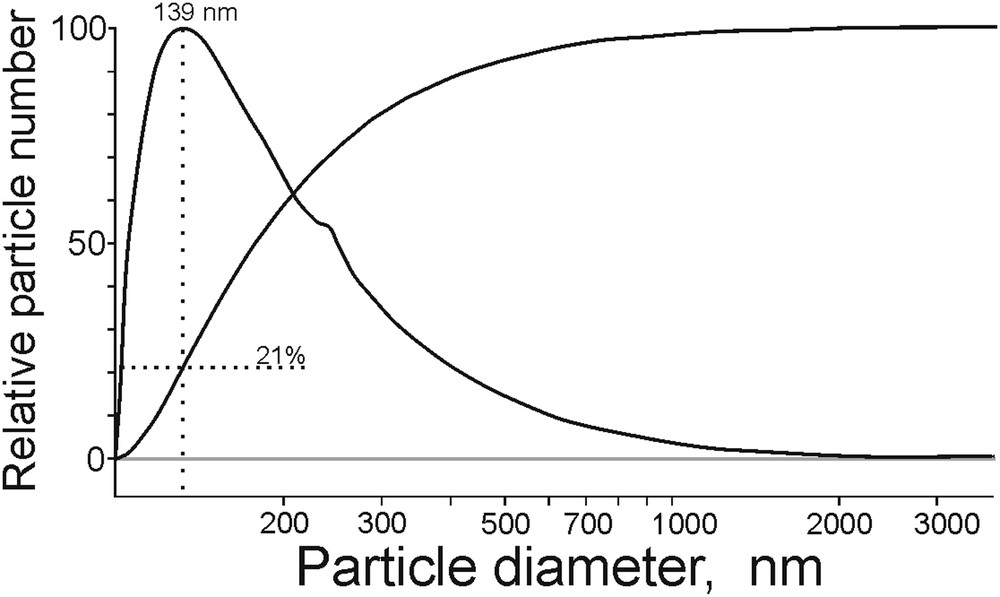
The particle size distribution in the samples was determined using a disk centrifuge CPS Disk Centrifuge DC24000 (CPS Instruments, USA) within the size range of 0.1–4 mm at a rotation speed of 2330 rpm. Preparation of the samples for analysis included mixing of 20 mg of the catalyst sample, 20 mg of synthanol (non-ionic synthetic surfactant) and 5 μL of water; the mixture was treated in an ultrasonic bath for 2 min. Then the thus prepared sample was placed in the centrifuge. The average particle sizes and their contents (Fig. 1) were obtained by processing the results of the sedimentation analysis using a software package CPS V9.5 in accordance with the approach described in the patent US 5786898.
The dispersion analysis of the sample *МoS2 + 100 CH3OH(8): relative size of the particles.
2.2.3 Transmission electron microscopy (TEM)
Transmission electron microscopy examination of the samples was carried out using a JEM-2010 electron microscope (JEOL Ltd., Japan) at an accelerating voltage of 200 kV and a spatial resolution of 1.4 Å on a lattice.
2.2.4 X-ray photoelectron spectroscopy
Examination of the MoS2 samples was performed with an SPECS photoelectron spectrometer using Al Kα radiation (hν = 1486.6 eV). The binding energy scale (Eb) was pre-calibrated in accordance with the position of the peaks of the main energy levels for gold Au 4f7/2 (84.0 eV) and copper Cu 2p3/2 (932.67 eV). The samples were applied in a powdered form to a bi-adhesive conductive copper tape. For calibration, the C1s line (Eb = 284.8 eV) of carbon present on the catalyst surface was used.
To analyse the changes in the atomic concentrations of elements in depth, the technique of ion etching of the surface of the samples was used. Etching was carried out by using an ion gun IQE 11/35 (SPECS) with an energy of argon ions of 1.05 kV and a current density of 6.8 μA/cm2. The etching rate of the surface (evaluation was carried out on calibrated InAs/SiO2 and Al2O3 thin films) amounted to 0.3–0.5 nm/min. The total etching time for the samples was 5 and 15 min.
In addition, to determine the chemical state of elements on the surface of samples, the recording of individual spectral diapasons was carried out. The lines of S 2p, S2s + Mo 3d, C1s and O1s were recorded. Panoramic spectra and individual diapasons were recorded with an energy transmission of hν = 20 eV. The relative content of the elements on the catalyst surfaces and the atomic ratios of their concentrations before and after etching were calculated from the integral intensities of photoelectron lines corrected with respect to the corresponding atomic sensitivity factors [12].
2.2.5 Simultaneous thermal analysis – mass spectrometry (STA–MS)
Thermogravimetry (TG) and differential scanning calorimetry (DSC) analysis combined with mass spectrometry (MS) of the products was performed with a NETSCH STA-449C instrument (Germany) coupled with a QMS 403C quadrupole mass spectrometer. Heating of the samples before and after their participation in the model DBT reaction was carried out in air at a flow rate of 20 ml/min to 650 °C at a heating rate of 10 °C/min. The TG/DSC results were processed using the Proteus Analysis software package.
2.3 Catalytic activity
The reactivity of the prepared catalyst systems was evaluated in a model reaction of hydrogenolysis of DBT. The evaluation criteria included the residual sulphur content in hydrogenation reaction products determined using an OXFORD Instruments Lab – X 3500 SCL sulphur analyser, and the rate constants of conversion of the target compounds.
The experiments for testing the catalytic activity were performed using an Autoclave Engineers (USA) autoclave having a reactor volume of 100 ml, at a pressure of 3.4 MPa, and a temperature of 340 °C (Sinitial = 500 ppm). The weight of the catalyst sample was 0.64 g and the volume of the mixture in heptadecane was 80 ml. The composition of the products of HDS was established from the results of gas chromatography-mass spectrometry (GC–MS) analysis using a Thermo Scientific DFS GC–MS magnetic spectrometer (Germany). The rate constants for hydrogenolysis of DBT were found on the assumption of a pseudo-first order of DBT conversion: СDBT = С0DBT⋯е–kt.
From the slope of the ln (С0DBT/СDBT) vs. time, the values of the respective rate constants were calculated. The samples with an aliquot volume of 0.5 ml were taken out from the reactor in 0.5, 1, 2, 3, 4, 6 and 7 h.
3 Results and discussion
3.1 XRD measurements of the samples
The XRD patterns of the analysed samples are shown in Fig. 2. For all the samples, the diffraction lines at 14° (002), 33° (100), 40° (103) and 44° (105), typical for initial MoS2, were observed. Their widening was determined by breaking the large crystallites into smaller blocks which were weakly oriented relative to each other.
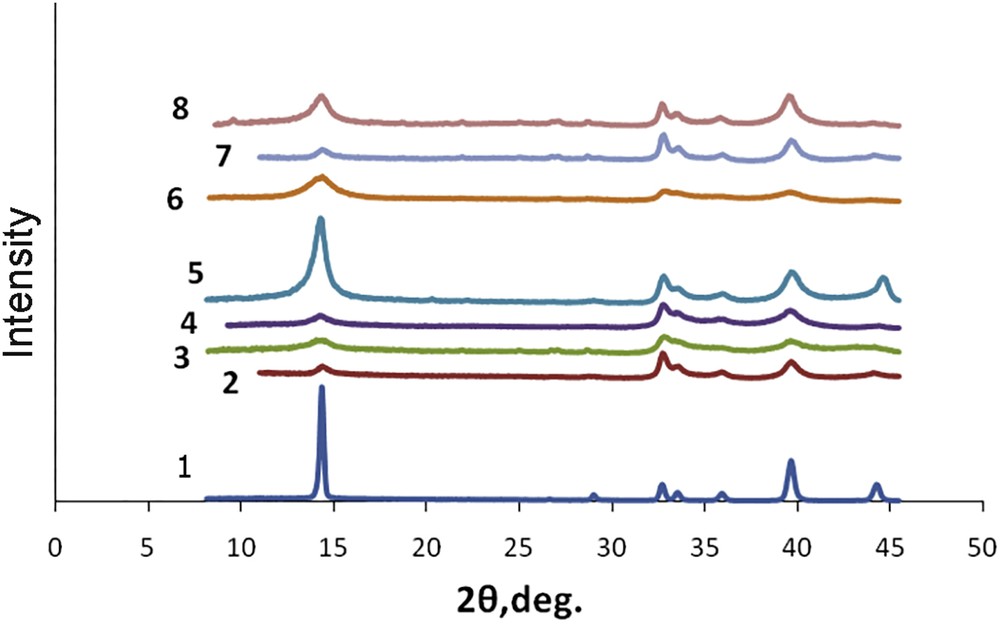
Diffractograms of catalysts: 1 – МoS2 (0); 2 – *МoS2(4); 3 – *МoS2(8); 4 – *МoS2 + 100 H2О(8); 5 – *МoS2 + 100 CH3OH(8); 6 – *МoS2 + 100 CH3OH(12); 7 – *МoS2 + 200 CH3OH(8); 8 – *МoS2 + 200 CH3OH(12).
Table 1 presents structural parameters of the analysed materials obtained using MA techniques: linear sizes of MoS2 nano-crystallites (L), interlayer distances (D002), micro-strains (Δd/d) and parameters of cell units (≿/а). One can see that mechanical grinding of the crystallites of the initial MoS2 (samples 1–3), by mechanical activation for 4 h (sample 2), reduced the linear crystallite sizes 2.5 times. The effect of MA on the morphology of the sample was merely observed. Simultaneously, internal elastic micro-strains (Δd/d) and micro-stresses in the cell units (≿/а) of nano-crystallites increased, although the interlayer distances (D002) remained constant. Further increase of MA time led to accumulation of defects and the growth of D002 up to 6.20 Å (sample 3).
As one can see from Table 1, the structural properties such as interlayer distances D002, internal elastic micro-strains Δd/d, and parameters of unit cell c/a of the *МoS2(8) sample (sample 3, Table 1) essentially increased in the course of MA. However, its activity after MA remained 20–40 times lower than that of the sample 5 *МoS2 + 100CH3OH(8) and sample 8 *МoS2 + 200CH3OH(12) treated with additions of methanol (Table 1).
Fig. 3 presents histograms reflecting changes in MoS2 crystal sizes and the internal elastic stresses dependent on the MA time (0, 4 and 8 h). According to the data, the increase in MA time up to 8 h (sample 3) causes a 4-fold increase in the initial level of the internal elastic stresses Δd/d and a 4-fold decrease in crystal sizes L (Fig. 3a and Table 1).

The effect of duration of the mechanical activation on the structural characteristics of *MoS2 (a) and its mechanically activated combination with polar liquids (b).
At the same time, samples 3 to 5 (Table 1; Fig. 3b) mechanically activated for the same time of 8 h as is and in the presence of equivalent 100 μL amounts of methanol and water show the changes of a different character: on the one hand, doping of small amounts of polar liquids only slightly affects the inter-planar spacing D002 (Table 1), although the Δd/d values decrease in the row *MoS2(8) > *MoS2 + 100 CH3OH(8) > *MoS2 + 100 H2О(8). This indicates the presence of polar additives in MA eliminating the internal elastic micro-stresses and deformations in the nano-crystallites.
It should also be noted that in literature sources the level of imperfection of crystal samples is associated with internal elastic micro-deformations in their unit cells [13]. In a number of papers the viewpoint prevails that the higher is the sample imperfection the higher is its activity. For example, the highest concentration of defects, which the authors evaluated in accordance with the XRD-characteristics of the samples, is the main reference point for preparing catalysts with high activity in the DBT HDS reaction [7].
Water positively affected the formation of layered structures and the catalytic activity in the HDS reaction. In contrast, the results of this research indicate that small amounts of water are not favourable for the increase of DBT HDS activity of the bulky MoS2 catalyst (Fig. 3b; sample 4 in Table 1). With methanol-containing systems the situation is different. Within the range of the catalysts presented in Table 1, the sample 5 has the values of Δd/d and c/a close to the average among the samples under the scope. Thus, the size of its nano-crystallites is twice as big (25 nm, Fig. 3b) as that of the comparison samples. This result suggests the manifestation of the “inhibitory” effect from the methanol at MoS2 grinding. Table 1 contains more results worth noticing: the activity of sample 5 *МoS2 + 100CH3OH(8) is the highest in respect of its hydrodesulphurization ability relative to DBT (Sres = 3 ppm; k = 0.65 h−1).
3.2 Sedimentation analysis of the catalyst samples
The integral and differential sedimentation curves of the *МoS2 + 100 CH3OH(8) catalyst had typical shapes observed for analogous suspensions. The shape of the distribution curve of the particle sizes depicted in Fig. 1 is asymmetric. This indicates a wide range of particle size distribution in a solvent (in this case it is water; paragraph 2.2.2) even in spite of surfactants (synthanol). The differential curve has its maximum at 139 nm. At the integral curve, the fraction of particles with a diameter of 139 nm and below amounts to about 21%. The position of the peak maximum among the catalysts presented in Table 1 varies in the range of 120–145 nm. The size of the catalyst particles obtained in the sedimentation analysis significantly exceeds the one of those reported in XRD data (Table 1), which may be explained by the particle agglomeration in aqueous suspensions also possibly observed in catalytic reactions. The tendency in size variation, however, was consistent for both XRD (Table 1) and sedimentation analysis methods.
3.3 TEM micrographics
The TEM images of the microstructures of the catalyst samples under study are shown in Fig. 4a–d. The samples consisted of disordered mono- and multi-layered MoS2-nano-crystallites with L ≥ 20 nm and the stacking number from 10 to 20. The samples shown in Fig. 4a and b after the MA treatment were strongly disintegrated. The MoS2 nano-crystallites contained multiple defects. The separation of the layers was also observed for these samples.
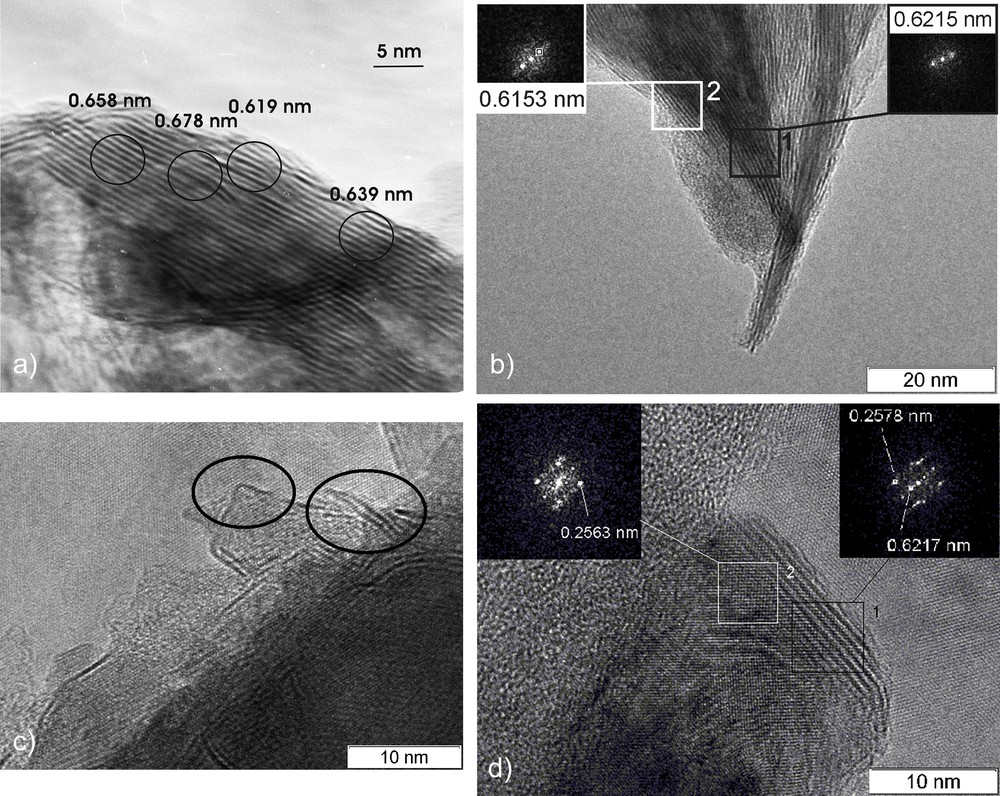
Electron micrographs of the catalysts: a – *МoS2(8); b – *MoS2 + 100 CH3OH(8) before the reaction; c and d – *MoS2 + 100 CH3OH(8) after the reaction.
Fig. 4d demonstrates that when the MA local exfoliation occurs, it may be accompanied by the formation of significant volumes of the interlayer spaces. Besides, some part of the nano-crystallites was agglomerated. After the DBT HDS reaction, the dispersion of the *MoS2 + 100 CH3OH(8) sample increased, new defects were formed, and the displaced layers were separated and disoriented towards.
3.4 XPS measurements
The MoS2 catalyst samples, mechanically activated for 8 h in the presence of 100 μL of methanol (*MoS2 + 100 СН3ОН(8) in Table 1) and subsequently subjected to Ar-ion beam etching, were studied using XPS before and after DBT HDS, being denoted as:
- 1. Catalyst *MoS2 + 100 CH3OH(8), fresh.
- 2. Catalyst *MoS2 + 100 CH3OH(8), used in DBT HDS.
The values of binding energies of the photoelectron peaks of elements measured in XPS of the samples are given in Table 2. They correspond to sulphur, molybdenum, carbon, and oxygen and the binding energies of the elements did not shift after the Ar-ion beam etching.
Binding energies of the elements and the ratios of their atomic concentrations in the catalyst samples.
| Sample | Binding energy, eV | Ratio of atomic concentrations of the elements | |||||
| S 2p | Mo 3d | C 1s | O 1s | S/Mo | Mo6+/Mo4+ | ||
| *MoS2 + 100 СН3ОН(8), fresh; Ar-0 min | 162.3 169.2 | 229.2 | 284.8 | 532.1 | 2.1 | 0.61 | 0.69 |
| *MoS2 + 100 СН3ОН(8), fresh; Ar-5 min. | 162.2 169.0 | 229.1 | 284.8 | 531.9 | 1.4 | 0.23 | 0.39 |
| *MoS2 + 100 СН3ОН(8), fresh; Ar-15 min. | 162.1 168.9 | 228.9 | 284.8 | 531.8 | 1.1 | 0.16 | 0.32 |
| *MoS2 + 100 СН3ОН(8), used, after the reaction; Ar-0 min | 162.3 169.2 | 229.2 | 284.8 | 532.2 | 2.1 | 0.03 | 0.06 |
| *MoS2 + 100 СН3ОН(8), used, after the reaction; Ar-5 min. | 162.3 | 229.0 | 284.8 | 532.1 | 1.5 | 0 | 0 |
| *MoS2 + 100 СН3ОН(8), used, after the reaction; Ar-15 min | 162.2 | 228.8 | 284.8 | 532.0 | 1.3 | 0 | 0 |
Figs. 5 and 6 show S 2s + Mo 3d and S 2p core-level XPS spectra. In the Mo 3d spectra of the studied samples the value of binding energy of Mo 3d5/2 was equal to 229.2 eV. This value of binding energy is typical for molybdenum in sulphide surroundings like in MoS2 [12, 14–15] and corresponds to the formal Mo4+ state with a part of the surface molybdenum in the Mo5+ state (BE = 231.4 eV). In the Mo 3d spectrum of the *MoS2 + 100 CH3OH(8), fresh sample, a shoulder at about 236 eV was observed, meaning a part of molybdenum was in the oxidized Mo6+ state. The shoulder from smaller values of binding energy (226.4 eV) belonged to sulphur (S2s level). Ratios between oxidized and sulphidized states of Mo and S are given in Table 2.
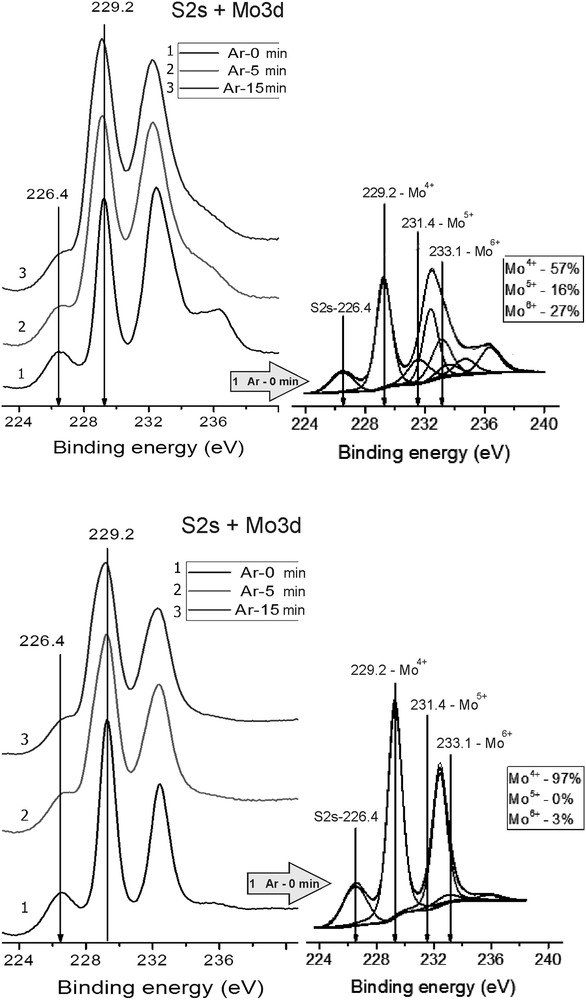
Photoelectron spectra of region S2s + Mo 3d; Fresh and Used catalysts.
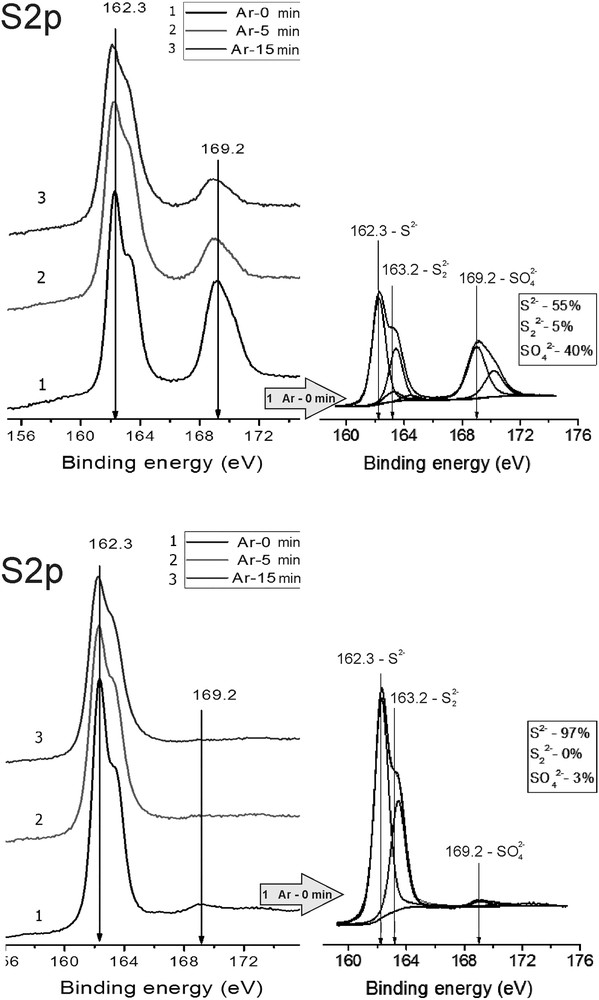
Photoelectron spectra of region S 2p. Fresh and Used catalysts.
It should be noted that Ar-ion interaction with the catalyst surface before and after the reaction leads to the appearance of an additional shoulder from lower values of binding energies due to partial reduction of the catalyst surface. Thus, in the course of Ar-ion beam etching of the surface of the (*MoS2 + 100 CH3OH(8), fresh) sample the fraction of Mo6+ decreased from 0.61 to 0.16. For the (*MoS2 + 100 CH3OH(8), used) sample the fraction of the Mo6+ was essentially lower, about 0.03, and after 5 min of Ar-ion beam etching Mo6+ entirely disappeared.
In the S 2p spectra of the samples, an intensive peak at a binding energy of 162.3 eV was detected. This value is typical for sulphides S2−. Besides, for the *MoS2 + 100 CH3OH(8), fresh sample, an additional peak at 169.1 eV corresponding to sulphur linked with oxygen in sulphate ions or bridge-like structures [16–19] appeared. The peak with a binding energy value of 163.2 eV can be attributed to sulphur in the state of .
The ratio of sulphate to sulphide forms () for the considered sample was 0.61. In the course of Ar-ion beam etching of its surface, the amount of sulphate decreased. In the (*MoS2 + 100 CH3OH(8), used) sample the () ratio was essentially lower – 0.03. After 5 min of Ar-ion beam etching of the surface, sulphate disappeared at all. It shows strong correlation of the behaviour of Mo6+ and ions.
It should be noted that the question of the presence of coordinatively unsaturated Мо5+ ions or thio- Мо5+ in the supported catalysts discovered by EPR is discussed in several publications, the authors of which attribute the presence of the mentioned species in very small amounts to defects in MoS2 crystallites [20–22]. The supported sulfide catalysts contain a very small amount of such particles. The defects in the internal MoS2 structure are the reason for their formation. The authors of previously published studies found these defects to be the anion vacancies acting as active adsorption centres in the conversion of sulphur-containing organic compounds. In contrast to those, the amount of Мо5+ in the presently investigated catalytic systems reached up to 17%, though it was found only on the surface of the catalyst samples.
3.5 Results of thermal analysis
The method of combined thermogravimetry and differential scanning calorimetry with mass spectrometry of the volatile products of the samples enabled the detection of the following catalysts’ features. Figs. 7–9 show thermal analytical curves plotted for the *МoS2 + 100 CH3OH(8) sample before and after DBT HDS. Under the analysis conditions, the thermal oxidation proceeds both on the surface and in the bulk of the sample (see 2.2.5). As it follows from the plots, the *МoS2 + 100 CH3OH(8) loss of mass was observed within the ranges of 50–250 and 280 to 550 °С. The product composition shown by the mass peaks corresponded mainly to m/e = 18 (H2O+), 12 (C+), 2 (), 32 (CH3OH+), 64 () and 44 (). In this study, only three of them: m/e = 18 (H2O+); 32 (CH3OH+) and 64 () were registered.
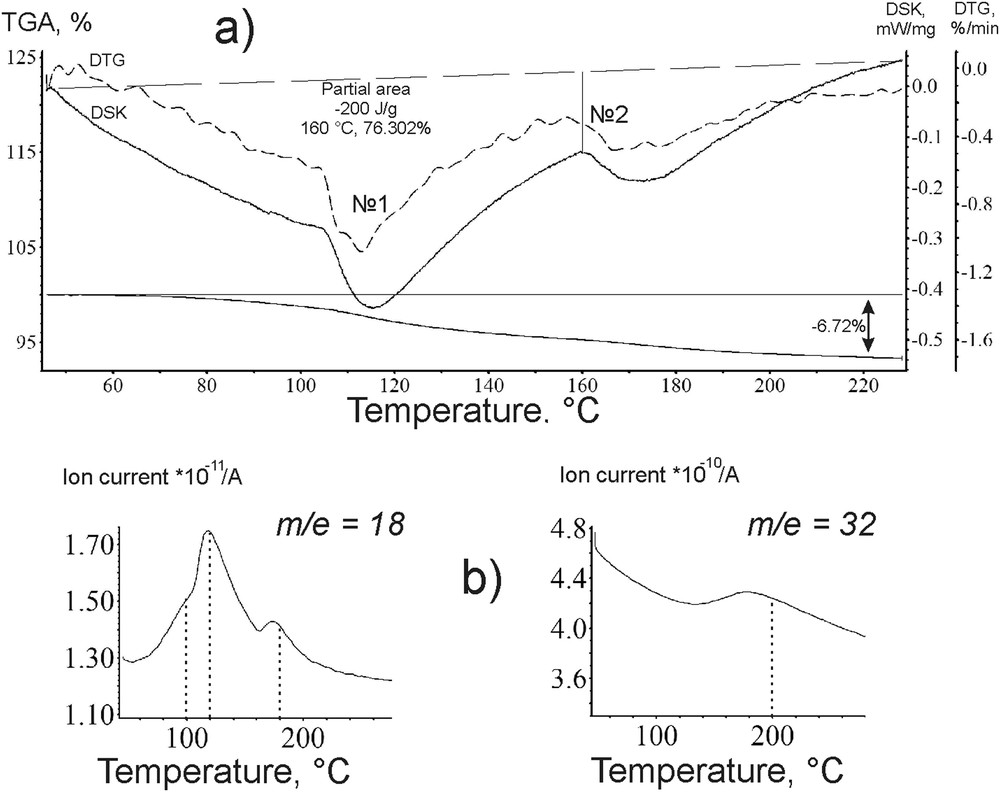
Curves of a) DSC-DTG-MS and b) H2O+; CH3OH+ ion spectrograms of the catalyst *МoS2 + 100 CH3OH(8); up to 220 °C.
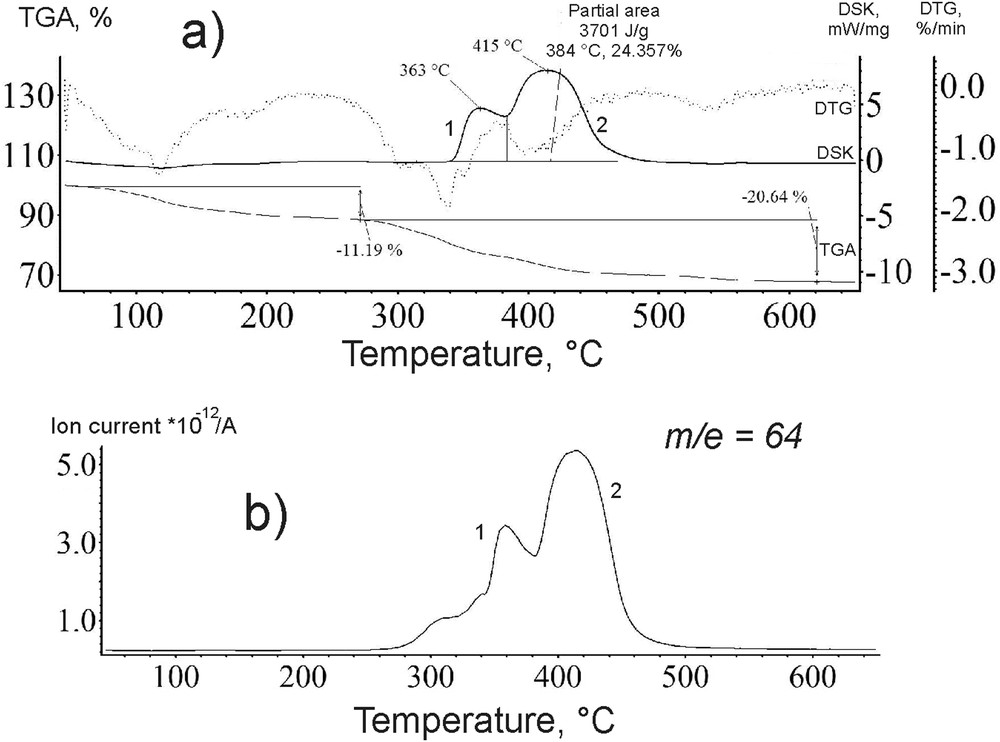
Curves of a) DSC-DTG-MS and b) SO2+ ion spectrogram of the catalyst *МoS2 + 100 CH3OH(8) before the reaction.
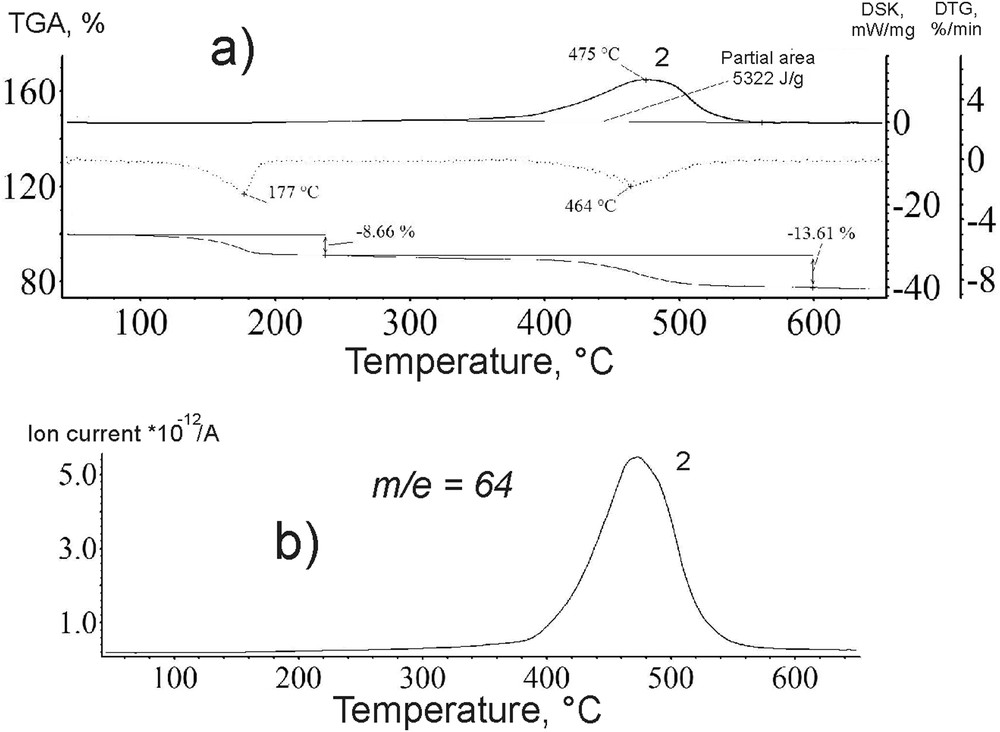
Curves of a) DSC-DTG-MS and b) ion spectrogram for the catalyst *МoS2 + 100 CH3OH(8) after the reaction.
The positions of the peaks on the DSC curves coincided with the TG ones in the range from 50 to 250 °С (Fig. 7a). The mass loss of the sample was accompanied by simultaneous heat absorption. These features in the relatively low temperature range are typical for evaporation and degassing of volatile components during the thermal analysis. On the TG curves аt 110–120 and 170–180 °С the peak maxima of the mass losses were detected (Fig. 7a); in the corresponding ion spectrograms the masses of the molecular ions of 18 and 32 were registered. The presence of molecular ions with m/e = 18 (H2O+) ratios at 100, 110 to 180 °С (Fig. 7 b) and at 180 °С testified for water evaporation; similarly, the m/e = 32 (CH3OH+) at 200 °С (Fig. 7 b) indicated the methanol loss. The mentioned MS-peaks, however, are registered at temperatures much higher than the boiling points of the corresponding substrates. This may be due to the structural binding of CH3OH and H2O, in particular within the interlayer space of MoS2 nano-crystallites.
From 280 to 550 °С, the heat emission peaks on the DTA-curve (peaks 1 and 2; Fig. 8a) were of a bimodal shape. The ionic thermogram within the indicated temperature range contains a signal with the mass of the molecular ion of 64 attributed to sulphur dioxide. Moreover, the DSC curve nearly repeated the position and shape of the exothermic peak on the DTA-curve (Fig. 8a and b). After the reaction only one DSC-peak remained (peak 2, Fig. 9a) corresponding to an MS peak (Fig. 9b). Therefore, the thermogram (Fig. 8b) for ion m/e = 64 () reflects the oxidation of sulphur to SO2 in the sample *МoS2 + 100 CH3OH(8). A broad temperature range of the oxidation (Figs. 8b and 9b) indicates that sulphur is found in the sample not in one but in various chemically bonded states.
Similar changes were observed for *МoS2 and *МoS2 + 200 CH3OH(8) samples. After the DBT HDS reaction, the first peak on the DTA-curve of the catalysts disappeared (Figs. 8a and 9a). The second peak shifted synchronously with the peak m/e = 64 () in the ion thermogram to a higher temperature region (Fig. 9a and b). The position of the MS signal after the reaction was identical for all samples and amounted to 480 °C. The intensity of thermal effects in the course of the catalyst oxidation after the DBT HDS reaction is greater by 1.4–1.7 times than that for the fresh catalyst sample (Partial area, Figs. 8 and 9).
3.6 DBT HDS examination results
The sample of the commercial molybdenum disulphide catalyst provided the DBT conversion in the HDS reaction of 20% under conditions of the experiment (Fig. 10). The sulphur content decreased from initial 500 to 400 ppm at a rate constant k of 0.19 h−1 (Table 1). The sample *MoS2(8) prepared by the MA of macrocrystalline MoS2 for 8 h was more active: the remaining sulphur content in the product decreased five times, to 105 ppm, at a rate constant k of 0.46 h−1. It was found that doping of the sample with small quantities of water during MA did not increase the catalytic activity. Thus, for *MoS2 + 100 H2O(8), the residual content of sulphur Sres was 160 ppm (Fig. 10). However, the replacement of water with methanol (100 and 200 μL) essentially improved catalytic activity.
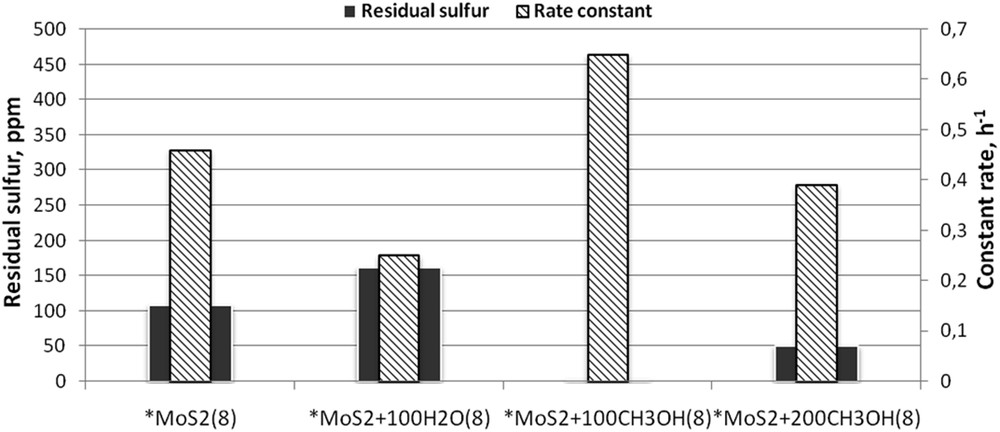
Catalytic activity of MoS2, prepared in the presence of polar liquids (duration of МА = 8 h, *MoS2 is taken as a reference sample).
The results of the experiments on finding the optimal mechanical activation time for molybdenum disulphide in the presence of methanol are shown in Fig. 11. For 200 μL of methanol (Fig. 11a) the optimal MA period was 12 h (Sres = 7 ppm and k = 0.35 h–1), for 100 μL of methanol – 8 h (Sres = 3 ppm and k = 0.65 h–1).
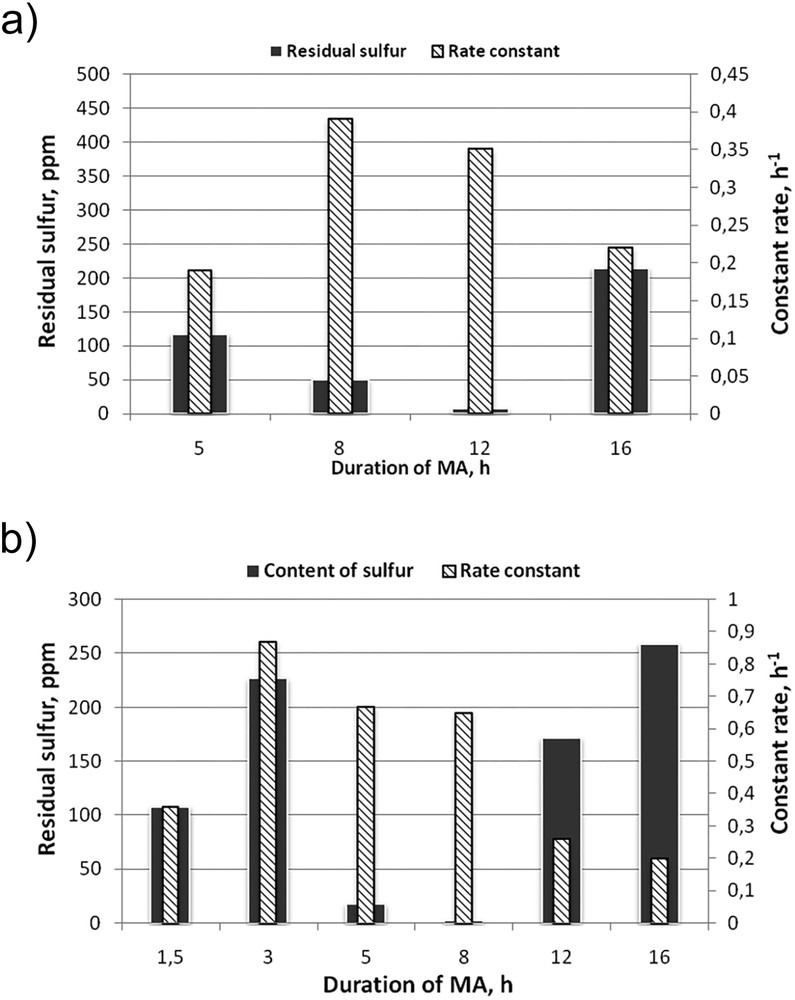
Influence of the duration of MA on the activity of catalysts; а – *MoS2 + 200 CH3OH(12); b – *MoS2 + 100 CH3OH(8).
According to the results of GC–MS analysis, the composition of DBT HDS reaction products over *MoS2 + 200 CH3OH(12) included: biphenyl (BP), cyclohexylbenzene (CHB) and tetrahydrodibenzothiophene (THDBT). The products of the reaction over *MoS2 + 100 CH3OH(8) contained only BP and CHB (Fig. 12b), thus making the compositions of the DBT HDS reaction products over the two catalysts different. In particular, the absence of THDBT among the products formed over *МoS2 + 100 CH3OH(8) allows a presumption that the reaction proceeds via direct desulphurization including the C-S bond cleavage and the BP formation followed by its hydrogenation to CHB. The presence of THDBT among the products of the DBT HDS reaction over the *МoS2 + 200 CH3OH(12) catalyst means the main pathway of DBT conversion over this catalyst as a hydrogenation reaction. The higher content of CHB compared to its content in the products of DBT HDS over *МoS2 + 100 CH3OH(8) also supports the presumption. For the sample containing only 100 μL of methanol (Fig. 12b) the excess of CHB over BP by 16% enables to assume its higher hydrogenation capacity than for *MoS2 + 200 CH3OH(12).

Composition of HDS products: а – *MoS2 + 200 CH3OH(12); b – *MoS2 + 100 CH3OH(8).
According to the previously published data, the optimal length of the Mo-sulphide nano-slabs for the catalytic properties is 3–4 nm [23–25]. The optimal size for the bulk slabs was indicated to be 30–40 nm [26–29]. Figs. 13 and 14 present final results of correlations between the size of the catalyst particles and their activity.
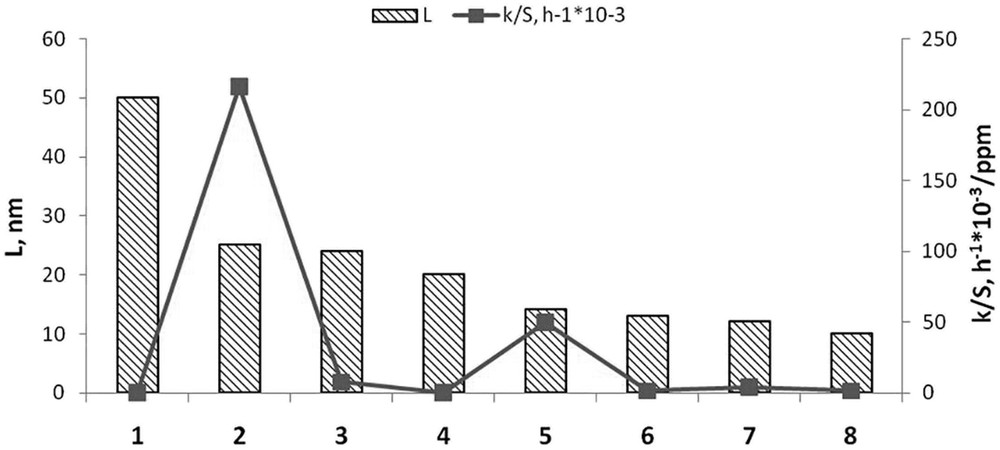
Catalyst activity (k/Sres) and L: 1 – МoS2(0); 2 – *МoS2 + 100 CH3OH(8); 3 – *МoS2 + 200 CH3OH(8); 4 – *МoS2(4); 5 – *MoS2 + 200 CH3OH(12); 6 – *МoS2 + 100 H2О(8); 7 – *МoS2(8); 8 – *МoS2 + 100 CH3OH(12).
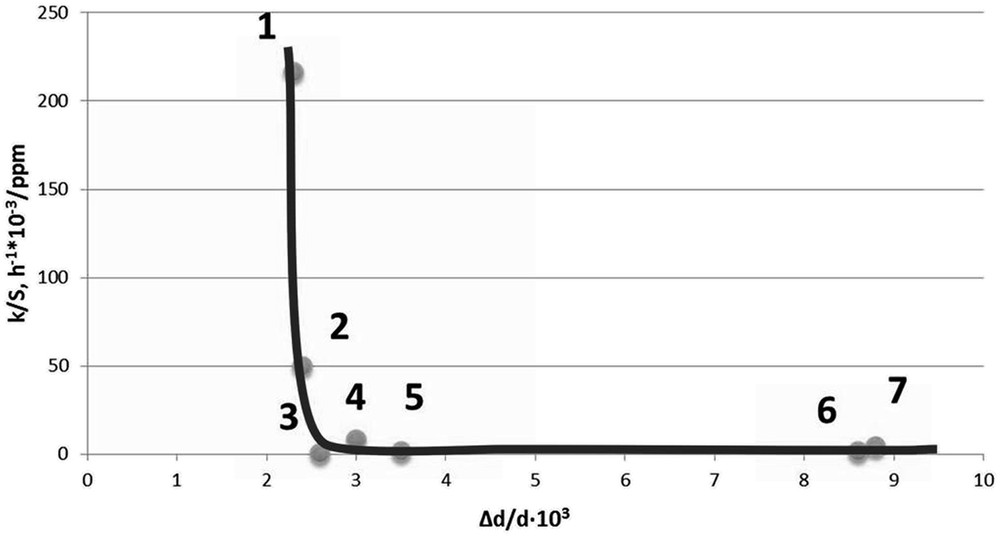
Internal elastic micro-strains and the catalytic activity of the catalysts: 1 – *МoS2 + 100 CH3OH(8); 2 – *МoS2 + 200 CH3OH(12); 3 – *МoS2(4); 4 – *МoS2 + 200 CH3OH(8); 5 –*МoS2 + 100 H2O(8); 6 – *МoS2 + 100 CH3OH(12); 7 – *МoS2(8).
In the histogram in Fig. 13, the catalysts are ranged in a descendent linear dimension decrease (L) order. The corresponding specific activity (k/Sres) undergoes two jumps although not related to the size of MoS2 nano-crystallites. Indeed, the highest activity was observed (Fig. 13) for the catalyst samples 5 and 2, *МoS2 + 200 CH3OH(12) and *МoS2 + 100 CH3OH(8), respectively, with the average linear sizes of the crystallites from 14 to 25 nm. The observed discrepancy may point to a negative effect of excessive dispersity to the catalytic activity of the samples under the experimental conditions: despite the intensive mixing of the reaction mixture (700–800 rpm), agglomeration of catalyst particles occurred as observed in sedimentation analysis (see Chapter 3.2), which may present the reason for absent correlation between the catalyst particle size and the catalyst’s activity.
Data presented in Fig. 14 have, however, revealed a “structural marker”: the nano-sized MoS2 catalytic system doped with methanol exhibits a high hydrodesulfonating capacity when the value of the internal elastic stresses is lower than 2.6 (Fig. 13). To some extent this result is consistent with the one published earlier [7] indicating a high concentration of crystal structure defects associated with high catalytic activity in the DBT HDS reaction.
4 Conclusions
Catalytic systems for the hydrodesulphurization reaction of dibenzothiophene based on molybdenum and small quantities of polar liquids have been obtained for the first time. Effects of the mechanical activation duration and the doping amounts of methanol and water on the activity of the catalytic systems have been studied in the reactions of DBT HDS. The high hydrodesulphonating capacity of methanol-containing systems with respect to DBT has been demonstrated.
It was shown that during mechanical activation of molybdenite in the presence of methanol the local exfoliation of nano-crystallite layers was observed. Methanol and water are associated with MoS2 strongly enough as evidenced by elevated temperatures of vapour degassing at 180–200 °С. Methanol slows down the grinding of nano-crystallites and enhances the formation of stress in MoS2 crystallites during mechanical activation.
A “structural marker” for mechanical activation of MoS2 nano-crystallites was revealed associated with their imperfection. The catalysts containing methanol with average linear dimensions from 12 to 25 nm at the lowest values of the internal elastic stresses (Δd/d × 103 = 2.3 – 2.4) were found to have the highest activity. Adjustment of the added methanol amount results in the change of hydrogenation ability of the catalyst. The contact with air results in the oxidation of the sample surface, manifested with the presence of Мо+5 ions, which can be considered as a reference sign of sulphur vacancies. Labile oxide compounds may screen the defects in the sulphur sublattice of molybdenum.
Acknowledgement
The authors dedicate this paper to outstanding contribution of Professor Edmond Payen to the science of catalysis, especially, to his investigations of transition metal sulphides, and wish him strong health and activity to discover new horizons in catalysis.