

1 Introduction
Hyperoxaluria is a metabolic disorder that may lead in some cases to end-stage renal failure and is defined as the excessive urinary excretion of oxalate anions (greater than 50 mg/1.73 m2 per 24 h) [1]. This disease is characterized by calcium oxalate deposition first in kidney tissue and in the case of severe decrease of the glomerular filtration rate in other tissues including bones, heart and vessels. Hyperoxaluria constitutes a multifactorial disease and among the different aetiologies related to hyperoxaluria, we can quote lethal genetic disorders of the glyoxylate metabolism (the primary hyperoxalurias) [2–8], gastrointestinal diseases including cancers, inflammatory bowel diseases and their surgical therapy (secondary enteric hyperoxaluria [9]), cystic fibrosis, and overconsumption/production of oxalate or its precursors from exogenous sources. Bariatric surgery [10] and intestinal lymphangiectasia [11] may also lead to hyperoxaluria.
Primary hyperoxalurias (PHs) are related to inborn errors in the metabolism of glyoxylate and oxalate [2–8] and lead to recurrent nephrolithiasis, nephrocalcinosis, systemic oxalosis, and renal failure. Aside from combined liver/kidney transplantation, no curative treatment exists. Calcium oxalate monohydrate (COM) kidney stones related to PH exhibit a peculiar morphology at the macroscopic and the mesoscopic scale [12–14]. Crystallite morphologies play definitely a major role in the classification of kidney stones [13,15–17] and thus in the definition of their etiology.
This contribution is devoted to the characterization of ectopic calcifications present in kidney of patients suffering from severe hyperoxaluria [18–21]. If ectopic calcifications can be probed using a usual procedure based on staining, it is at the cost of limited information on their chemical nature [22–24]. To go beyond this drastic limitation, different techniques can be used [25–28]. Here, we have selected μFourier Transform Infra-Red (FTIR) spectroscopy [29–36] and Field Emission Scanning Electron Microscopy (FE-SEM) [37–39] in order to characterize the crystalline phases forming abnormal deposits and to describe precisely their topology and structure.
2 Material and methods
Ten kidney biopsies were investigated (Table 1). The biological samples came from Tenon Hospital (Paris, France). For tissue embedded in paraffin, the paraffin was chemically removed in order to improve the crystal detection under the microscope. Each sample was only named with a study number, without indication of the name of the patient or potential identification data.
Etiology corresponding to the selected kidney biopsies.
| Sample | Etiology |
| B274 | Primary hyperoxaluria diagnosed after kidney transplantation |
| B279 | Excessive consumption of rhubarb |
| B292 | Ethylene glycol intoxication |
| B305 | Nephrocalcinosis after kidney transplantation |
| B317 | Nephrocalcinosis after kidney transplantation |
| B329 | Primary hyperoxaluria |
| B364 | Cystic fibrosis |
| B379 | Bariatric surgery |
| B380 | Stomach cancer |
| B386 | Nephrocalcinosis after kidney transplantation |
2.1 μFTIR microspectroscopy
The starting point of this investigation was given by μFTIR data in order to localize and determine the chemical nature of the pathological deposits present in kidney biopsy [39]. To fullfil IR reflexion, kidney biopsies were deposited on low-e microscope slides (MirrIR, Kevley Technologies, Tienta Sciences, Indianapolis). FTIR hyperspectral images were recorded with a Spectrum Spotlight 300 FTIR imaging system (Perkin Elmer Life Sciences, France), with a spatial resolution of 6.25 μm and a spectral resolution of 8 cm−1. Each spectral image, covering a substantial part of the biopsy, consisted of about 30 000 spectra.
IR microspectroscopy was also performed on an IN10MX microscope (Thermo Scientific) for recording large maps. All spectra were collected in ultrafast mode using a 50 μm × 50 μm aperture. The spectra were collected in the 4000–800 cm−1 mid-IR range at a resolution of 16 cm−1 with one spectrum per pixel. Data analysis of IR spectra and chemical images was performed using OMNIC software (Thermo Scientific).
2.2 Field Emission Scanning Electron Microscopy
A Zeiss SUPRA55-VP SEM was used for observation of the microstructure [37,39]. This field-emission “gun” microscope (FE-SEM) operates at 0.5–30 kV. High-resolution observations were obtained by using 2 secondary electron detectors: an in-lens SE detector and an Everhart-Thornley SE detector. Measurements were taken at low voltage (between 0.5 and 2 kV) without the usual deposits of carbon at the surface of the sample. Energy Dispersive X-ray (EDX) experiments can also be performed. In order to perform Ca cartography, the FE-SEM was operated at 12 kV.
3 Results and discussion
Quite recently, calcium oxalate compounds have been the subject of different publications [40–44] which have been dedicated to the insertion of heavy elements in their structure [45] or to their synthesis [46]. From a chemical point of view, the synthesis of amorphous COM can be considered a breakthrough in the chemistry of calcium oxalate compounds [47]. Among the different investigations we can quote the study of the adhesion and internalization between African green monkey kidney epithelial cells (before and after oxidative damage by hydrogen peroxide) and COM nanocrystals [48] or the internalization into MDCK renal tubular cells of COM crystals by endolysosomes [49]. As underlined by H. Shiraga et al. [50], although normal urine is frequently supersaturated with respect to calcium oxalate, most humans do not form stones. Inhibitors are among the multiple factors that may influence the complex process of urinary stone formation.
Regarding diseases related to calcium oxalate crystal deposition that lead to a significant loss of the kidney function, prevalent attention has been paid to hyperoxaluria. Although numerous excellent investigations exist [9,10,51–53], little attention has been paid to the crystallite morphology of COM ectopic calcification. This justifies the efforts undertaken here to describe the topology of these abnormal mineral deposits as well as their spatial repartition. In order to do so, the first step is to localize the COM deposits in the kidney biopsy.
μFTIR is an invaluable tool to probe pathological calcifications present in kidney [54–65]. Fig. 1 shows an example of FTIR data which can be gathered on a kidney biopsy (Fig. 1A). The precise identification of pathological deposits is straightforward through the position of typical IR absorption bands. In fact, a typical tissue spectrum has two primary features due to proteins, the amide I (1600–1700 cm−1) and amide II (1500–1560 cm−1) bands, which arise primarily from the C–O and C–N stretching vibrations of the peptide backbone, respectively [30,66,67]. Far from these biological contributions, it is generally the IR absorption band positioned at 780 cm−1 which is selected to obtain the spatial distribution of COM crystallites. This typical band corresponds to the δ(O–CO) vibration.
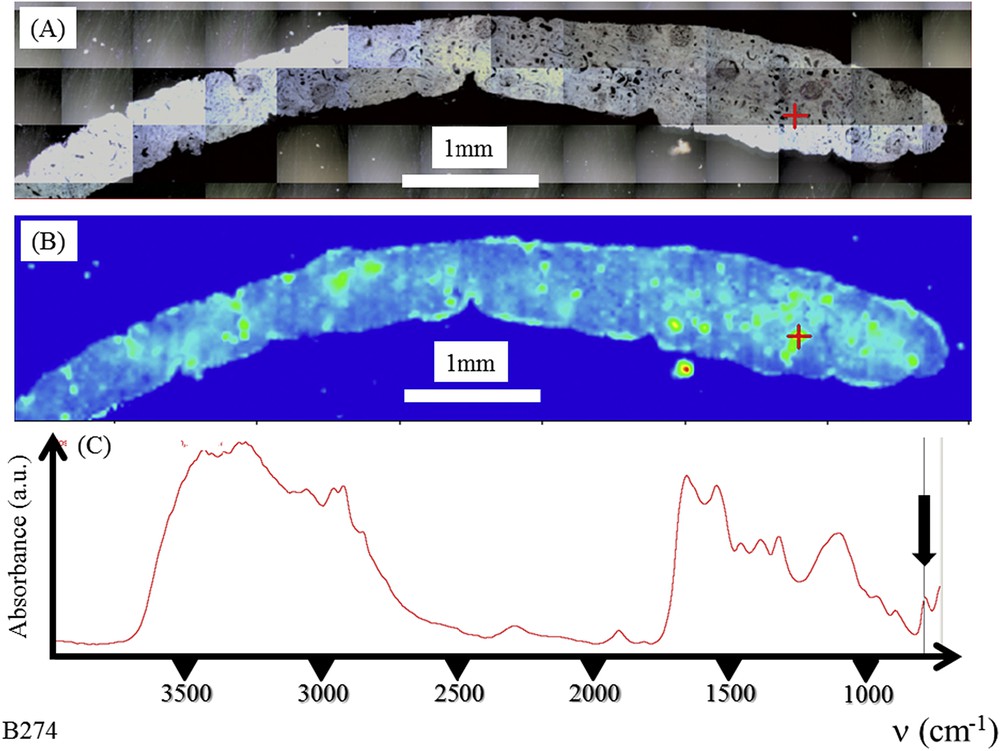
Graft kidney in a patient suffering from primary hyperoxaluria (B274). (A) Optical photography, and (B) Spatial distribution of COM deposits in the biopsy as given by the intensity of the infrared spectrum (C) at 780 cm−1.
As evidenced in Fig. 2, even small biopsy samples may be analyzed through this approach and provide useful information (Fig. 2D and E). At this point it is worth underlining that μFTIR is capable of identifying different kinds of chemical phases in the same biopsy. It is the case of the biopsy B317 for which COM (Fig. 2G and H) as well as calcium phosphate apatite (Fig. 2I and J) are present.
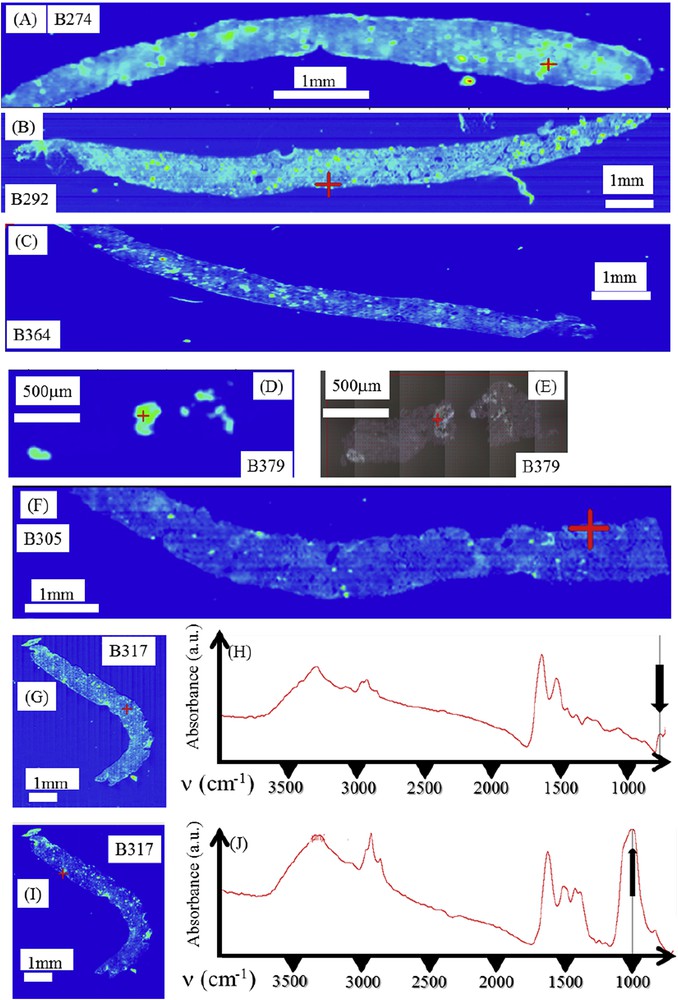
(A) Spatial distribution of COM deposits as given by the intensity of the infrared spectrum at 780 cm−1 for different biopsies. (A) Primary hyperoxaluria (B274); (B) Ethylene glycol poisoning (B292); (C) Cystic fibrosis (B364); (D) Bariatric surgery (B379), (F) and (G) Nephrocalcinosis after kidney transplantation (B305 and B317); (H,J) infrared spectra of biopsy B317: (H) Infrared spectrum of COM deposit located by the red cross in figure (G), (J) Infrared spectrum of calcium phosphate present in some parts of the biopsy as a mixture of carbapatite (CA) and amorphous carbonated calcium phosphate (ACCP) deposits located by the red cross in figure (I); (I) Spatial distribution of CA + ACCP deposits as given by the intensity of the infrared spectrum at 1030 cm−1 for biopsy B317. Masquer
(A) Spatial distribution of COM deposits as given by the intensity of the infrared spectrum at 780 cm−1 for different biopsies. (A) Primary hyperoxaluria (B274); (B) Ethylene glycol poisoning (B292); (C) Cystic fibrosis (B364); (D) Bariatric surgery (B379), (F) and (G) ... Lire la suite
The second step of this investigation is given by observations at different magnifications through last generation FE-SEM. On the very same sample on which FTIR measurements have been performed, FE-SEM offers the opportunity to describe at the submicrometer scale the topology of mineral deposits present in biopsy. Such a combined approach which mixed chemical identification (through FTIR microspectroscopy) and topology description (through FE-SEM) both at the cellular level is exemplified in Fig. 3. Details regarding the crystallite morphology can be obtained through observations at high magnification.
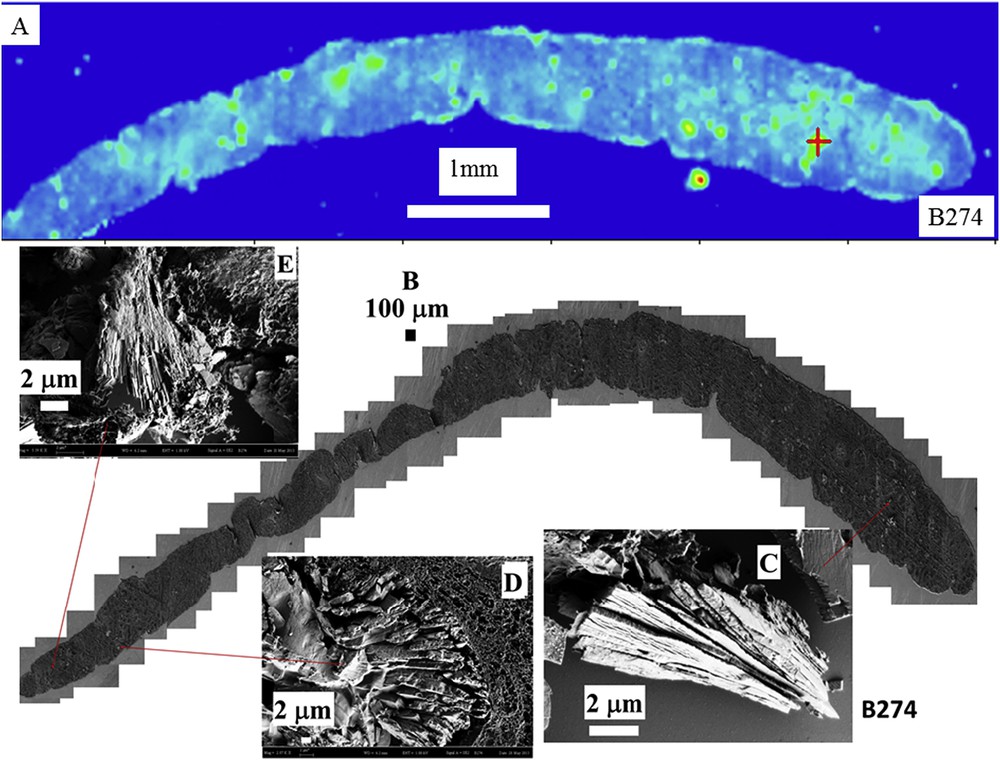
(A) Spatial distribution of COM deposits in biopsy B274 as given by the intensity of the infrared spectrum at 780 cm−1 and the topology of the different abnormal deposits. (B) Topology of the different abnormal deposits for the biopsy B274. (C, E) Radial agglomeration of COM platelets and (D) agglomeration of platelets.
Similar data have been gathered for the different kidney biopsies selected in this study as shown in Fig. 4 (for the biopsy B292) and Fig. 5 (for the biopsy B317). As previously underlined, all the deposits are not made of COM for the biopsy B317 and the red star in Fig. 5 indicate the location of a deposit made of calcium phosphate apatite. Of notice is that the precise description of the crystallite morphology can be obtained even for small kidney biopsies.
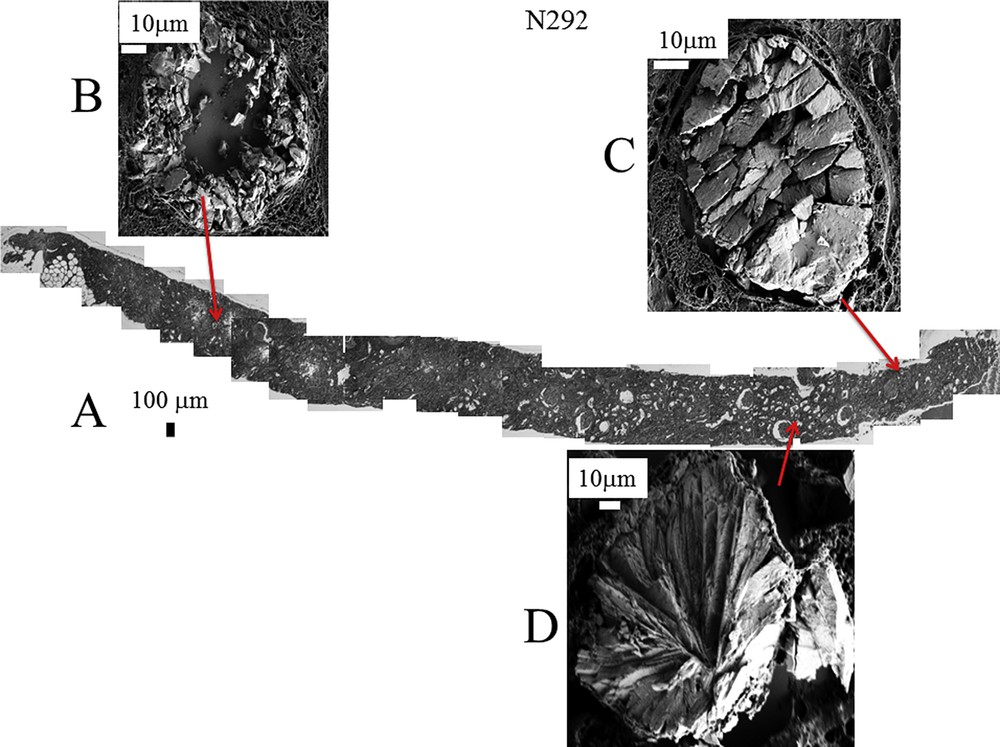
A: Topology of the different abnormal deposits in the biopsy B292. Agglomeration of “large” crystallites is observed in the lumen of tubules (C) while agglomeration of “small” crystallites is located in the tubular cells (B). (D) Radial agglomeration of platelets.
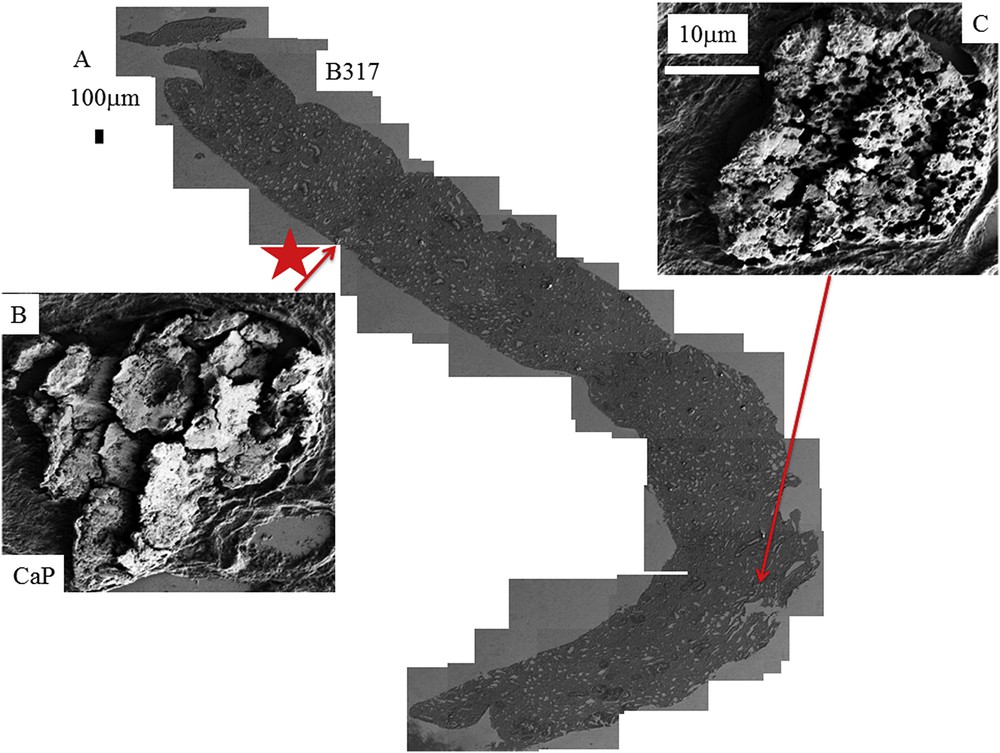
A: Topology of the different abnormal deposits for the biopsy B317. B: The red star corresponds to the deposit of CA. C: Presence of numerous holes on the surface of a compact agglomeration of crystallites.
Even if the number of samples is limited, the complete set of observations through FE-SEM indicates that COM deposits may exist with very different topologies whatever the etiology of hyperoxaluria is. This diversity is clearly visible in Fig. 3 (B274) which corresponds to genetic hyperoxaluria, in Fig. 4 (B292) which corresponds to hyperoxaluria related to the consumption of ethylene glycol or in Fig. 5 (B317) which corresponds to COM and carbapatite deposits in a grafted kidney. Another cause of hyperoxaluria is bariatric surgery, as shown in Fig. 6, where COM crystallites may form poorly organized platelets in tubular lumens. In other cases, some ectopic COM calcifications are made of an agglomeration of COM platelets with a concentric distribution (Fig. 7). Such diversity may be, at least in part, related to the location of deposits, most of them being observed in the lumen of tubules while others seem to be located in the tubular cells (Fig. 4). The size of crystallites seems to be small for deposits within cells by comparison to deposits accumulated in the tubular lumen where a radiating organization of the crystallites is often encountered (Figs. 5 and 8). In the case of biopsy B274, very different topologies may be observed (Fig. 9). Another cause for the diversity in the morphology of the deposits is the chemical composition. Fig. 5 shows various images of deposits of biopsy B317; Fig. 5C corresponds to calcium oxalate deposits while Fig. 5B corresponds to calcium phosphate plugs in the tubular lumen.
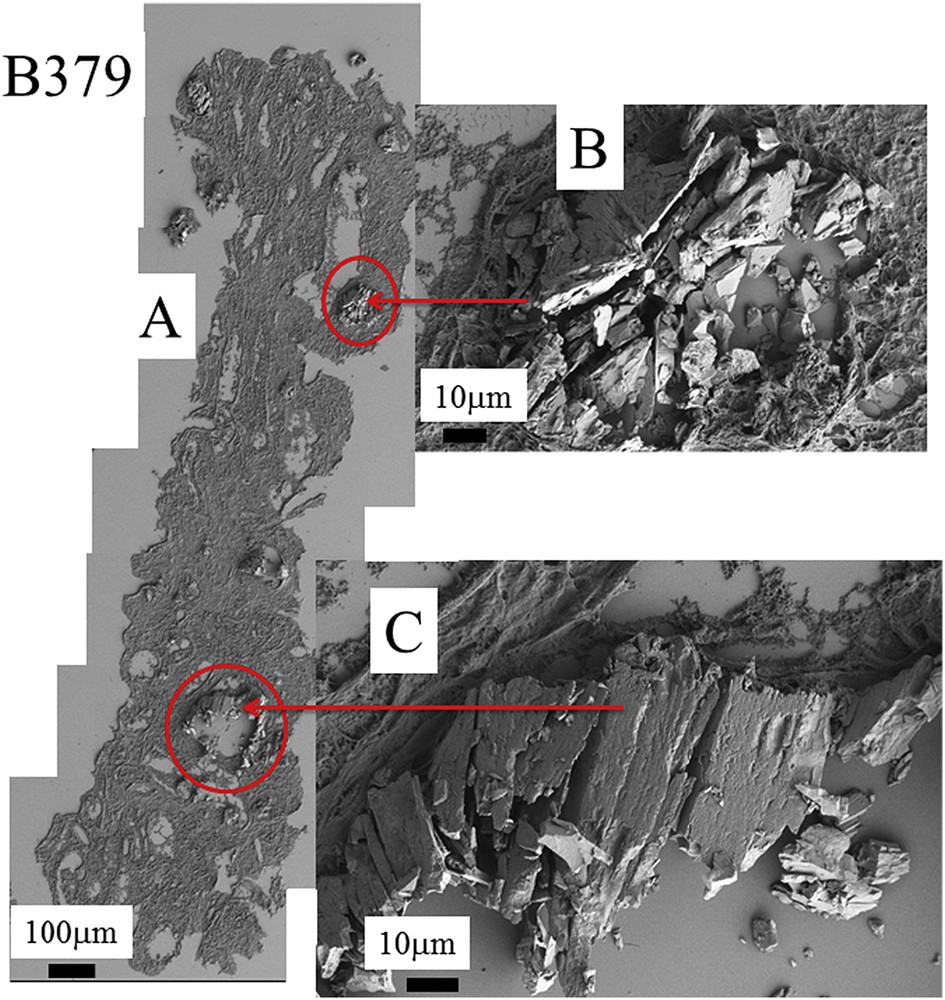
A: Topology of the different abnormal deposits at different magnifications for the biopsy B379. B and C agglomeration of “large” and “small” crystallites.
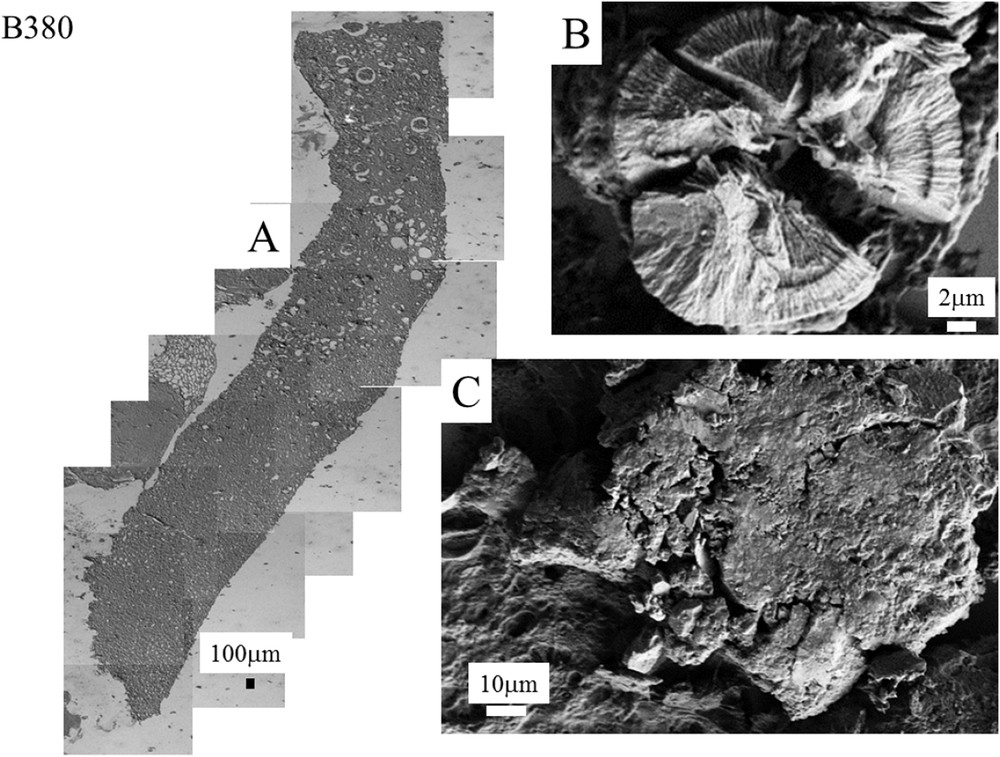
A: Kidney biopsy from a patient suffering from stomach cancer (B380). Topology of the different abnormal deposits at different magnifications for the biopsy B380. B: Concentric agglomeration of platelets. C: Agglomeration of very small crystallites.
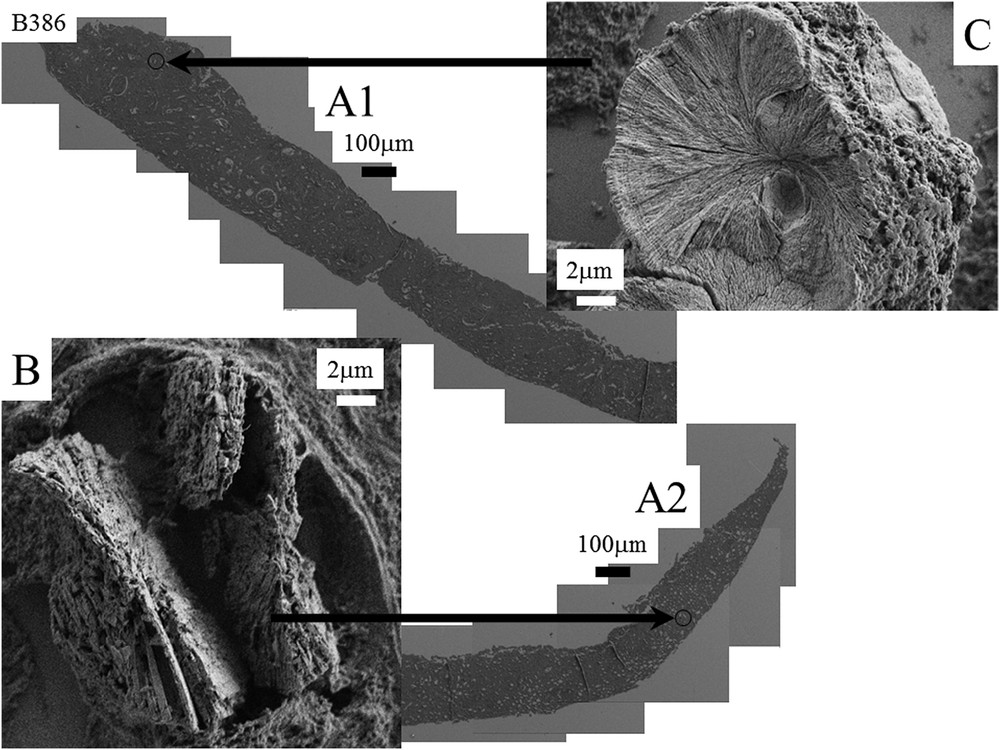
A1 and A2: Nephrocalcinosis after kidney transplantation (B386). B and C: Topology of the different abnormal deposits at different magnifications for the biopsy B386. B: agglomeration of platelets C: Radial organization of platelets.
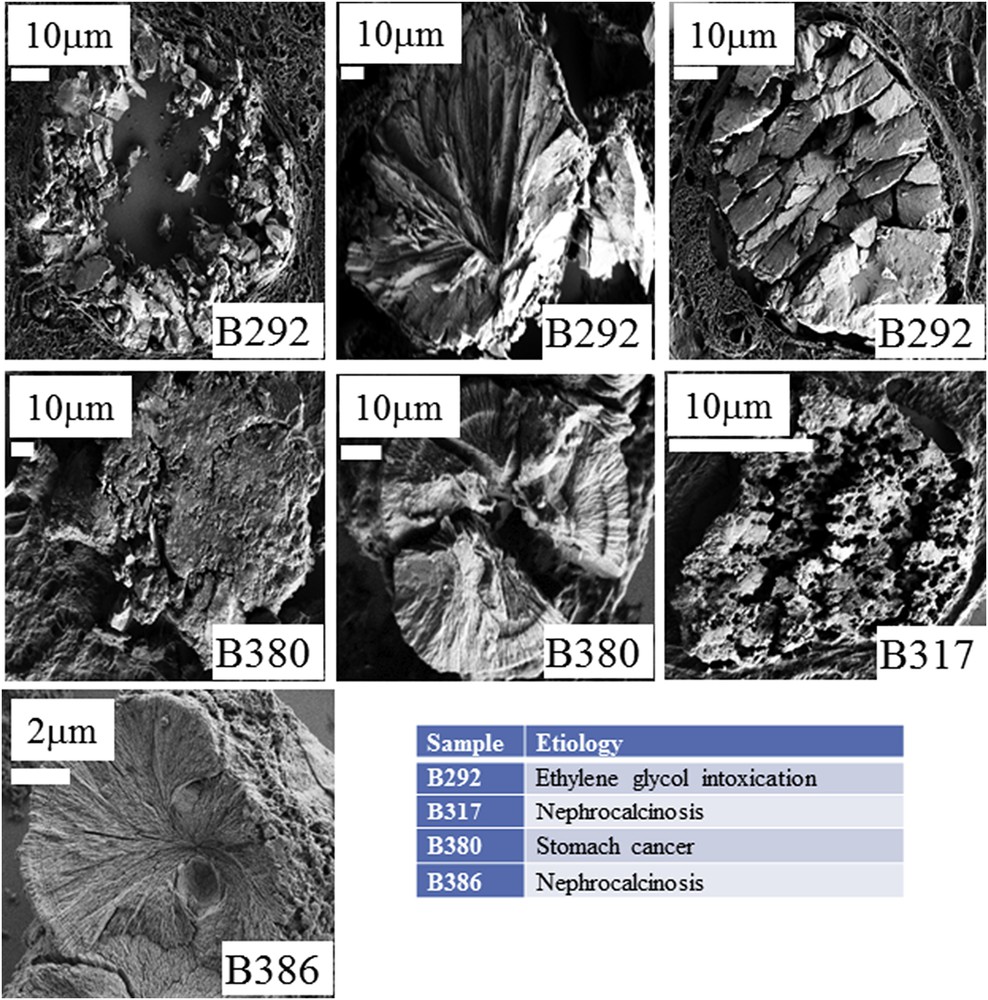
Diversity of the crystallite morphologies observed for the different biopsies.
From a chemical point of view, it is well known that adsorption of molecules at the crystal surface may modify the crystal‘s morphology [68–71]. In Fig. 10, typical synthetic COM crystals are shown for which the crystallographic face has been indicated through their miller indices [72]. Adsorption of some molecules (here peptides) leads to the formation of a “smooth” apical tip. Such modification of the morphology is well known, adsorption of molecules is preferentially observed on undercoordinated atoms of corners, ridges, or faces leading to their eventual reconstruction and formation of new faces which will determine the final exposure of these new faces and thus the crystallite's morphology in the native solution. Note that some anionic surfactants, however, not only changed the crystal shape, but also induced the formation of metastable calcium oxalate dihydrate (COD) with increasing surfactant concentration [68].
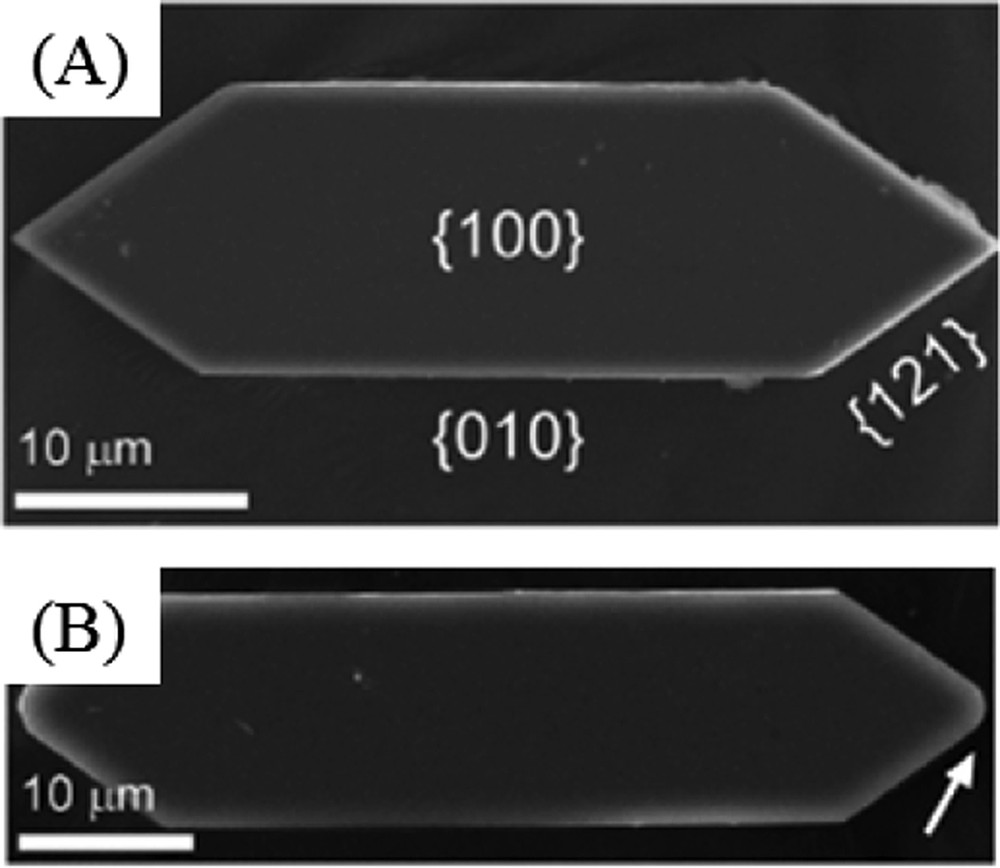
(A) Control crystals exhibit an elongated hexagonal platelet morphology with basal {100} surfaces bounded by {010} and {121} sides. (B) COM crystals prepared with peptide D4 exhibit a higher length-to-width aspect ratio. Several peptides in the library also induced rounding of the apical tip (arrow in B).
Similar results have been obtained by A. Okada et al. [73]. These authors investigated the possible role of a particular protein, osteopontin (OPN), a major component of the kidney calcium-containing stone matrix in the crystallite morphology. To attain this goal, a comparison between wildtype and OPN knockout mice was performed. As we can see in Fig. 11, significant differences existed between large rosette and radial shaped crystals observed in WT mouse kidney (Fig. 11A) and small and uniform crystals observed in the OPN KO mouse (Fig. 11B). Thus, OPN plays a crucial role in the morphological organization of COM crystals in mouse kidneys.
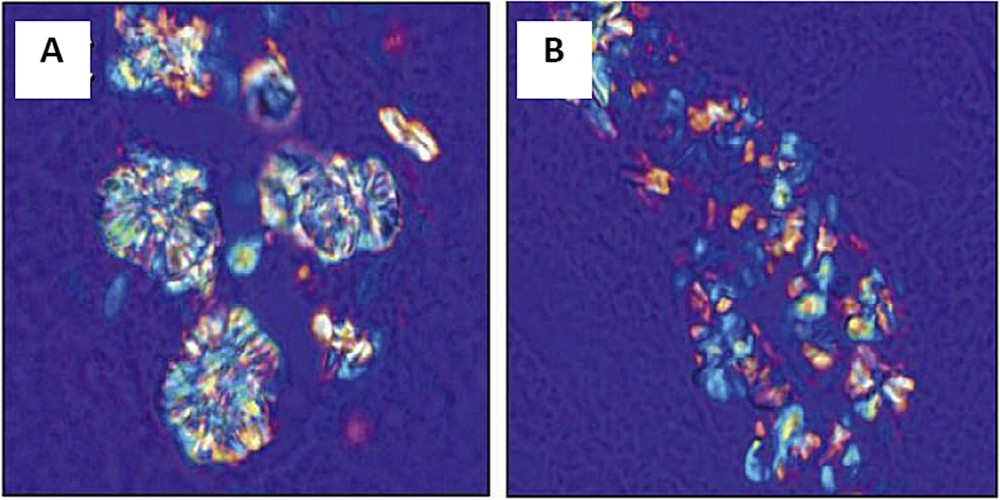
Polarized light optical microscopy showed large rosette and radial shaped crystals in WT mouse kidney (A) and small and uniform crystals in the kidney of OPN KO mouse (B). (Adapted from [73]).
These examples show that the biochemical environment of calcium oxalate crystallites plays a major role regarding their morphology. In Table 2, we have tried to gather the different morphologies pointed by FE-SEM observations.
Morphology of abnormal deposit of COM for the different kidney biopsies selected for this investigation.
| Sample | Etiology | Morphology of abnormal deposit of COM |
| B274 | Primary Hyperoxaluria | Agglomeration of platelets with radial organization of platelets |
| B292 | Ethylene glycol | Agglomeration of “large” crystallites observed in the lumen of tubules, agglomeration of “small” crystallites located in the tubular cells and radial agglomeration of platelets. |
| B317 | Nephrocalcinosis | Loose agglomerate of small crystallites |
| B379 | Bariatric surgery | Agglomeration of “large” and “small” crystallites |
| B380 | Stomach cancer | Concentric agglomeration of radial platelets or agglomeration of very small crystallites |
| B386 | Nephrocalcinosis | Agglomeration of platelets with or without radial organization of platelets |
From a physiological point of view, many kinds of ion and molecule exchange processes exist along the nephron. These exchanges imply that the biochemical environment varies significantly between the proximal tubule, the Henle's loop, the distal tubule and the collecting duct. For example, as underlined by P.S. Aronson [74], the reabsorption of NaCl in the proximal tubule occurs passively through the paracellular pathway, and actively by a transcellular route. Moreover, although short in length, the distal convoluted tubule plays a critical role in sodium, potassium, and divalent cation homeostasis [75]. These changes in the biological environment along the nephron may have a significant effect on the morphology of crystals and aggregates of calcium oxalate. If one wants to establish a relationship between the COM crystallite morphology and the nature of hyperoxaluria, we have to combine this μFTIR – SEM investigation with immunostaining procedures to distinguish between the different parts of the nephron.
4 Conclusion
In order to establish a possible relationship between the morphology of COM crystallite present in kidney biopsy and the nature of hyperoxaluria, a μFTIR-SEM investigation has been performed. The complete set of data allows us to gather information for the first time on the physico-chemistry of the ectopic calcifications on a set of human biopsies. First, even in the case of hyperoxaluria, deposits made of calcium phosphate can be present. Such chemical diversity calls for a characterization through physicochemical techniques like FTIR microspectroscopy for a more accurate diagnosis of the factors involved in crystallization. Moreover, even if the number of kidney biopsies included in this series is low, we have shown a diversity in the crystallite morphology, even for the very same biopsy. Various factors may be involved in such diversity including the precise location of the crystals, the presence of compounds able to modulate crystallization, and likely the composition of the fluid in the tubule depending on the segment of the nephron where the crystals are found. Further studies combining μFTIR-SEM investigation and immunostainings specific for the different segments of the nephron would allow one to analyze more thoroughly intratubular calcifications topography. Finally, we would like to underline that there is an opportunity to characterize the proteins present on the surface of COM nanocrystals through nano-FTIR [76–78].
Acknowledgments
This work was supported by the Physics and Chemistry Institutes of Centre National de la Recherche Scientifique and by contracts ANR-09-BLAN-0120-02, ANR-12-BS08-0022, ANR13JSV10010-01, convergence University Pierre et Marie Curie CVG1205 and CORDDIM-2013-COD130042.
Vous devez vous connecter pour continuer.
S'authentifier