

1 Introduction
Several elements of the periodic table exhibit a peculiar electronic structure when they retain their last s2 electron pair, not involved in the bonding, from {He}2s2 up to {Xe}4f145d106s2 for Po4+; such elements characterized by their lone pair E ns2 (2 ≤ n ≤ 6) are designated hereafter by M*. They show generally a one sided coordination to their ligands 2 ≤ CN ≤ 5, E completing a polyhedron which surrounds M* up to CN = 6. In molecular chemistry, the Valence Shell Electron Pair Repulsion (VSEPR) model has been well established [1,2].
In solid state chemistry, M* elements give a very rich family of compounds with crystal structures always revealing original characteristics with empty channels, thick layers separated by impenetrable volumes excluding any other atoms thanks to E with its peculiar stereochemistry. In this field, for oxides, fluorides and oxyfluorides, an original approach was proposed by considering E as having a volume, non-compressible and analogous to oxygen or fluorine anions; the so-called “volume of influence” likely contributes to hcp or ccp packing [3].
A simple test was done to control the reality of E volume occupancy by calculating Vr, a reduced volume by dividing V cell volume by the Z number of O (or F) as well as E contained in the cell. As a consequence, approximate coordinates of E were obtained on the basis of the average EO ∼ OO(or F) distance to the one sided coordinated atoms, such geometric calculation allowing to estimate M*-E distance and direction for these M* E units [4].
Recently, a new approach of M* and E stereochemistry of 6s2 elements by a joint crystal chemistry and ab initio analyses has been developed by two of us for TlI, PbII, BiIII and PoIV, covering all polyhedral M*XnE possibilities essentially for oxides, fluorides and oxyfluorides [5,6]. In most of the environments except for octahedral and cubic ones, E volume departs from spherical.
The localization and size of E and its volume of influence were clearly specified. If VSEPR general rules are followed, LP–LP repulsion stronger than LP-BP, must be strictly applied in close M* bonding because there are many examples where LP packing participates in network building by their various associations in tetrahedral chains or double layers. In these series of M* elements, positions and sizes of E lone pairs have been defined. It was surprising but clearly established that the widest E belongs to Tl+, its electronic doublet 6s2 generating an electronic cloud (its sphere of influence) with a radius: rTl+ = 1.40 Å.
Our aim in this work is to focus on the nitrogen lone pair, formally 2s2, with the objective of precisely determining its location with respect to its carrier atom, i.e. its Ec centroïd. We also aim at defining the LP form, size and coordinates of its volume of influence E, which is in fact the electronic cloud generated by Ec, and the final geometry of NXnE. For this purpose, the stereochemistry of four compounds has been revisited and analyzed in the light of quantum density functional theory (DFT) [7,8] completed by fine analyses of electron localization functions (ELF) [9]: NH3E, ammonia; NOFE, oxyfluoride; N2O3E2, oxide; AgNO2, silver nitrite and NCl3E, nitrogen trichloride. For details on the methodology and the theory regarding DFT and ELF, the reader is kindly referred to the Annex for a brief overview and former accounts on the topic [5,6].
2 NH3E
Ammonia is a colorless gas, lighter than air, easily solidified below 195 K.
2.1 Crystal structure
As shown for the first time in 1925, NH3 crystallizes in the cubic system; its unit cell contains four molecules [10]. These molecules are in a nearly perfect cubic close-packing. N atoms are located on the threefold rotation axis (4a Wyckoff site) and hydrogen atoms in 12b sites; they build typical NH3 tetrahedral isolated molecules. More recently, the refinement of the structure was published together with its electron density distribution [11]. These last crystal data are summarized in Table 1.
NH3E crystal and DFT data [11].
| NH3E – Cubic, space group P213 (N°198), T = 160 K | |||||||||
| a (Å) | b (Å) | c (Å) | V (Å3) | Z | Vr(H,E) (Å3) | ||||
| 5.1305 | 5.1305 | 5.1305 | 135.05 | 4 | 8.4 | ||||
| 5.1328 | 5.1328 | 5.1328 | 135.23 | 4 | 8.5 | ||||
| Interatomic distances (Å) and angles (°) | |||||||||
| N–H | 1.010 | H–H | 1.646 | ∠HNH | 109.2 | ||||
| Data from DFT-ELF analyses | |||||||||
| N–H | 1.030 | H–H | 1.662 | ∠HNH | 107.5 | N 0150Na,b,c | 3.320 | Ha 0150Hb,c | 2.559 |
| N–Ec | 0.79 | Ec–H | 1.51 | ∠HNEc | 111.4 | Ec 0150Ha,b,c | 1.79 | H 0150Ha | 2.342 |
| N–E | 0.65 | E–H | 1.40 | ∠HNE | 111.4 | E 0150Ha,b,c | 1.87 | H 0150Hb | 2.758 |
Based on these X-ray data, a perspective view of this molecular structure is presented in Fig. 1 in which, as a first approximation, a nitrogen lone pair E has been added to get a general picture. Nitrogen sits on A3 threefold rotational axis and is bonded to three hydrogen atoms, being one side coordinated and making a trigonal pyramid NH3. Owing to this symmetry, the E lone pair which, in such tetrahedral coordination, is actually an sp3 hybrid orbital, achieves a quasi-perfect model of CN = 3 + 1 tetragonal geometry for NH3E; E was set up on A3 crystal axis using a dedicated software [12] with an approximate H-E distance of ∼1.6Å, giving N–E ∼ 0.96Å.
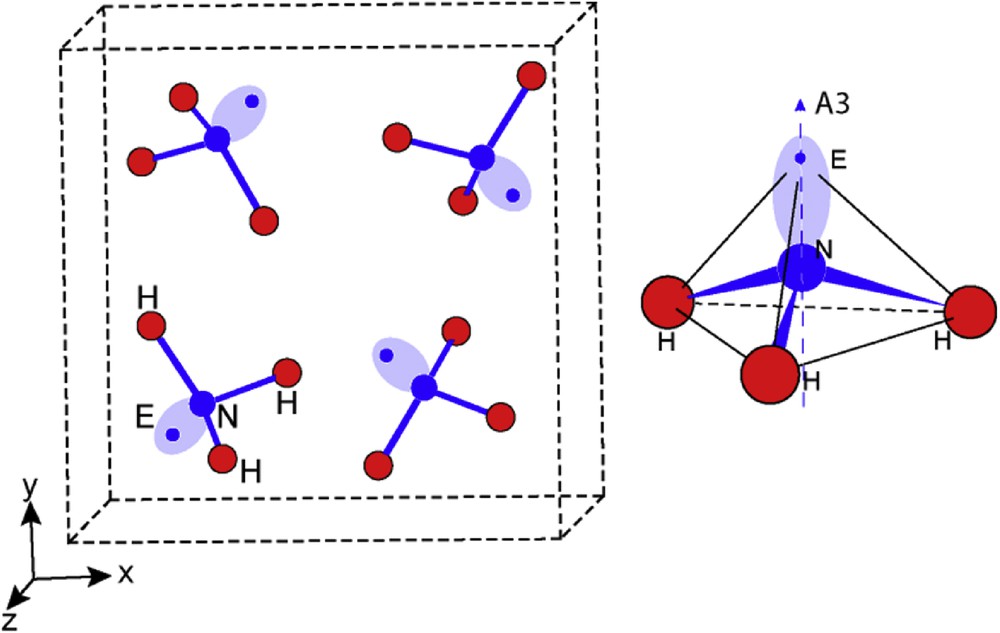
Perspective view of the NH3E molecular structure; E lone pair is represented schematically by an elongated ellipse whose axis indicates the N–E direction along threefold rotation axis (A3) and a blue dot indicates the center of its volume of influence. On the right hand side, the tetrahedral geometry of [NH3E] is shown, with N atoms enclosed in a tetrahedron built by the three H atoms making an equilateral base and E situated at the apex. N and E sit on the A3 axis.
In their detailed X-ray crystal structure analyses completed by some ab initio calculations, the authors [11] have particularly emphasized the problem of NH bending and incidentally indicated lone pair direction along A3 with N–E = 1 Å. E lone pair must be influential on NH bond bending as well as on ∠HNH angle evolution even if other solutions are preferred. Nevertheless, the E stereo-structural effect is of paramount importance as shown for 6s2 lone pairs replaced in their structural environment [5,6].
2.2 DFT and electron localization function (ELF)
Based on accurate high Brillouin zone integration, the ELF's are first used to produce the three-dimensional 3D isosurfaces shown in Fig. 2. The tetramolecular NH3E structure is then shown with a close arrangement to that shown in Fig. 1 then the 3D ELFs in panel b) clearly highlight the E development observed on top of nitrogen.
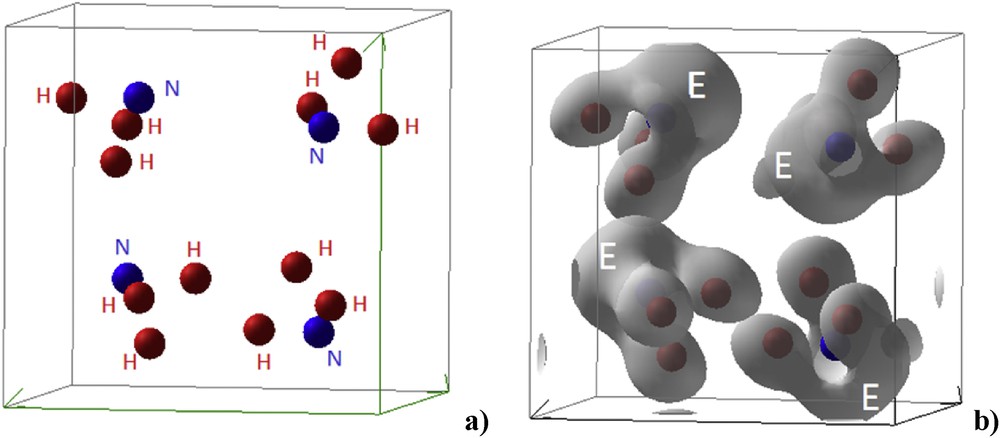
Tetramolecular NH3E structure from ELF calculation reproducing the schematic view in Fig. 1 (a) and the corresponding three-dimensional 3D ELF isosurfaces highlighting E volume development (b).
To refine lone pair localization, precise sections through the electron localization function ELF were of paramount interest in order to define an Ec centroïd position of the electron doublet on one hand, and the volume size of the electronic cloud generated by Ec centered in E on the other hand. For this purpose, electronic localization sections of NH3E–ELF defined by (H–N–H) and (H–N–A3) planes have been realized using dedicated software built by one of us [13]. They are reported in Fig. 3. Red, green and blue areas correspond to strong, free electron gas and zero localizations, respectively. This color scheme is respected in all ELF projections.
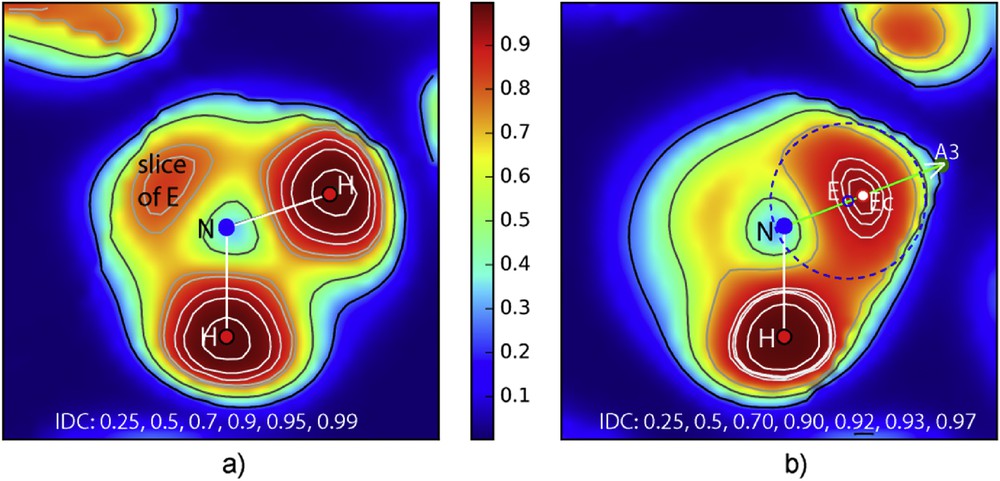
a) Section of the DFT–ELF density by the plane (HNH], one face of the NH3 trigonal pyramid; worthy to note opposite to NH bonds a weak density which is a slice cut in electronic cloud volume of lone pair E. The density around H atoms reaches the maximum value (0.99). b) This second section based on one H and N includes also the A3 rotation axis, showing the huge E lone pair volume. Isodensity curves permit to detect a maximum in E volume, clearly evidenced with its maximum (little red circle). The blue dotted circle delimitates lone pair electronic cloud with its E center (little blue circle).
As expected, the HNH section shows one of the faces of the NH3 trigonal pyramid with N–H = 1.010 Å and the ∠HNH = 109.8°. Therefore, there also appears a slice of the electronic cloud E. Isodensity curves around H atom show in their center their maximum i.e. 0.99.
The following section, which contains the threefold rotation axis of the molecule, reveals precisely the lone pair:
- - the volume of E, spherical with its center onto A3 axis of course delimitated in the vicinity of N atom, is roughly enclosed by the doted blue circle with ϕ = 1.45 Å (rE = 0.73 Å) and even appears bigger than H ions;
- - E isodensity curves more spread out indicate a maximum around 0.97 which is attributed to centroïd Ec (little red circle);
- - like in other cases, the center of E volume (little blue circle) is somewhat displaced towards N (Ec–E = 0.14 Å);
Then, NH3E shows the classical geometry where H and E define a tetrahedral geometry including N atoms as represented in (Fig. 4 left), where N and E are shown with radii, rN ∼ 0.38 Å and rE = 0.73 Å, the hydrogen atoms being a smaller size for the sake of clear representation. This drawing shows that E sitting above the N–H bonds has an electrostatic potential perturbing the NH bond: i) by eventually expanding NH by LP–BP repulsion and/or lowering the ∠HNH angle; ii) by acting simultaneously on NH bonding electrons and H atoms therefore with different repulsive forces then bending NH bond.
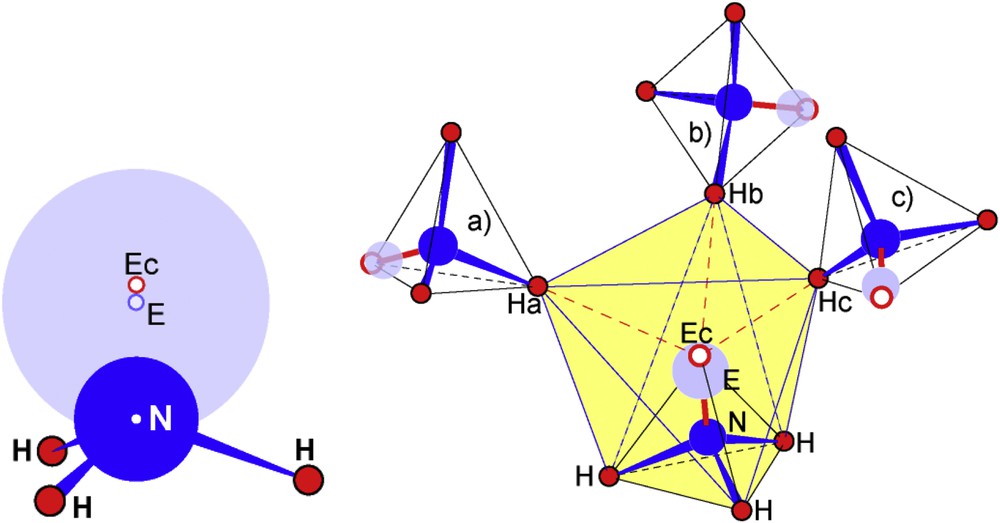
Schematic drawing of the NH3E molecule (left hand side) and immediate surroundings of NH3E by three other molecules (a, b, c) making a large N4 tetrahedron (right hand side). Hydrogen atoms Ha, Hb and Hc build a distorted triangular antiprism with the ones of the base of the trigonal MH3E (shaded in yellow) encapsulating the unit NEEc.
Fig. 4 (right) shows that three other NH3E molecules surrounding each NH3E, one hydrogen of each (Ha, Hb, and Hc) designing with the base of the former molecule, a distorted trigonal antiprism. Nitrogen and its lone pair E appear encapsulated in an H octahedron shaded in yellow in Fig. 4; pertinent distances are given in Table 1. This description is in agreement with the fact that E, the center of the electronic cloud which is largely bigger than an Ec electron doublet, is sensible to Ha,b,c repulsive effect. Consequently it is slightly pushed towards N; then a short Ec–E distance has been noticed: 0.14 Å.
3 NOFE or [NOE]+F-, nitrosyl fluoride
Nitrosyl fluoride was prepared by the interaction of NO with KF leading to the oxyfluoride NOF [14]. Then it was solidified below 150 K, re-crystallized and a single crystal maintained at 123 K for X-ray data collection. The NOF crystal structure belongs to an orthorhombic system. The crystallographic data are provided in Table 2.
NOFE crystal and DFT data [14].
| NOFE – Orthorhombic, space group P212121 (N°19), T = 123 K. | |||||||
| a (Å) | b (Å) | c (Å) | V (Å3) | Z | V(O,F,E) (Å3) | ||
| 4.1099 | 4.3910 | 10.202 | 184.11 | 4 | 15.3 | ||
| 4.1838 | 4.4310 | 10.4134 | 193.05 | 4 | 16.1 | ||
| Interatomic distances (Å) and angles (°) – crystal. | |||||||
| N–F | 1.651 | OׄׄׄO in ils | 3.159 | ∠ONF | 109.7 | ||
| N–O | 1.084 | OׄׄׄF in ils | 3.308 | ∠ONE | 134.2 | ||
| O–F | 2.260 | ∠FNE | 116.0 | ||||
| N–E | 0.65 | E–O | 1.61 | E–F | 2.02 | ||
| E–Fa | 2.52 | E–Ea,Eb | 2.92 | E–Fb,c | 3.01 | ||
| ils: inter layer space | |||||||
| Data from DFT-ELF analyses | |||||||
| N-F | 1.639 | N–E | 0.66 | E-O | 1.66 | ∠ONF | 109 |
| N-O | 1.139 | N–Ec | 0.70 | E-F | 2.02 | ∠ONE | 134 |
| O-F | 2.293 | Ec–E | 0.13 | rE | 0.78 | ∠FNE | 117 |
| E ellipsoid parameters of: a = 0.75 Å, b = 0.67 Å, c = 0.97 Å |
3.1 Crystal structure
Before drawing the detailed molecular packing of this oxide fluoride, an approximate position of the E lone pair associated with the nitrogen atom and its resulting shape are shown in Fig. 5 (therefore with ultimate values). The figure also shows a perspective view of the crystal network (left hand side) and the sketch of the molecular entity (right hand side).
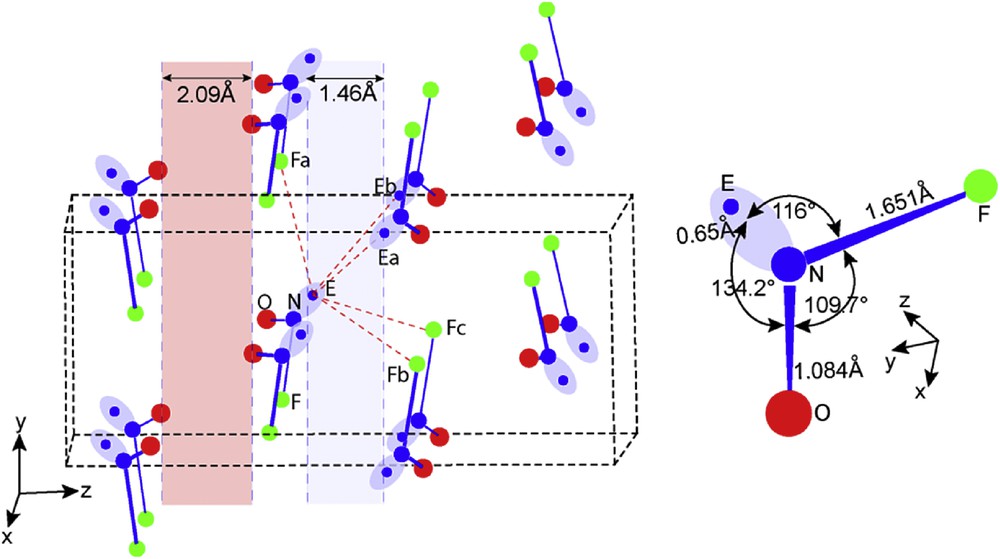
Perspective view of the NOFE crystal framework and NOFE molecule.
The NOFE molecule is a typical triangular molecule M*X2E (Fig. 5 right hand side). The NF bond is longer in NF3E by 0.28 Å and the angle ∠FNO = 109.7° is larger than ∠FNF = 102.2°. Therefore, it was difficult to propose a value for the N–E distance and also for ∠FNE or ∠ONE angles. This problem is solved hereafter by DFT-ELF analyses.
The molecules packed along [100] are set up in planes parallel to (001). They delimitate two empty interlayers spaces (ils), one bordered by lone pairs (1.46 Å) centered at z = 0 and 1/2 (shaded in pale blue color) and the second by oxygen atoms centered in 1/4 and 3/4 (2.09 Å) (pale red color). The lone pairs E directed towards blue ils planes, point to each other making a double layer of lone pairs separating NOF molecules. Interactions EׄׄׄEa,b and EׄׄׄFa,b,c marked by dashed red lines organize the packing of the NOFE molecules along the three directions making a double layer associated by E interactions with F and E in which NOFE molecules are packed and separated by 2.09 Å then associated by Van der Waals bonding.
3.2 ELF calculations
The calculated ELF at high precision is plotted in Fig. 6 along a projection close to Fig. 5 qualitative description. A slice crossing N-O-F is shown in panel a). The dominant blue zone around the NOF moiety clearly highlights the molecular character of NOF. Then within the molecule, red areas around the chemical constituents point to the electron localization and to the chemical bonding between them. Notice however the continuous red areas within NO whereas a discontinuity/separation is clearly observed between N and F. On top of N the red ELF highlights the LP. In panel b) the 3D isosurfaces are shown, highlighting further the LP (E) development. In panel c) at large isosurface values a clear observation of E (N) is exhibited spatially in the form of covering cloud.
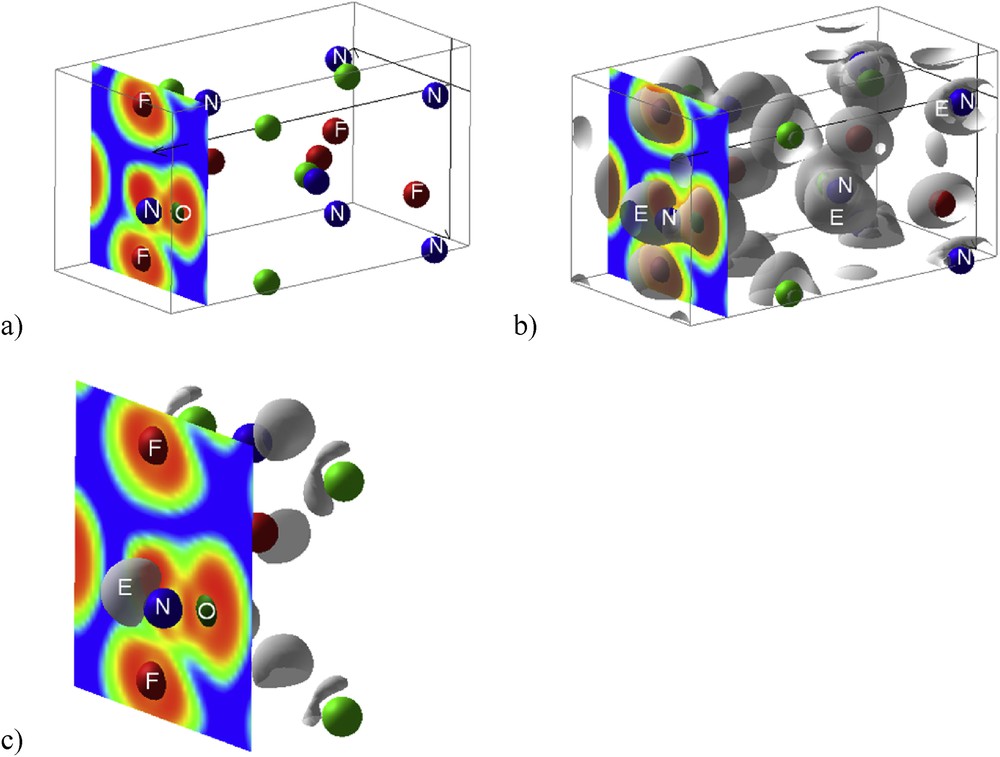
NOF. ELF 2D slice crossing NOF angular molecule (a) and the corresponding 3D ELF isosurfaces, highlighting the E position at N and its spatial development (b) reproducing the schematic view in Fig. 5. Panel c) illustrates further the stereospecificity of E at large isosurface values (0.89).
We now turn to a more precise analysis of the ELF. Sections containing a plane with a NOF molecule and another one perpendicular to it allow appreciating the real chemical nature of this oxide fluoride by showing clearly three zones (Fig. 7 left):
- i) the angular ONF geometry being drawn, a consequent cloud of electronic localization is noticed, opposed to N one sided coordination, which is of course the remarkable trace of the lone pair E completing the triangular geometry of NOFE with N found inside the OEF triangle;
- ii) the NׄׄׄO bond with 1.14 Å magnitude indicates a strong bond intermediate between a triple bond (1.10 Å) a double bond (1.20 Å) and shows in its center a maximum density (∼0.80) slightly blown off towards F side by E repulsive influence;
- iii) then we note that N…F line does not show any electronic concentration, indicating an NׄׄׄF ionic bonding with a large distance of 1.65 Å [18]. Consequently NOFE appears as an ionic molecule with a nitrosyl [NOE]+ cation and [F]− as a counter anion.
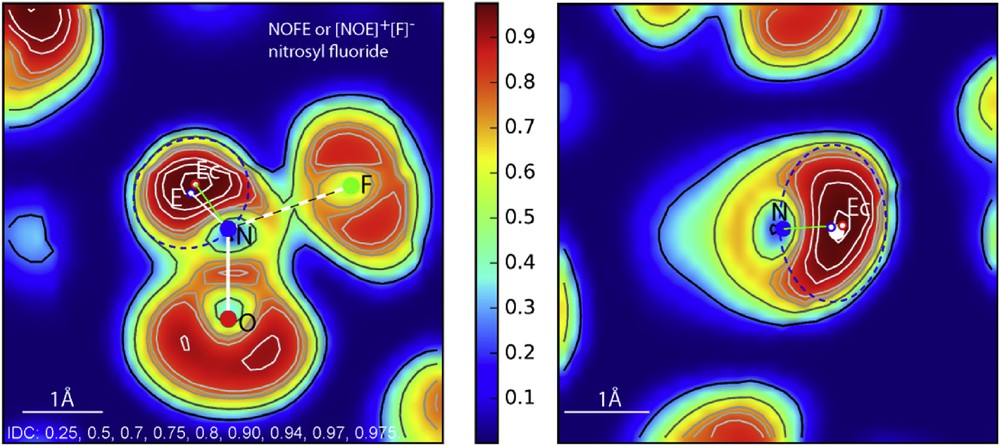
ELF sections of the [NOE]+[F]− molecule in its plane and perpendicular aligned to N–Ec (IDC: iso-density curves). Dotted blue ellipses roughly limit the ellipsoid shapes of E electronic cloud.
Then it was important to analyze in detail the cloud around the lone pair to appreciate its behavior. Isodensity curves show that there is a clear maximum, which is attributed to the presence of Ec centroïd. Alike in all the previous investigations [5,6], Ec generates around it an electronic cloud, the so-called sphere of influence; its E center can be slightly displaced compared to Ec. Therefore, in such a case, there is no symmetry axis favoring spherical geometry; then E is obviously deformed, its volume been assimilated to an ellipsoid, dotted blue traces in Fig. 7 (left) from which the ellipse parameters were deduced: a = 0.75 Å and b = 0.67 Å in the section plane NOF and in the perpendicular plane; the third parameter c = 0.97 Å Fig. 7 (right).
An average sphere of influence for E is derived with rE = 0.78 Å its center being displaced at 0.13 Å from Ec. This analysis provides also the angle values: ∠EcNF = 107°, ∠ENF = 117°, ∠ENO = 134°, ∠ONF = 109°. It is worth noting how F− anion pushes and deforms the E electronic cloud towards NO while encountering a strong repulsive resistance which maintains high ∠ENO = 134° angle. In spite of these repulsive and attractive forces, E electronic cloud, if deformed—attesting to its plasticity—is by no means broken up. Note also that its volume (radius rE = 0.78 Å) is slightly bigger than NH3E one (radius rE = 0.73 Å).
Using this piece of information it was possible to precisely determine the direction and size of nitrogen lone pair associated with crystal network features and to calculate x, y, and z coordinates of E. Data of the [NOE]+[F]− molecule in the crystal structure are given in Table 2 and reported also in Fig 5 (right-hand side).
4 N2O3E2 or [NOE]+[NO2E]− the nitrosyl nitrite
Delicate crystal growth from the liquid around 100 K allowed obtaining single crystals suitable for X-ray analysis. At low temperatures there is a complicated phase transition system which has been described in detail [15]. Crystallographic data are summarized in Table 3.
B N2O3E2 crystal and DFT data [15].
| B N2O3E2 – Orthorhombic, space group P212121 (No. 19), T = 113 K. | |||||||
| a (Å) | b (Å) | c (Å) | V (Å3) | Z | V(O,E) (Å3) | ||
| 5.0686 | 6.4796 | 8.6326 | 283.52 | 4 | 14.2 | ||
| 5.1763 | 6.6028 | 8.8633 | 302.9 | 4 | 15.1 | ||
| Interatomic distances (Å) and angles (°) | |||||||
| N1–O1 | 1.121 | N2–O2 | 1.207 | O2–N2–O3 | 128.6 | N2–N1–O1 | 105.1 |
| O1–O2 | 2.634 | N2–O3 | 1.209 | N1–N2–O2 | 111.9 | ||
| N1–N2 | 1.890 | O2–O3 | 2.176 | N1–N2–O3 | 119.5 | ∠E1N1O1 | 146.0 |
| N1–E | 0.64 | N2–E2 | 0.54 | N2–E2–N1 | 179.4 | ∠E1N1N2 | 108.7 |
| Data from DFT-ELF analyses | |||||||
| N1–Ec1 | 0.67 | N2–Ec2 | 0.58 | ∠O1N1N2 | 107.1 | ||
| N1–E1 | 0.57 | N2–E2 | 0.44 | ∠E1N1O1 | 144.9 | ||
| N1–O1 | 1.159 | N2–O2 | 1.227 | ∠E1N1N2 | 108.0 | ||
| N1–Ec2 | 1.38 | N2–O3 | 1.225 | ||||
| “N1–N2” | 1.958 | O2–O3 | 2.211 | ∠O2N2Ec2 | 111.4 | ||
| rE1 | 0.77 | rE2 | 0.66 | ∠O3N2Ec2 | 119.9 | ||
| Ec1–E1 | 0.10 | Ec2–E2 | 0.13 |
4.1 Crystal structure
Two N2O3 varieties have been well identified, one orthorhombic B, the second tetragonal A. The former cell, orthorhombic, exhibits four independent molecules (Table 3). A schematic drawing of the quasi planar N2O3 molecule according to [15] is given in Fig. 8a. Usually it is expected to have two lone pairs one for each nitrogen, leading to N2O3E2 formula the authors do not mention the lone pair existence, they nevertheless indicate the “extraordinarily long N1N2 bond” and suggest an evolution towards a “hypothetical nitrosyl nitrite” compound.
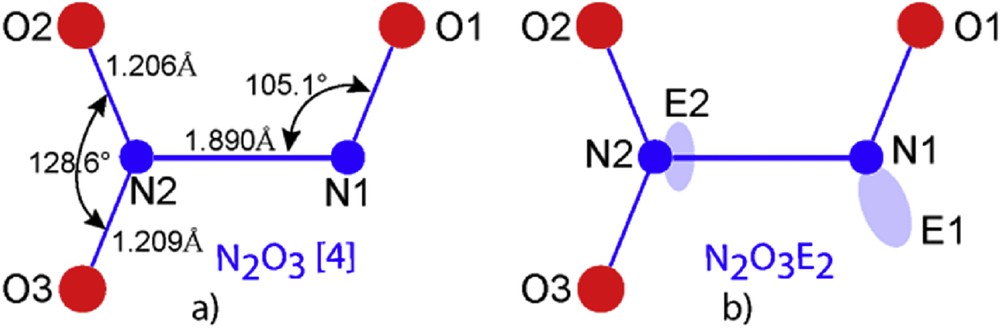
a) N2O3 molecule scheme according to [15]; b) our starting scheme with E1 roughly alike in nitrosyl fluoride and E2 grafted onto N2.
Then a more complete shape was elaborated for the N2O3E2 molecular structure as shown in Fig. 8b, based for N1 coordination on the NOE nitrosyl group well defined in NOFE (see above). For N2 it was more difficult to propose a position for E2 taking into account the established “N2N1 bond”, so, proposals like i) E2 above and below the molecule plane (50% statistically) or ii) delocalization in a torus close to N2 having N2N1 as an axis, were not reliable.
To clear up our view of the nitrogen lone pair problem in the N2O2E2N1OE1 molecular structure pertaining to
- i) their existence;
- ii) their position;
- iii) their volume
- iv) and finally their outstanding role in molecular shape and crystal packing, ab initio calculations within Density Functional Theory (DFT) and Electron Localization Functions (ELF) were realized followed by precise planar sections to show via iso-density curve analyses the details of bonding scheme.
4.2 ELF calculations
Fig. 9 shows the 3D ELF isosurfaces highlighting E volume development on N1 and N2 within nitrosyl NO group and nitrite NO2 motifs, respectively (cf. Table 3).
N2O3: 3D ELF isosurfaces highlighting E volume development on N1 and N2 forming “NO2” and “NO” entities (cf. Table 3).
Starting with the ELF full three dimensional data producing the above Fig. 9, four sections were realized. The full molecule as said above is quasi-planar as shown by both Fig. 10a and c depicted by their iso-density curves (IDCs). In the former section (Fig. 10a), the nitrite group NO2 shows its two short N2O double bonds (2.226 Å) with in their middle their trace define by an IDC around 0.75e−/Å3. But the major indication is the presence of an intense localization, opposite to the oxygen atoms O2 and O3 of nitrite group and right in the direction of N1, clearly showing the site of lone pair E2. There is a maximum density in this area which reaches 0.90e−/Å3, marked by a red circle which could be attributed to the centroïd of lone pair Ec2. Then the whole volume defined by a dotted blue ellipse in this plane corresponds to the electronic cloud generated, so-called in our papers [5,6] the ‘sphere of influence’ of E the lone pair (ellipse parameters: a = 0.57 Å, b = 0.54 Å). To clarify this volume close to an ellipsoid, a section by a vertical plane passing through N2-Ec (Fig. 10b) has been drawn, giving the third parameter (c = 0.93 Å). Then an average spherical volume for E2 is estimated with a radius of rE2 = 0.66 Å.
ELF sections: a) Nitrite group plane N2O2O3; b) perpendicular plane to a) passing via N2-E2; c) nitrosyl group N1O1 + N2, d) perpendicular plane passing via N–E1.
In Fig. 10a the distance N2–E2c is 0.58 Å and shows that the N2N1 direct bond does not exist. It has been demonstrated that these lone pair electron clouds, if they are not compressible, can be deformed by various atomic interactions. In Fig. 10a, NO2 nitrite group ‘wings-like’ N2O2 and N2O3 as well as the presence of the nitrosyl ion, are a barrier to E2 expansion itself strongly associated to its cation. Therefore these constraints leave more freedom in the vertical plane. But an electronic cloud bending towards N2O2 plane is noticed. Then E2 makes a kind of electronic cap on the top of [N2O2E2]− nitrite anion (relevant data are given in Table 3).
To define E1 lone pair the ELF section by N2N1O1 plane shows a large electron cloud whose center, defined as previously, exhibits Ec1 maximum at N1–Ec1 = 0.67 Å with an IDC around 0.96e−/Å3. The E1 cloud appears somewhat distorted in its part pointing towards O3 being elongated up to the line N1N2. Anyhow, one can admit that an ionic bond is established between N1 and Ec2. The sum of the two distances N1-Ec2 = 1.38 Å and Ec2-N2 = 0.58 Å amounts to 1.96 Å, which corresponds to the “long bond N2N1 = 1.958 Å”.
Then the nitrosyl group [NOE]+ is now well defined (data in Table 3) and N2O3E2 appears as a real nitrosyl nitrite [NOE]+[NO2E]− entity which is represented in Fig. 11b and also in its molecular crystal network (Fig. 11a).
Perspective views: a) orthorhombic N2O3E2 network; b) [NOE]+[NO2E]− nitrosyl nitrite molecule (dotted red stick indicates the ionic interaction N1 to Ec2 which firmly associate nitrite triangular unit and angular nitrosyl one).
5 Comparison with N2O4 and NOFE
The nitrosyl nitrite molecule, like N2O4, is quasi planar (small torsion angle ∼3.2° between the two angular and triangular groups) – Fig. 12, therefore by comparison some remarkable differences must be noted showing an E stereochemical role. In N2O3E2 molecule N2O2 and N2O3 bonds are slightly longer, around 0.03 Å, but the ∠O2N2O3 angle is pinched evolving from 134.3° to 128.6°, an effect directly linked to LP–BP repulsion exerted by Ec2 on NO bonding. Note also that the N2-Ec2-N1 long interatomic distance, partly ionic (N1–Ec2), is enlarged up to 1.890 Å compared to the real bond N–N′ = 1.758 Å in N2O4 [16].
Comparison of N2O4, {E1O1N1--E2N2O2} and {EON--F} molecules (ELF data).
Interesting also to compare the NOE nitrosyl part of N2O3E2 with the one of NOFE (Fig. 12) both exhibiting typical angular geometry. N1–E1 and N–E show the same value of ∼0.68 Å but if N1–O1 = 1.159 Å indicating a double bond character in NOFE, NO = 1.084 Å tends to a triple bond. The ionic bonding N1–Ec2 = 1.38 Å is markedly shorter than N–F = 1.651 Å, inducing an inverted conclusion when ∠ENO angle is considered: 144.9° for N1 and 134° for N. This lets suggest that the repulsion of F− anion bigger than the concentrated Ec2 has a more effective impact attached to its size on O and E in spite of being at a larger distance. The same effect touches the ∠ENF and ∠ONF angles considerably enlarged in NOFE (Fig. 12).
Note
It is important to underline for this molecule the phase transition giving at higher temperature a new polymorphic phase A-N2O3E2 crystallizing in tetragonal system space group I41/a with a = b = 16.2557 Å, c = 8.8049 Å, and Z = 32). This large cell exhibits two independent N2O3E2 molecules in asymmetric units, A and B, this last unit showing two conformations B1 and B1′. These molecules are very similar to the one in B–N2O3E2 form with their [NO2E]− nitrite ion, the nitrosyl group [NOE]+ in the B unit flipping between two positions (50% occupancy). The fact that these three forms of N2O3E2 molecules show similar crystallographic parameters (bonds and angles) testifies that the ionic interaction N1–Ec2 underlined above linking up nitrite [N2O2E]− and nitrosyl [N1OE]+ group is well established supporting phase transition with a full molecule dispatching in various positions.
This N1–Ec ionic bonding appears rather unusual because the electronic doublet 2s2 plays the role of an anion like a fluoride for example, well illustrated by [NOE]+F− here above.
To verify if such a possibility exists under other conditions, we have analyzed silver nitrite AgNO2E crystal structure and calculated its ELF.
6 Comparison of silver nitrite AgNO2E with [N2O2E]− [N1OE]+
AgNO2E crystallizes in the orthorhombic system [17]. The data are reported in Table 4.
AgNO2E crystal data [17] and DFT data.
| AgNO2E – Orthorhombic, space group Imm2 (No. 44). | |||||
| a (Å) | b (Å) | c (Å) | V (Å3) | Z | V(Ag,O,E) (Å3) |
| 3.528 | 6.171 | 5.17 | 112.56 | 2 | 14.1 |
| 3.613 | 6.452 | 5.122 | 119.4 | 2 | 14.9 |
| Interatomic distances (Å) and angles (°) | |||||
| N–O | 1.154 | N–Ag | 2.471 | Ag–Oef | 2.425 |
| O–O | 2.074 | Ag–O | 3.153 | ∠ONO | 127.9 |
| N–Oabcd | 3.410 | Ag–Oabcd | 2.732 | ∠OeAgOf | 50.6 |
| N–E | 0.61 | Ag–E | 1.861 | E–Oabcd | 3.077 |
| Data from DFT-ELF analyses | |||||
| N–Ec | 0.62 | N–Ag | 2.240 | Ec–Oabcd | 3.084 |
| N–E | 0.57 | Ag–Ec | 1.620 | rE | 0.68 |
| N–O | 1.266 | Ag–Oef | 2.449 | Ec–E | 0.13 |
| O–O | 2.137 | Ag–Oabcd | 2.837 | ∠ONO | 115.1 |
| N–Oabcd | 3.385 | Ag–O | 3.108 | ∠OeAgOf | 51.7 |
A view of the crystal network is given in Fig. 13. Six nitrite groups NO2E all parallel to the (100) plane are distributed at the apices of an octahedron encapsulating the silver atom. In the equatorial plane four oxygen atoms of four different NO2 groups form the rectangular base of a large square prism on the top of which sit Oe and Of of the NcO2E group. Finally there is an oxygenated hexahedron surrounding Ag with relatively large Ag-O interatomic distances. It is worthy noting that in the [001] direction there is a sixth NO2E group showing an Ag–N distance of 2.471 Å therefore including in between the E lone pair; then deducing that the sixth nitrite group should be linked to Ag by ionic bonding Ag-E.
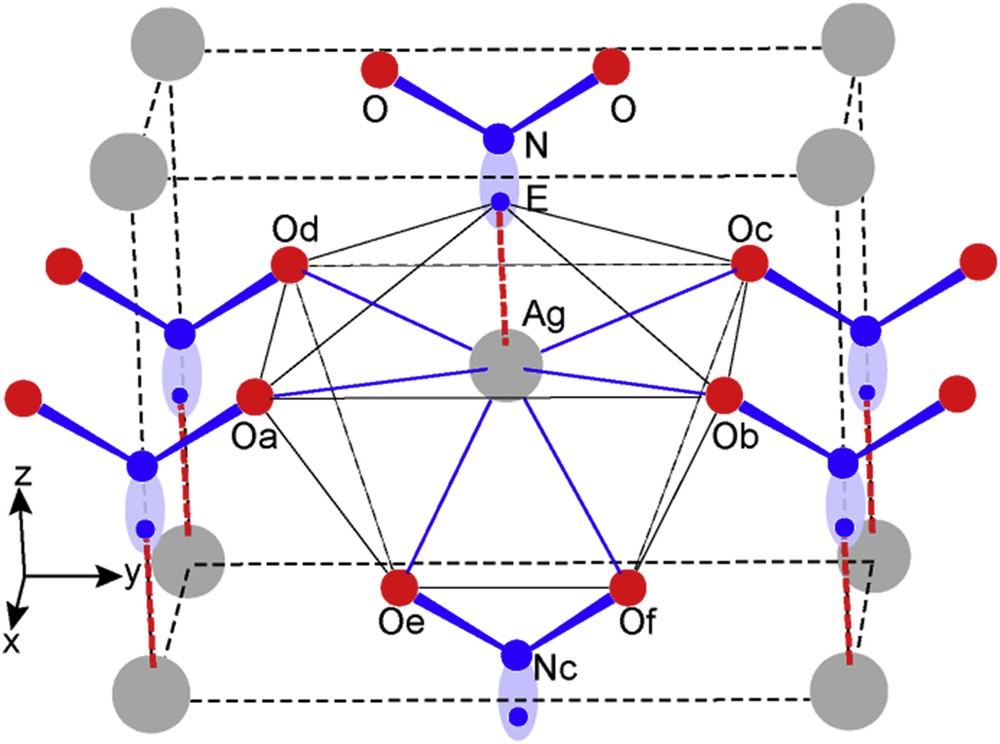
Perspective view of AgNO2E crystal structure.
Consequently calculations were of paramount importance to establish this sequence N–E–Ag by comparison with N2–Ec2–N1 found in N2O3E2. The DFT and ELF resulting data are given in Table 4.
Fig. 14 shows the extended cell of AgNO2 with grey 3D ELF isosurfaces around NO2− nitrite entities, around electropositive Ag alike an alkaline cation characterized by the absence of electron localization (no isosurface). Note the close relationship with the schematic view in Fig. 13.
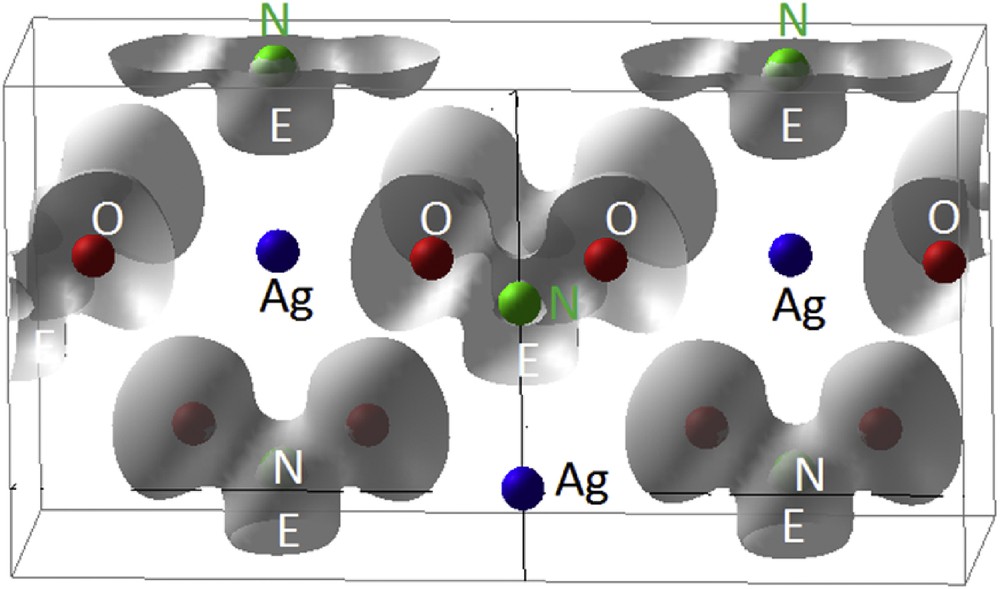
AgNO2. Calculated 3D ELF isosurfaces reproducing the schematic view in Fig. 13.
Two sections were done in the three dimensional ELF, one following the plane formed by N, O and Ag atoms which shows the presence of E, the second perpendicular, including N–E in order to appreciate E extension in the [100] direction (Fig. 15).
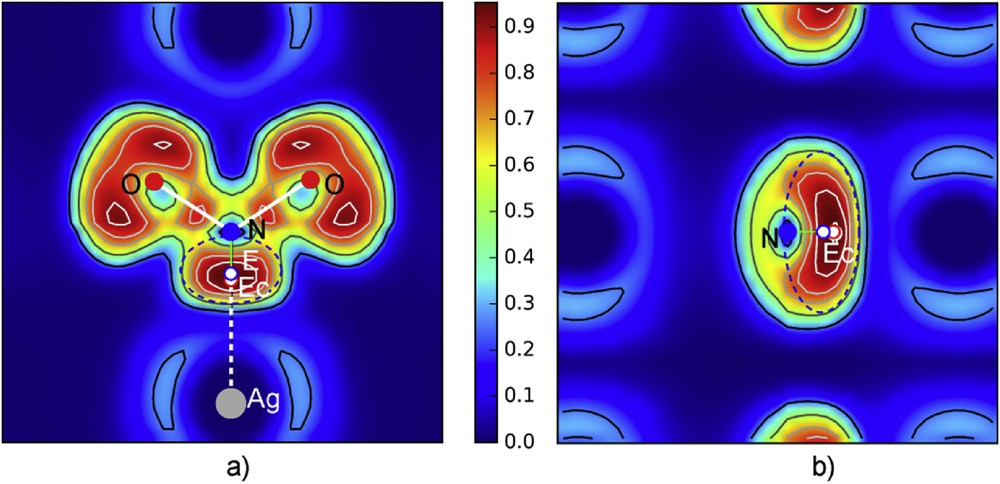
ELF sections: a) section plane containing N, O and silver atoms showing the whole nitrite group with its lone pair E; b) the perpendicular plane passing through N–E.
DFT data show that a and b cell parameters are slightly bigger while c is shorter than for X-ray crystal data. Therefore if Ag–Oef and Ag–Oabcd distances are similar, the distance N–Ag is shorter. E is clearly evidenced in Fig. 15a and b with a density maximum attributed to LP centroïd Ec. N-Ec = 0.62 Å and the generated electron cloud is centered in E at ∼0.13 Å from Ec. Between Ag and Ec, an ionic interaction is established, fixing NO2− on the top of the octahedron (Oef)OabcdE. This bonding shows that Ag–Ec = 1.620 Å and Ec–N = 0.62 Å, corresponding to the distance Ag–N = 2.24 Å. This scheme recalls the one in N2O3E2 even if the distances are bigger.
From these sections an E volume, approximated as an ellipsoid, was evaluated with a = 0.66 Å, b = 0.44 Å, and c = 1.06 Å, grossly corresponding to a sphere of influence rE = 0.68 Å, a value close to the one of E2 in N2O3E2, i.e. rE2 = 0.66 Å.
7 NCl3E
NCl3 is an oily liquid at room temperature, with a yellow color. It crystallizes at low temperature below 233 K. X-ray data have been collected at 148 K as reported in Table 4 [18].
7.1 Crystal structure
The NCl3 crystal network contains three independent NCl3E molecules which are organized in separated layers parallel to the (010) plane centered onto mirror planes in y = 1/4 and 3/4 as shown in Fig 16a (projection along [001]). Their thickness amounts to ΔL = 2.813 Å; the empty space slab showing a Δi = 0.185 Å value. To make a clear drawing of these layers, the one lying along the mirror in y = 1/4 has been isolated; it is reported in Fig. 16b. The three molecules N1Cl3, N2Cl3 and N3Cl3 show a triangular prismatic shape. Then they have the classical NCl3E tetrahedral geometry with their lone pairs opposite their one sided coordination to chlorine atoms. All of them exhibit very similar NCl bonds which evolve between 1.712 Å and 1.786 Å (see Table 4). The molecules N1Cl3E and N2Cl3E appear more condensed via large interactions (dotted lines values evolving from 3.190 Å up to 3.917 Å) in the first half part of the cell along [001]. N3Cl3E molecules assume their interconnection and therefore the stability of the network. It is important to note the chlorine encapsulation of N1E1, N2E2 and N3E3, the former showing a [N1E1]Cl6 octahedron, the next two [N2E2]Cl6 and [N3E3]Cl6 being in triangular prisms more or less distorted. In our search for lone pair size, position and influence of the 2s2 lone pair in this nitrogen trichloride was an interesting prototype to enrich our examples (see Table 5).
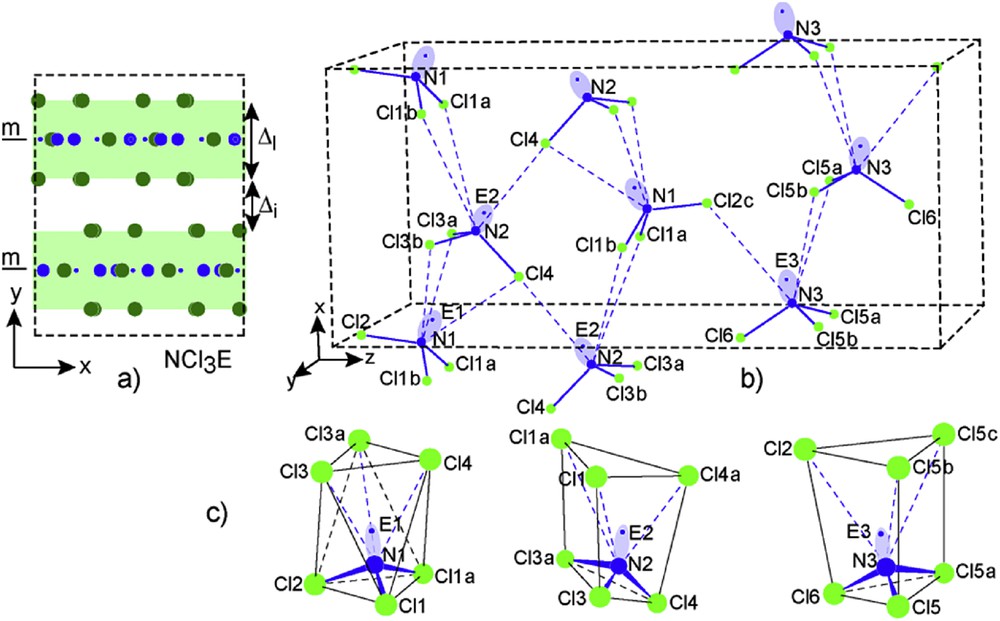
a) View along [001] of the NCl3 network; b) perspective view of the layer parallel to the (010) plane formed by NCl3E molecules and their interactions (dotted blue sticks); c) Coordination chlorine polyhedra around each independent [N1E1], [N2E2] and [N3E3].
NCl3E crystal and DFT data [18].
| NCl3E – Orthorhombic, space group Pnma (No. 62), T = 148 K | |||||||
| a (Å) | b (Å) | c (Å) | V (Å3) | Z | V(Cl,E) (Å3) | ||
| 7.48 | 9.35 | 16.48 | 1152.6 | 12 | 24 | ||
| 7.609 | 9.480 | 16.699 | 1204.6 | 12 | 25.1 | ||
| Interatomic distances (Å) and angles (°) | |||||||
| N1–Cl1a,b | 1.731 | N2–Cl3a,b | 1.786 | N3–Cl5a,b | 1.786 | ∠Cl1a,bN1Cl2 | 107.4 |
| N1–Cl2 | 1.772 | N2–Cl4 | 1.712 | N3–Cl6 | 1.712 | ∠Cl1aN1Cl1b | 109.5 |
| N1–Cl3a,b | 3.298 | N2–Cl1a,b | 3.917 | N3–Cl5a,b | 3.685 | ∠Cl3a,bN2Cl4 | 108.1 |
| N1–Cl4 | 3.360 | N2–Cl4a | 3.190 | N3–Cl2c | 3.631 | ∠Cl3aN2Cl3b | 105.2 |
| ∠Cl5a,bN3Cl6 | 108.5 | ||||||
| N1–E1 | 0.70 | N2–E2 | 0.67 | N3–E3 | 0.69 | ∠Cl5aN3Cl5b | 104.8 |
| E1–Cl3a,3b | 2.70 | E2–Cl1a,1b | 3.48 | E3–Cl5a,5b | 3.12 | ||
| E1–Cl4 | 2.79 | E2–Cl4 | 2.56 | E3–Cl2 | 3.07 | ||
| Data from DFT-ELF analyses | |||||||
| N1–Ec1 | 0.68 | N2–Ec2 | 0.70 | N3–Ec3 | 0.68 | ||
| N1–E1 | 0.55 | N2–E2 | 0.57 | N3–E3 | 0.61 | ||
| N1–Cl1a,b | 1.778 | N2–Cl3a,b | 1.783 | N3–Cl5a,b | 1.781 | ||
| N1–Cl2 | 1.779 | N2–Cl4 | 1.782 | N3–Cl6 | 1.808 | ||
| rE1 | 0.73 | rE2 | 0.76 | rE3 | 0.75 | ||
| ∠Cl1a,bN1Cl2 | 107.9 | ∠Cl3a,bN2Cl4 | 107.7 | ∠Cl5a,bN3Cl6 | 107.3 | ||
| ∠Cl1aN1Cl1b | 107.4 | ∠Cl3aN2Cl3b | 107.1 | ∠Cl5aN3Cl5b | 106.3 |
7.2 ELF calculation
After DFT-ELF calculations, pertinent parameters are shown in Table 4.
Fig. 17 shows the 3D ELF isosurface of NCl3. The projection is presented at high isosurface value of 0.881 for the sake of clarity due to the large number of atoms in the unit cell. E on top of N is clearly shown. At such a high isosurface value, the ELF around Cl is observed as a torus enclosing the non bonded Cl electrons.
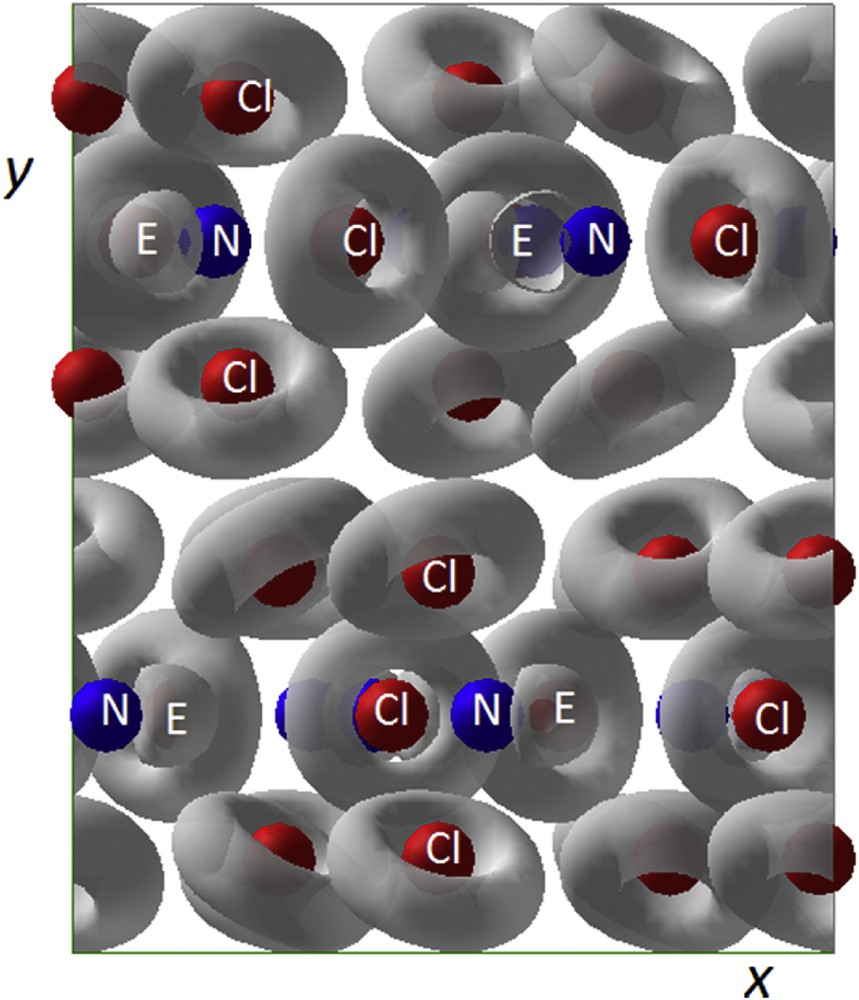
NCl3: 3D ELF view along xOy in a similar fashion to that in Fig. 16a.
Then sections with iso-density curves throughout ELF data were performed right in the mirror plane of each molecule. They are illustrated in Fig. 18. Visibly they show that the three NCl3E molecules are quasi-identical. Therefore they were precisely analyzed in order to determine the position of the lone pair E and eventually if a maximum was detectable to show its maximal density concentration (reasonably its centroïd Ec), the N–Ec distance and assuming an ellipsoid shape, its two parameters a and b in the mirror, the third being determined in Fig. 18b,d,f the perpendicular sections to N–Ec.
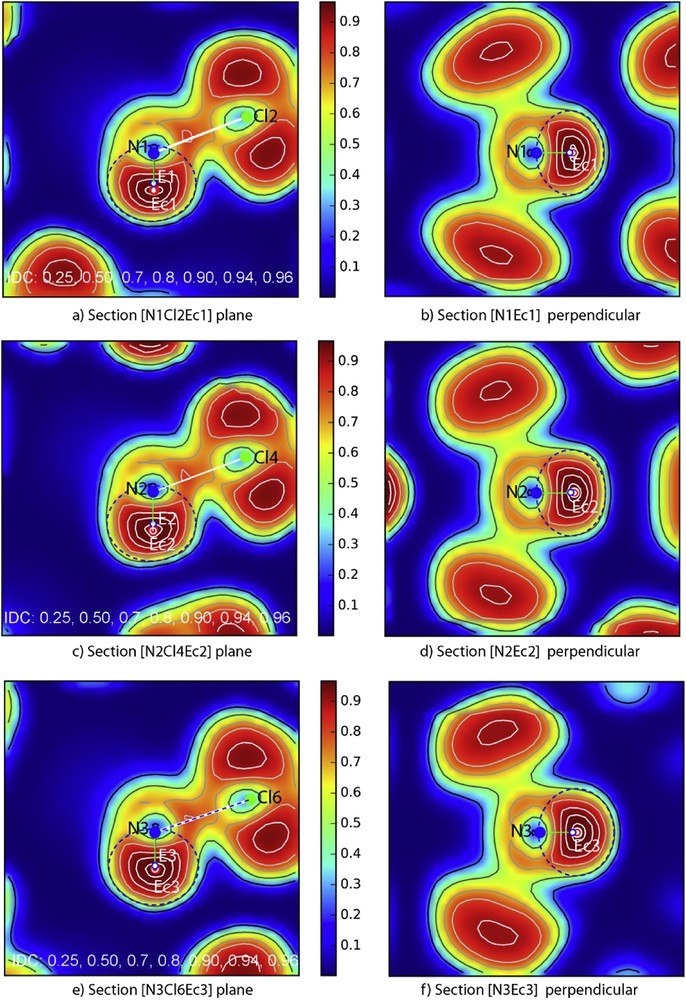
ELF sections: a,c,e) planar sections containing N, Cl and E atoms in the mirror plane of the three independent molecules N1, N2 and N3; b,d,f) the perpendicular plane to N–Ec in Ec for each molecule.
N–Ec distances were readily measured as well as N-Cl ones allowing to determine the crystallographic coordinate of Ec. Then ellipses surrounding the electronic density [N–Ec] were made around each molecule giving the following a/b/c parameters: 0.79/0.67/0.75 Å for [N1–Ec1], 0.81/0.69/0.78 Å for [N2–Ec2] and 0.81/0.68/0.77 Å for [N3–Ec3]. Roughly, they correspond to lone pair spheres of influence with rE1 = 0.73 Å, rE2 = 0.76 Å and rE3 = 0.75 Å. E centers of the ellipsoids, like in the other examples, are slightly off centered from the centroïd Ec of lone pair, their large volume showing a less electronic density than the centroïd Ec, rather well condensed, are more sensitive to the various repulsions of the network surroundings. Therefore it is worth noting the small distance between Ec and E ∼0.12 Å.
From these experiments, an average distance NCl = 2.10 Å to chlorine atoms of triangular prismatic NCl3 molecule base has been extracted and transferred to crystal data to localize E1, E2 and E3 lone pairs by using their coordinates. To control that, their volumes of influence are well set up in [NE] coordination polyhedra, and distances with remaining chlorines were calculated. They show an average value of 3.00 Å, much higher than E–Cl = 2.10 Å, making this insertion acceptable (Table 4).
Therefore, data of the NCl3E crystal structure have been completed (blue printed values) favoring a full understanding of its atomic architecture, the molecules being put together to build layers [NCl3E]n by a cobweb of long NCl weak bonds. The layers packed along [010] are held by Van der Waals interactions.
8 Conclusion
This work was devoted to the formal 2s2 lone pair (LP) behavior in simple fundamental molecules. The aim was to find LP position, to evaluate its “volume of influence” which consists in an electron cloud generated around the centroïd Ec of the electronic doublet. We considered basic molecules formed around nitrogen atom: NH3E ammonia, [NOE]+F− the nitrosyl fluoride, [NOE]+[NO2E]−nitrosyl nitrite (plus AgNO2E silver nitrite) and NCl3E nitrogen trichloride.
Like in our approach of these problems with the 6s2 elements (Tl, Pb, Bi, Po), the LP role in the crystal network architecture is of paramount importance [1–3,5,6]. Using new analytic software, it has been possible to complete electron localization function (ELF/DFT) calculations by making precise sections within three dimensional electron localization which allowed setting up Ec, a small volume of maximum intensity in an E electron cloud.
Ec position was then determined, cloud volume and its center E always with a position slightly distinct from Ec (∼0.12 ± 0.02 Å) and closer to N. The size of the lone pair in all these compounds does not show strong differences: = 0.65 Å, = 0.77 Å and 0.66 Å, = 0.68 Å, = 0.78 Å and = 0.73 Å, = 0.76 Å, and = 0.75 Å.
The determination of the E2 lone pair position in the nitrite group [N1OE1]+[N2O2E2]− of nitrosyl nitrite has evidenced a strong ionic N1–E2 interaction, allowing to understand the stability of the whole molecule even during its crystal structure phase transition, a linear sequence N2–Ec2–N being substituted to the “extraordinary long N2N1 bond (1.890 Å)”. This direct ionic interaction with alone pair centroïd was unexpected; therefore, an analogous situation occurs in AgNO2E, silver nitrite, where Ag is directly online with E of nitrite group.
9 Short annex on the theory framework
It is now established in quantum physics and chemistry that an accurate way to account for exchange and correlation (XC) albeit at the local level, is carried out within the density functional theory (DFT) [7,8]. The first account of XC effects was first approximated with the local density approximation (LDA) [19] scheme based on the homogeneous electron gas. However introducing gradients to the electron density was rapidly needed with the GGA (generalized gradient approximation, used in the present work [20]). The subsequent success of the DFT, in accounting for the physical properties of a broad panel of compounds, led to building many methods around it with different levels of outcomes of electronic and magnetic band structures, chemical bonding properties and other energy related properties as mechanical ones (enthalpies, bulk modules, elastic constants, etc.).
In our work we used the Vienna ab initio simulation package (VASP) code [21,22] to obtain equilibrium crystal structures which are actually close to experimental determination. The purpose is here to subsequently ‘build’ the electron localization around the chemical constituents: i.e. the atoms with their chemical trend to ionization either positively—decrease of localization—or negatively—increase of localization. This can be done through different schemes such as the electron localization indicator (ELI-D) [23] or the electron localization function (ELF) used here [9]. The ELF scheme is based on the kinetic energy in which the Pauli Exclusion Principle is included: ELF = (1 + χσ2)−1 with 0 ≤ ELF ≤ 1, i.e. it is a normalized function. In this expression, the ratio χσ = Dσ/Dσ0, where Dσ = τσ − ∇s − ¼ (∇ρσ)2/ρσ and Dσ° = 3/5 (6π2)2/3 ρσ5/3 correspond, respectively, to a measure of Pauli repulsion (Dσ) of the actual system and to the free electron gas repulsion (Dσ0) and τσ is the kinetic energy density. Then a normalization of the ELF function between 0 (zero localization) and 1 (strong localization) with the value of ½ corresponding to a free electron gas behavior enables analyzing the contour plots following a color code: blue zones for zero localization, red zones for full localization and green zone for ELF = ½, corresponding to a free electron gas. Besides the 2D ELF representation we mainly consider the 3D iso-surfaces enclosing the electrons of each atomic constituent. This paper shows the usefulness of such 3D representations for the discussion of the lone pair development and stereo-activity.
Acknowledgements
Computations were conducted at the MCIA-University of Bordeaux computer centre. JG thanks Pra. Alicia Castro for fruitful scientific partnership between LCTS and ICMM.
Support from CNRS and CSIC is gratefully acknowledged.