

1 Introduction
Phenols are one of the important organic pollutants discharged into environment causing unpleasant taste and odour to drinking water. They are considered as primary pollutants, being harmful to organisms at low concentrations [1]. At high concentrations, phenol is a toxic and mutagenic substance that may be absorbed even through the skin. The major sources of phenols anthropogenic inputs into the aquatic environment are wastewaters coming from: production of resins, herbicides, pharmaceutical products, colorants, paints, coal conversion, petroleum and petrochemical industries, etc. One of the most important applications of phenol is its use as an intermediate in the production of phenolic resins. It is also applied in the production of caprolactam (used to the manufacture of nylon 6 and other synthetic fibers) and bisphenol A (manufacture of epoxy resins) [2]. According to the Colombian standards for water quality (NTC-813-2010), the maximum permissible value for phenol in drinking water is 0.001 ppm and along with European Union (EU) directive states, it is of 0.5 ppb (80/778/EC). Consequently, considerable efforts have been devoted to develop a suitable purification method that can easily destroy these bio-recalcitrant organic contaminants. However, the application of conventional methods (activated carbon adsorption, membrane filtration, chemical coagulation purification systems, ion exchange on synthetic adsorbent resins, etc.) also generates wastes whose treatment requires additional steps and costs.
In recent years, the heterogeneous photocatalytic oxidation processes, employing TiO2 and UV radiation, have emerged as a promising alternative for the degradation of persistent organic pollutants, producing more biologically degradable and less toxic substances [1,2]. The photocatalytic phenol oxidation is initiated by the absorption of the photon with energy equal to or higher than the band gap of TiO2, producing an electron–hole pair on its surface. Next, a photogenerated electron is promoted to the conduction band while a positive hole is formed in the valence band. Excited state electrons and holes can recombine and dissipate the input energy as heat, get trapped in metastable surface states, or react with electron donors and electron acceptors adsorbed on the semiconductor surface or within the surrounding electrical double layer of the charged particles [1]. After the reaction with water, these holes can produce hydroxyl radicals with high redox oxidizing potential. The main reaction site for phenol destruction is bulk liquid, where the attack of hydroxyl radicals on the carbon rings results in the formation of various oxidation intermediates [2]. Hydroquinone, catechol, and p-benzoquinone are reported as the most frequently formed intermediates [2]. Moreover, chloro-hydroquinone, 4-chlorocatechol and resorcinol can be converted to acetylene, maleic acid, carbon monoxide and carbon dioxide.
TiO2 (Degussa P-25) is the most widely used photocatalyst since it presents high activity under UV radiation, biological and chemical non-toxicity, stability, availability and low cost. However, its photo-response under visible light is not so efficient, since only 3–5% of the solar spectrum is in the UV range. Moreover, its photocatalytic properties can be limited by stabilization of the charge photocarriers in the bulk of the material, by fast charge recombination either in the bulk or at the surface of the oxide and/or by its relatively large band gap [3]. Several strategies have been used to reduce electron–hole recombination rates and to increase photocatalytic efficiency of TiO2 under visible light, among them doping/loading with metal [2,4] or non-metal [5,6] ions. Recently, a number of papers have been published focusing on the photo-degradation of phenolic compounds [1,7]. A lot of them were related to the application of TiO2 as photocatalyst [7,8]. In the light of the reviewed researches, one can see that the comparison among the results reported in the literature is extremely difficult since conditions (such as: initial pH of solution, type and concentration of used oxidation agent, wavelength light irradiation, reactor geometric configuration, catalyst loading, etc.) at which the experiments were carried out, were very different. Moreover, the origin and the crystalline structure of TiO2, affecting its electronic and physicochemical properties, also strongly influence its photoactivity [2,8]. When doped TiO2 was applied as a catalyst, the preparation methods and metal loading used by different researches for the catalysts synthesis were usually different [1,2]. All these factors can be the origin of the discrepancies found in the literature when dealing with TiO2 loaded materials. Therefore, the application of the same bare TiO2 as the starting material, its subsequent modification with metals using the same procedure, and finally their evaluation under the same experimental conditions can be considered as an alternative to assess their real effect on TiO2 properties and photoactivity.
This paper presents the results of phenol photo-degradation under both UV radiation and visible light, using TiO2 (Degussa P-25) and TiO2 loaded with some transition metal ions (cobalt, copper, iron, and molybdenum). The samples were prepared by the wet impregnation method. Their characterization was carried out performing thermal analysis (TG-DTA-MS), N2 physisorption (BET), scanning electron microscopy (SEM–EDS), atomic absorption spectroscopy (AAS), X-ray diffraction (XRD), Raman spectroscopy (RS), diffuse reflectance spectroscopy (DRS), and measuring their zero point charge (ZPC). The aim of this work was to understand the role of various structural, morphological, physicochemical and optical properties and to evaluate their relative effect on photocatalytic activity in phenol degradation (batch system). Thus, from the group of four transition metals, the most promising (active) one was selected and its loading was optimized.
2 Experimental
2.1 Materials
Commercial TiO2 (Degussa P-25, purity > 99%), iron (III) nitrate 9-hydrate (Fe(NO3)3·9H2O, PanReac, purity ≥ 98%), cobalt (II) nitrate 6-hydrate (Co(NO3)2·6H2O, PanReac, purity ≥ 98%), copper (II) nitrate 3-hydrate (Cu(NO3)2·3H2O, PanReac, purity ≥ 98%), and ammonium molybdate 4-hydrate [(NH4)6Mo7O24·4H2O, purity ≥ 99%] were used as starting materials. First, transition metal loaded TiO2 (M/TiO2), with a metal nominal content of 1 wt%, were prepared by incipient wet impregnation method. Next, the series of catalysts containing 0.5–5 wt% of the most promising metal was synthesized, using the same method. Each time, the desired amount of corresponding metal precursor was dissolved in deionized water and next TiO2 (Degussa P-25) was added. After stirring at room temperature for 24 h, the solvent was evaporated under reduced pressure (100 mbar) at 75 °C. The as-prepared catalyst precursors were dried in an oven at 100 °C for 12 h and calcined at 500 °C for 6 h, according to TG-DTA-MS analysis (not shown here, in details described in [9]).
2.2 Characterization methods
X-ray diffraction (XRD) patterns were obtained at room temperature using a Rigaku, Miniflex II diffractometer, operating at 30 kV and 15 mA (Cu Kα radiation, λ = 1.540562 Å). Data were collected in the range of 20–90° 2θ, with a step size of 0.01678 and step time of 10 s. The standard diffraction data from JCPDS files of anatase (No. 21-1272) and rutile (No. 21-1276) were used to identify phase composition. The particle size (Dhkl) was estimated from the width of the principal diffraction peak (101) of anatase phase using the Scherrer equation:
| (1) |
| (2) |
considering the interplanar spacing (Dhkl), the distance between adjacent planes in the set (hkl), can be determined using the Bragg Law:
| (3) |
The cell volume (tetragonal one) was determined as follows:
| (4) |
Finally, the anatase and rutile fractions were determined by Eq. (5) where IA and IR are the integrated intensities of the most intense peaks of anatase (101) and rutile (110) phases:
| (5) |
Scanning electron microscopy (SEM) measurements were performed by S-4700 microscope (Hitachi, Japan) coupled with energy dispersive spectrometer (EDS) (Thermo Noran, USA) at an acceleration voltage of 25 kV. Images were recorded at several magnifications. The content of elements in the studied micro-area of the oxide surface layer was determined by the EDS method, based on the obtained characteristic X-ray spectra. In order to reduce the charge build-up on the samples, they were placed on carbon plasters in a holder and before analyzing were coated with a carbon monolayer.
Raman spectroscopy was performed by a Raman spectrometer (model T-64000, Jobin-Yvon) coupled with microscope (Olympus BX-40), using three grids (3 × 1800 grove/mm). The system offers spectral resolution of 1 cm−1 for exciting line of 514.5 nm and spatial definition lower than 1 μm on the sample surface. The measurements were carried out at opened confocal diaphragm, long focal distance with 50 times magnification and numerical aperture NA = 0.5. Each time, the signal was collected from area with a diameter of ca. 4–5 μm. The time of measurement was adjusted to obtain a spectrum characterized by sufficient signal-to-noise ratio for the correct mathematical analysis (deconvolution). Several independent spectra for each sample were collected (between 3 and 7). The deconvolutions of the spectra have been carried out using PeakFit software (version 4.0, Jandel).
Atomic absorption spectroscopy (AAS) analyses were performed with a Solaar M6 Unicam spectrometer in order to estimate the amount of metal loaded on TiO2. Initially, the microwave digestions of the analyzed samples were carried out in aqua regia (3 cm3 + 100 mg of the sample), using microwave oven MLS-1200 MEGA (Milestone). The obtained solutions were placed in measuring flasks and diluted with 100 cm3 of deionised water. A blank test was prepared in the similar way.
Nitrogen adsorption-desorption isotherms were measured at –196 °C using Micromeritics ASAP 2010 apparatus (Carlo Erba). Prior to the measurements, the samples were degassed for 4 h at either 300 °C (M/TiO2) or 100 °C (TiO2). The specific surface area (SBET) was calculated using BET equation. The pore size, their distribution and the pore volume were estimated using the Barret–Joyner–Halenda (BJH) method.
Zero point charge (ZPC) of studied powders was determined by mass titration (MT) method [10,11]. It involves finding the limiting pH value of catalyst/water slurry, as the catalyst content is constantly increased. Different amounts of powders were added to deionized water in the following weight ratios: 0.1, 1, 5, 10, and 20%. The resulting pH values were measured after 24 h of equilibrium, at room temperature.
UV–VIS diffuse reflectance spectra (DRS) were recorded by a PerkinElmer Lambda 20 UV–VIS spectrophotometer coupled with a diffused reflectance sphere, in the range of 190–800 nm at 240 nm/min, in order to determine the band gap of the studied samples. UV–VIS diffused reflectance spectra (DRS) were transformed to F(R) using the Kubelka–Munk expression, Eq. (6). To establish the type of band-to-band transition in the synthesized powders, the absorption spectra were fitted to equations for indirect band gap transitions. Next, the Tauc plot: [F(R)·hν]1/2 vs. photon energy, hν, Eq. (7), was done. Finally, the band gap values were obtained extrapolating the linear part of the plot [F(R)·hν]1/2 vs. photon energy, Eq. (8), assuming the porous samples as indirect crystalline semiconductors [5,12]:
| (6) |
| (7) |
| (8) |
Phenol photocatalytic degradation tests were carried out in a Pyrex batch cylindrical reactor containing ca. 120 mL of an aqueous phenol solution (20 ppm), with a pH of 5 (natural pH), and TiO2 (as received, without any further treatment) or M/TiO2 catalyst (0.5 g/L). Air was continuously bubbled (10 mL/s) to the agitated solution (350 rpm). In order to distinguish the loss of phenol through adsorption phenomena from the oxidative photo-degradation, each time, the corresponding catalyst suspension was constantly stirred for 30 min in the darkness before irradiation. Next, 1 mL of the sample was taken and the initial concentration of phenol was determined (C0). Thus, it was assumed that independently of the studied catalyst (its ZPC) and its phenol adsorption capacity, the C0 value, taken after 30 min in the darkness, was the initial phenol concentration in the solution. Subsequently, a corresponding lamp used as a source of UV radiation or visible light was introduced into the reactor. Therefore, a black light tubular lamp (maximum light intensity at λ = 365 nm, 15 mm of diameter, 265 mm of length, model F8T5/BL Philips, 8 W, photon flux of 1.47 × 10¹⁹ 1/m2/s, radiant flux of 0.58 mW/cm2) or day light tubular lamp (maximum light intensity at λ = 470 nm, 15 mm of diameter, 265 mm of length, model F8T5/D Philips, 8 W, photon flux of 1.89 × 10¹⁹ 1/m2/s, radiant flux of 0.74 mW/cm2) was applied. The reaction was kept running for 2 h at room temperature (25 °C). Each time, 1 mL samples were taken at intervals of 15 or 30 min. The evolution of phenol concentration was followed by high-pressure liquid chromatography (HPLC). A HPLC-UV, AGILENT, was used with the following parameters: mobile phase: acetonitrile–water–acetic acid (36:60:4), flow: 0.8 mL/min, lamp: tungsten–deuterium, column: ECLIPSEXDB-C18-5 mm, and retention time: 10 min. The percentage of phenol degradation (% Deg) was calculated after 120 min of reaction as follows:
| (9) |
3 Results and discussion
3.1 Physicochemical properties and catalytic performance of M/TiO2 catalysts
Table 1 reports the results of AAS, SBET, ZPC and Band gap determined for TiO2 and M/TiO2 catalysts.
Characterization of TiO2 and M/TiO2 catalysts.
| Catalyst | Real metal content (%)a | SBET (m2/g)b | Vp (cm3/g)b | Dp (nm)b | ZPCc | Band gap (eV)d |
| TiO2 | – | 57 | 0.429 | 37.5 | 6.6 | 3.09 |
| Co/TiO2 | 1.02 | 55.5 | 0.185 | 15.2 | 7.3 | 3.05 |
| Cu/TiO2 | 0.98 | 56.2 | 0.406 | 20.8 | 7.1 | 3.00 |
| Fe/TiO2 | 1.05 | 56.9 | 0.420 | 29.0 | 6.9 | 2.85 |
| Mo/TiO2 | 0.99 | 56.1 | 0.430 | 37.6 | 6.0 | 2.90 |
a Determined by AAS.
b Determined by N2-BET.
c Determined by MT.
d Determined by UV–VIS DRS.
For all M/TiO2 samples, the real metal content was very close to the nominal one (1 wt%). Fig. 1 shows the representative N2 adsorption-desorption isotherms of TiO2 and M/TiO2 catalysts. All five analyzed samples showed type IV isotherms, according to the IUPAC classification, with hysteresis loops (type A, according to de Boer, or H1) typical of mesoporous materials. The hysteresis loop is associated with the capillary condensation taking place in the mesopores signifying the preservation of the mesoporous structure even after calcination at elevated temperature. The type A hysteresis loop is attributed to the cylindrical shaped pores. A typical pore size distribution for all studied catalysts is included in Fig. 1. All samples exhibit a uninodal pore size distribution.
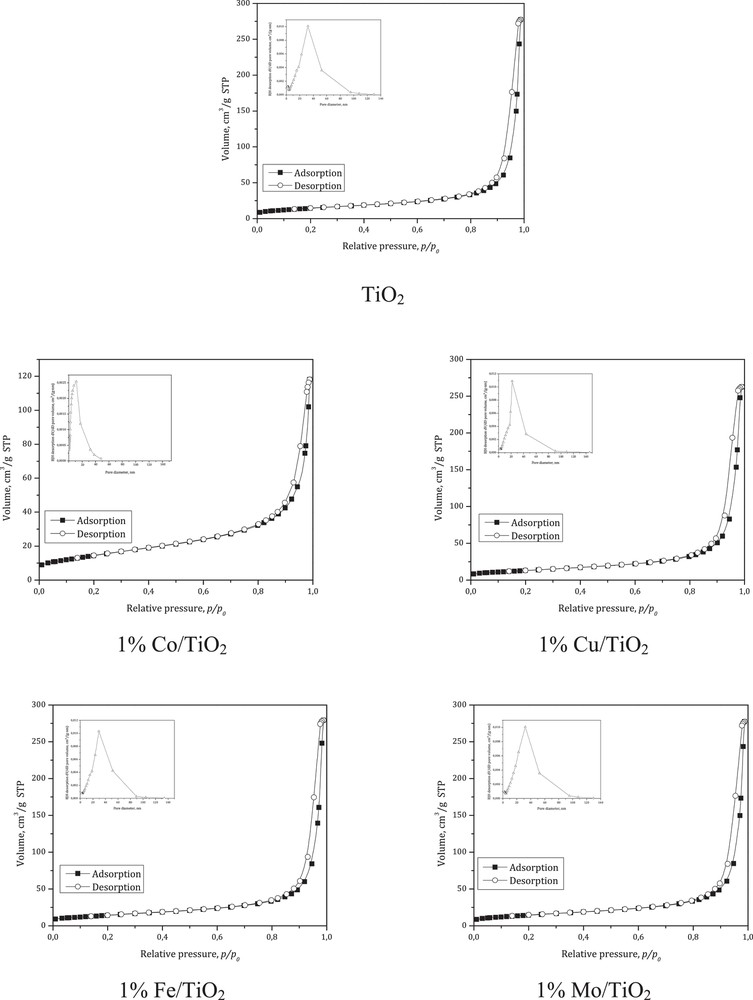
The representative N2 physisorption isotherm and BJH pore size distribution of TiO2 and M/TiO2 catalysts.
One can see that the SBET of M/TiO2 catalysts were very similar to that of TiO2 (57 m2/g). However, impregnation of TiO2 with Fe, Cu and Co species reduced its mean pore size diameter (22.7%, 44.5%, and 59.5%, respectively). We assume that some obstruction of TiO2 pores by metal oxidic species can take place, considering that TiO2 impregnation with metal ions consists of their interactions with the support, by physical and/or chemical adsorption, decomposition and oxidation during calcination process. On the other hand, the mean pore size diameter of Mo/TiO2 was very similar to that of TiO2.
The ZPC represents the value of pH at which the coverage of catalyst surface with H+ equals that with OH− (zero net surface charge), taking into account both the acidic and basic sites. It allows determining both the propensity of the catalyst surface to be charged either positively or negatively, as a function of the pH, and its capacity to the ion exchange with contaminant present in the solution. The ZPC of TiO2, determined experimentally in this study, was 6.6. The impregnation of TiO2 with Fe, Cu, and Co species led to the shift of its ZPC to more basic values (Table 1). It could be related to the presence of different metal oxides (FexOy, CuxOy, CoxOy) on TiO2 surface, characterized by a lesser acid nature than that of titania. On the other hand, for Mo/TiO2 system, the ZPC showed a more acidic character than that of the support, indicating surface enrichment with the species characterized with an acidic behavior, such as MoxOy.
The determined band gap of TiO2 equaled 3.09. This value is very close to that reported in the literature (3.01 eV) for TiO2–Degussa P-25 [13]. The impregnation of TiO2 with metal species reduced its band gap, showing a red shift into lower eV (Table 1). The highest red shift was observed for Fe/TiO2 catalyst. The effect of metal presence on TiO2 band gap reduction can be attributed to:
- • the charge-transfer transitions between the metal ion d electrons and the TiO2 conduction or valence band;
- • the generation of impurity levels in the band gap of TiO2; if these states lie close to the band edges, they can overlap band states, narrowing its band gap [14];
- • the creation of allowed energy states in the band gap of TiO2, as a consequence of the presence of segregated MxOy clusters on its surface [15], that can induce photoactive transitions in visible light, due to an excitation of an electron from this energy level into the TiO2 conduction band. Therefore, the presence of metal species can affect TiO2 photoactivity altering the electron–hole pair recombination rate.
SEM–EDS micrographs of TiO2 and M/TiO2 catalysts are presented in Fig. 2 and Appendix 1. They do not reveal any significant differences in the morphology of TiO2 and M/TiO2 catalysts. All samples were characterized with the presence of aggregates with irregular shapes and sizes in the range of 3.5–30 μm. The following order of average size of catalysts agglomerates, depending on the supported metal, was observed: Co/TiO2 (5 μm) < Mo/TiO2 (8 μm) < Cu/TiO2 (10 μm) < Fe/TiO2 (15 μm) < TiO2 (30 μm). One can see that the presence of metal prevents TiO2 particles agglomeration probably due to the change in the surface charge of the catalysts. It is important since big aggregates can be detrimental to photocatalytic activity, being hidden for light absorption. For all samples, the presence of uniformly distributed metals was confirmed by EDS measurements.
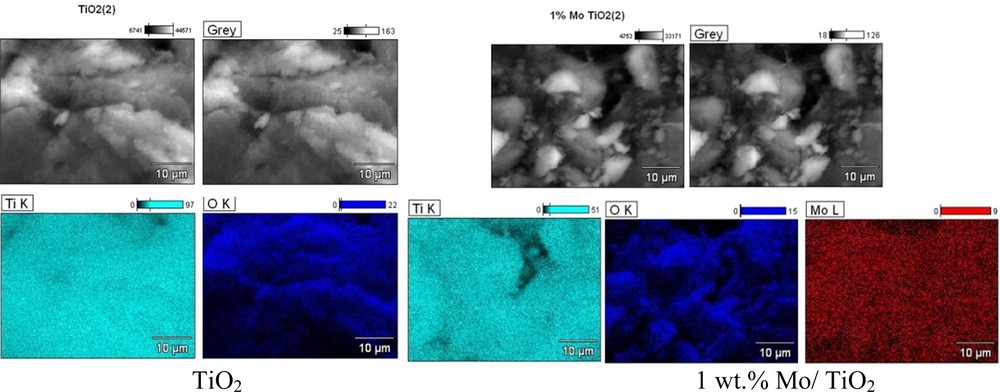
(Color online.) Back-scattered electron (BSE) photomicrographs and EDS maps of TiO2 and 1 wt% Mo/TiO2 catalysts (Magnification: × 2500).
The XRD pattern of TiO2 (not shown here) corresponded to the mixture of anatase and rutile crystalline phases, in the ratio of ca. 5.6:1, respectively. The anatase to rutile ratio was determined using areas of the most intense diffraction peaks corresponding to anatase (2θ = 25.3, 37.8 and 48.0) and rutile (2θ = 27.4, 36.1 and 54.3) crystalline phases of titania [11]. The diffraction patterns of M/TiO2 catalysts were very similar to that of TiO2 (not shown here). No clear metal and/or metal oxides reflections were observed. It could be related to:
- • the overlapping peaks descended from anatase/rutile phases with these suitable for metal phases;
- • relatively low metal content (1 wt%) and its uniform distribution on the TiO2 surface;
- • and/or the amorphous nature of the metals.
Table 2 presents the average crystallite size, lattice parameters (a, b, c, and dhkl) and anatase to rutile ratio for TiO2 and M/TiO2 catalysts. The lattice parameters for M/TiO2 systems are very close to those of TiO2, suggesting good dispersion of metal species on the TiO2 surface and/or on a few top layers of TiO2 particles. Moreover, the average crystallite size of all M/TiO2 catalysts was similar to that of TiO2. Finally, the following order of anatase to rutile ratio was found: Cu/TiO2 < Co/TiO2 < Mo/TiO2 < TiO2 < Fe/TiO2, suggesting that Cu, Co and Mo can act as promoters of anatase to rutile phase transformation, while Fe can be its inhibitor. In order to determine if the observed changes in anatase/rutile ratio and crystallite size are attributed to the presence of metals on TiO2 surface, the XRD studies of thermally treated TiO2 (dried and calcined as catalysts) were performed. The slight effect of temperature on both anatase/rutile ratio and crystallite size was observed (Table 2).
The average crystallite size, lattice parameters, and anatase to rutile ratio of TiO2 and M/TiO2 catalysts.
| Catalyst | dhkl (Å) | a = b (Å) | c (Å) | Cell volume (Å3) | Crystallite size (nm) | Anatase fraction | Anatase/rutile ratio |
| TiO2 (as received) | 3.5 | 3.8 | 9.8 | 141.5 | 20.7 | 85.0% | 5.6 |
| Co/TiO2 | 3.5 | 3.8 | 9.2 | 132.8 | 20.0 | 83.3% | 5.0 |
| Cu/TiO2 | 3.5 | 3.8 | 9.5 | 137.2 | 21.0 | 81.3% | 4.3 |
| Fe/TiO2 | 3.5 | 3.8 | 9.3 | 134.3 | 18.9 | 85.6% | 6.0 |
| Mo/TiO2 | 3.5 | 3.8 | 9.4 | 135.7 | 20.6 | 83.7% | 5.1 |
| TiO2 (calcined) | 3.5 | 3.8 | 9.8 | 141.5 | 20.3 | 84.0% | 5.3 |
In the absence of dopants or impurities, the sufficient thermal energy required to anatase to rutile phase transformation can be reached at ca. 700 °C [16]. Various cationic dopants have been studied in terms of their effect on the kinetics of the anatase to rutile transition. It was concluded that cations characterized by small radii and low valence (< 4) accelerate the transition to rutile due to the increase in oxygen vacancies that result from the assumed substitution of Ti4+ ions with cations of lower valences. On the other hand, when cations of high valence (> 4) are assumed to substitute the Ti ions in the anatase lattice, this gives rise to the annihilation of existing oxygen vacancies and the formation of Ti interstitials of the same or lower valence. These processes can be viewed in light of the inertia to alteration (through ionic transport) of the relatively large and rigid oxygen sublattice, which largely determines the structural stability and the capacity to reorganize the chemical bonds to form rutile. According to the literature, Co, Cu [16] and Mo [17] have already been reported as promoters and Fe [16] as an inhibitor of anatase to rutile phase transformation.
Fig. 3 presents Raman spectra of TiO2 and M/TiO2 systems. For TiO2, the peaks centred at 143, 199, 396, 514 and 636 cm−1 correspond to its anatase crystalline phase, while these located at 235, 443, 608 and 826 cm−1 are characteristic of the rutile one. These peaks can be also observed in the spectra of M/TiO2 catalysts.
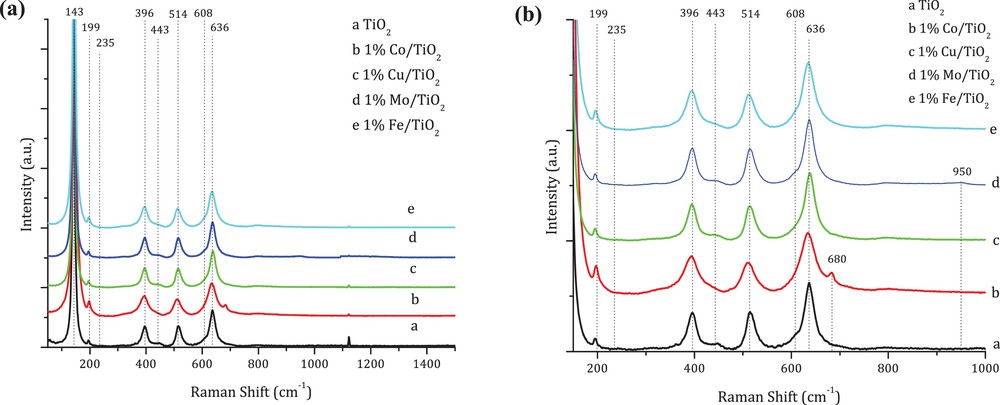
Representative Raman spectra for TiO2 and M/TiO2, (a) 50–1400 cm−1; (b) 200–1000 cm−1 (enlarged view of Fig. 3a).
Moreover, for Co/TiO2 two new shoulders at 680 and 480 cm−1 were registered and can be assigned to the presence of CoO and Co3O4 species [18]. The spectrum of Mo/TiO2 catalyst also exhibited a new peak at 950 cm−1, characteristic of Mo-oxide species supported on TiO2 [19]. It can be attributed to the mixture of phases based on [Mo7O24]6− and [Mo5O17]4− ions [20]. On the other hand, for Cu/TiO2 and Fe/TiO2 catalysts, no characteristic peaks corresponding to their metal oxides were found. In the case of Cu/TiO2, the band near 293 cm−1, characteristic of the CuO crystalline phase, can be expected [21]. For Fe/TiO2, the series of peaks at 225, 247, 293, 299, 412, 498 and 613 cm−1, characteristic of Fe2O3, should be present [22]. Thus, their absence is probably due to their overlapping by TiO2 peaks, characteristic of anatase and rutile crystalline phases.
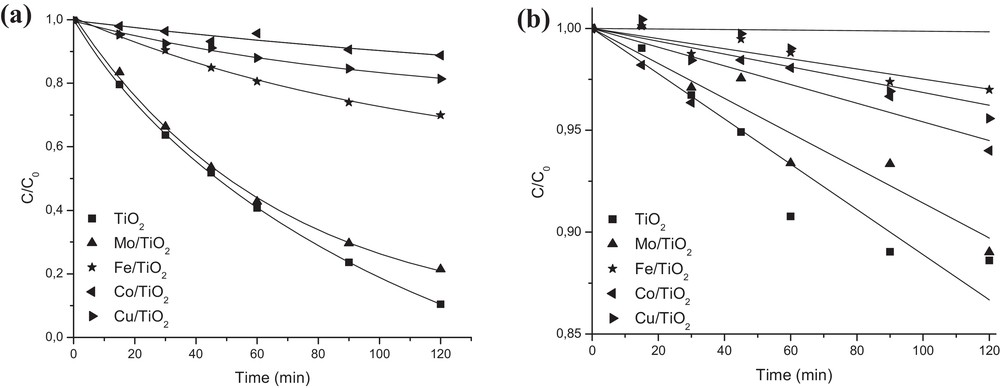
Fig. 4a summarizes the results of phenol photo-degradation under UV radiation in the presence of TiO2 or M/TiO2.
The photocatalytic degradation of phenol over TiO2 and M/TiO2 catalysts under: (a) UV radiation and (b) visible light (Cphenol = 20 ppm, pH = 5, Ccat = 0.5 g/L).
After 2 h of experiment, the following order of activity was observed: TiO2 (89.6%) > Mo/TiO2 (78.6%) > Fe/TiO2 (30.1%) > Cu/TiO2 (18.6%) > Co/TiO2 (11.2%). One can see that deposition of transition metal ions on TiO2 surface was detrimental to its photoactivity in phenol degradation. However, significant differences in their photocatalytic behavior were observed, due to their different physicochemical, textural, and electronic properties. The impregnation of TiO2 with Fe, Co, or Mo let to obtain well-crystallized mixtures of anatase and rutile phases with a similar SBET and crystallite size. However, its loading with Cu allowed us to obtain a catalyst with a significantly lower amount of anatase fraction, probably due to the surface dehydroxylation caused by anatase to rutile phase transformation. Consequently, its activity was significantly reduced since dexydroxylation reduces hole trapping by surface hydroxyls, enhancing recombination and oxygen and/or phenol species adsorption. On the other hand, the enrichment of TiO2 surface with different metal species, not detected by XRD but confirmed by AAS, SEM–EDS, and/or Raman spectroscopy, indicated imperfect diffusion of metal ions into TiO2 due to the low temperature of catalysts preparation and calcination. Finally, surface acidity was also found as an important factor in determining the efficiency of studied photo-catalysts. The systems containing Fe, Cu or Co species, characterized by their basic nature (CuO, CoO, Co3O4, Fe2O3, etc.) and ZPC higher than that of TiO2, were found to be less active in phenol photo-degradation. In contrast, TiO2 enrichment with acidic species introduced by Mo impregnation and based on [Mo7O24]6− and [Mo5O17]4− ions showed higher activity indicating its beneficial role in the creation of active centers for phenol adsorption.
Fig. 4b summarizes the results of phenol photo-degradation under visible light in the presence of TiO2 or M/TiO2. The following order of activity was determined: TiO2 (11.4%) ≈ Mo/TiO2 (11%) > Co/TiO2 (6%) > Cu/TiO2 (4.4%) > Fe/TiO2 (3%). One can see that the percentage of phenol degradation reached under visible light is significantly lower than that under UV radiation. Since light intensity determines the extent of light absorption by the semiconductor surface at a given wavelength, the rate of the photocatalytic initiation of electron–hole formation in the photochemical reaction will be strongly dependent on light intensity. Considering that in visible light the number of photons per unit of time that can strike the catalysts surface is higher than that under UV radiation, higher photoactivity can be expected. However, in visible light, the photon energy is noticeably lower. Therefore, the degree of light absorption by the catalyst surface will also be strongly reduced, leading to a lower percentage of degradation. Since the excitation of band gap electrons with 365 nm can promote them to the conduction bands with higher kinetic energy, they can reach the solid–liquid interface more easily, suppressing electron–hole recombination. Moreover, the value of the band gap of undoped TiO2 (3.09) also confirms that it cannot be excited under visible light. It was also observed that the catalysts characterized by bigger agglomerates size showed lower activity under visible light. Consequently, the presence of big aggregates was found to be detrimental to phenol photo-degradation, since catalyst particles were hidden for light absorption.
Resuming, one can see that TiO2 loading with transition metal ions can be detrimental to its photoactivity in phenol degradation. However, from the series of studied catalysts, Mo/TiO2 was the most efficient one. The presence of different MoxOy phases allowed us to obtain both more efficient charge separations due to new energy level produced in the band gap of TiO2 and an Mo-donor level below TiO2 conduction band, leading to the reduction in TiO2 band gap. Thus, the probability of electron–hole recombination on Mo/TiO2 surface can be reduced. As the next step, the optimization of Mo loading on TiO2 surface will be discussed.
3.2 Physicochemical properties and catalytic performance of 0.5–5 wt% Mo/TiO2 catalysts
Table 3 reports the results of AAS, SBET, ZPC, and band gap determination for TiO2 and x wt% Mo/TiO2 catalysts.
Characterization of TiO2 and x wt% Mo/TiO2 catalysts.
| Catalyst | Real metal content (%)a | SBET (m2/g)b | Vp (cm3/g)b | Dp (nm)b | ZPCc | Band gap (eV)d |
| TiO2 | – | 57 | 0.429 | 37.5 | 6.6 | 3.09 |
| 0.5 wt% Mo/TiO2 | 0.52 | 56.5 | 0.413 | 36.0 | 6.3 | 2.90 |
| 1 wt% Mo/TiO2 | 0.99 | 56.1 | 0.430 | 37.6 | 6.0 | 2.90 |
| 2 wt% Mo/TiO2 | 2.02 | 55.1 | 0.427 | 38.1 | 4.3 | 2.85 |
| 3 wt% Mo/TiO2 | 3.01 | 53.0 | 0.426 | 29.1 | 3.1 | 2.91 |
| 5 wt% Mo/TiO2 | 5.02 | 51.0 | 0.424 | 28.6 | 2.5 | 2.95 |
a Determined by AAS.
b Determined by N2-BET.
c Determined by MT.
d Determined by UV–VIS DRS.
For all Mo/TiO2 systems, the real metal content was very close to the nominal one (0.5–5 wt%).
As molybdenum content increased, SBET and mean pore size diameter of the studied catalysts decreased (Table 3). It can be related to both TiO2 pores obstruction due to the imperfect diffusion of metal ions into the support, at a temperature at which catalysts were calcined, and powders sintering favoured by the increasing amount of Mo species. The decrease in SBET can originate from a coalescence process, since sintering can be favoured in the presence of dopants.
The ZPCs of the studied catalysts was decreasing with an increasing Mo content, probably due to the continuous TiO2 surface enrichment with acidic species (different MoxOy).
Moreover, under increasing Mo content, the diffuse reflectance spectra reveal a red shift in the band gap of TiO2 into lower eV (Table 3), with a minimum value of 2.85 obtained for 2 wt% Mo/TiO2. This is due to the introduction of energy levels of Mo species into the band gap of TiO2. However, the further increase in Mo content (3 and 5 wt%) led to an increase in the band gap. It can be related to the MoO3 formation on TiO2 surface considering that the molybdate anions bind very strongly to the titania surface and that they can be hindered during the calcination of the catalysts. It should be noted that the band gap of MoO3 equals 3.0 [9,23].
SEM–EDS micrographs of TiO2 and Mo/TiO2 catalysts are presented in Appendix 1. Any significant differences in the morphology of TiO2 and Mo/TiO2 catalysts can be seen. The EDS measurements confirmed Mo presence. All samples contained the aggregates with irregular shapes and sizes in the range of 2–30 μm. The following order of average size of catalysts agglomerates, depending on the Mo loading, was observed: 2 wt% Mo/TiO2 (2 μm) < 1 wt% Mo/TiO2 (5 μm) < 0.5 wt% Mo/TiO2 (8 μm) < 3 wt% Mo/TiO2 (10 μm) < 5 wt% Mo/TiO2 (12 μm) < TiO2 (30 μm). For the catalysts with Mo content in the range of 0.5–2 wt%, SEM–EDS images revealed very uniform distribution of Mo on the TiO2 surface. For the samples with higher Mo content, rough metal distribution with characteristic agglomerations was observed.
The XRD patterns of different Mo/TiO2 catalysts (not shown here) did not reveal neither clear Mo nor molybdenum oxides reflections, even for the catalyst containing the highest Mo loading. It could be related to the amorphous nature of Mo-containing species and/or their random spread on TiO2 surface.
A negligible effect of increasing Mo content on TiO2 lattice parameters was also observed (Table 4), confirming the presence of metal on the support surface instead of its incorporation into the TiO2 lattice. The slight increase in the crystallite size of Mo/TiO2 catalysts with an increase in Mo content was observed, due to the catalysts sintering and/or Mo–O–Ti bonds formation. Moreover, the anatase fraction as well as anatase to rutile ratio was higher for the samples containing the highest Mo loading (3 and 5 wt%). It means that the increasing Mo content inhibit the anatase to rutile phase transformation.
The average crystallite size, lattice parameters and anatase to rutile ratio of TiO2 and x wt% Mo/TiO2 catalysts.
| Catalyst | dhkl (Å) | a = b (Å) | c (Å) | Cell volume (Å3) | Crystallite size (nm) | Anatase fraction (%) | Anatase/rutile ratio |
| TiO2 (as received) | 3.5 | 3.8 | 9.8 | 140.4 | 20.7 | 84.95 | 5.6 |
| 0.5 wt% Mo/TiO2 | 3.5 | 3.8 | 9.4 | 134.6 | 20.0 | 84.8 | 5.6 |
| 1 wt% Mo/TiO2 | 3.5 | 3.8 | 9.4 | 133.8 | 20.6 | 83.7 | 5.1 |
| 2 wt% Mo/TiO2 | 3.5 | 3.8 | 9.8 | 141.9 | 21.0 | 84.5 | 5.5 |
| 3 wt% Mo/TiO2 | 3.5 | 3.8 | 9.5 | 137.1 | 21.4 | 87.9 | 7.3 |
| 5 wt% Mo/TiO2 | 3.5 | 3.8 | 9.6 | 138.3 | 21.7 | 89.4 | 8.4 |
Fig. 5 shows the Raman spectra of x wt% Mo/TiO2 catalysts. The observed species together with their respective peak frequencies are summarized in Table 5. The corresponding analysis was performed for the selected part of the spectra (wave number range of 800–1000 cm−1) in which peaks characteristic of different MoxOy are expected. One can see that depending on Mo loading, different MoxOy species on titania surface were registered. The catalysts with low Mo content are characterized by the presence of structures based on [Mo7O24]6− ion (0.5 wt% Mo/TiO2), or on the mixture of phases based on [Mo7O24]6− and [Mo5O17]4− ions and Mo5O14 (1 wt% Mo/TiO2). Under increasing amount of Mo, the intensity of the phases based on [Mo5O17]−4 ion increases. Moreover, new phases based on [Mo7O24]6− ion and Mo4O11 are detected (2 wt% Mo/TiO2). Further increase in Mo loading (3 wt% Mo/TiO2) results in the formation of additional phases based on [Mo8O26]4−, or structures based on double cell [Mo5O17]4−, therefore [Mo10O34]8−. Finally, for the sample impregnated with the highest amount of Mo (5 wt% Mo/TiO2), the new peaks at 820 cm−1 (νs MoO stretching) and at 996 cm−1 (ναs MoO stretching) were observed. They are characteristic of the presence of MoO3.
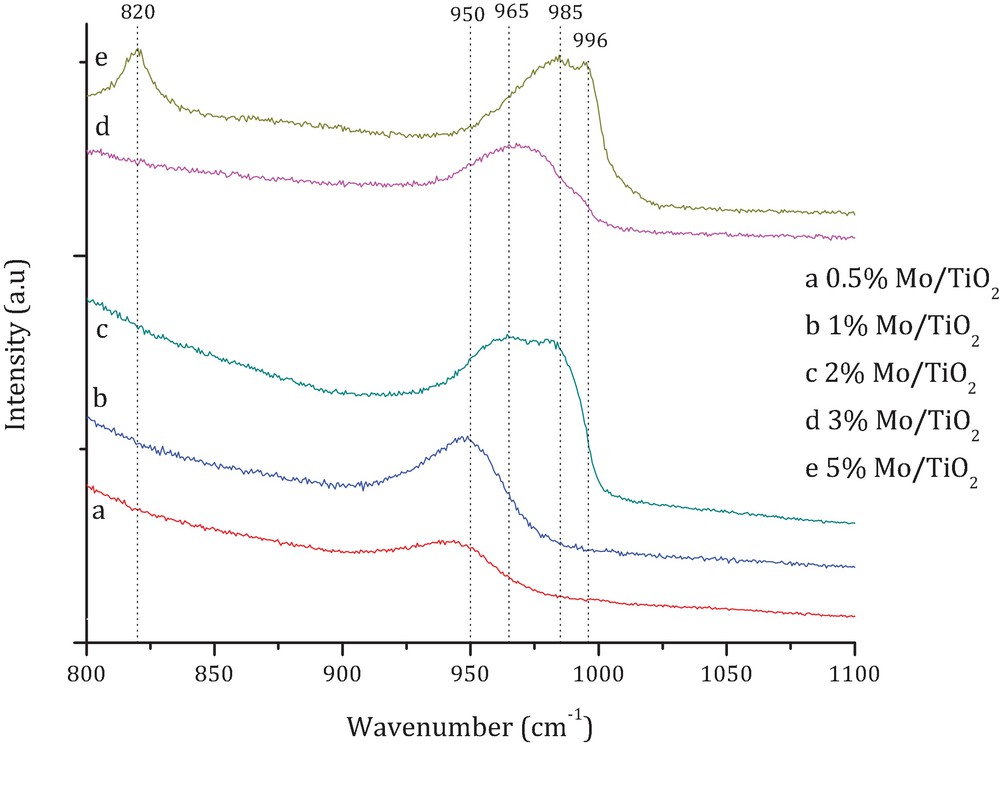
(Color online.) Representative Raman spectra for different x wt% Mo/TiO2 catalysts.
Raman peak frequencies for different MoxOy species.
| Species | Wavenumber (cm−1) | Reference | |
| 800–900 | 900–1000 | ||
| MoO3 | 820 | 996 | [24] |
| Mo4O11 | 835, 843 | 907, 985 | [20] |
| [Mo7O24]6− | 893 | 908, 919, 938 | [20] |
| [Mo5O17]4− | 893 | 922, 930, 935, 948 | [20] |
| [Mo8O26]4− | 889 | 911, 932, 951, 965 | [20] |
| [Mo10O34]8− | 909, 969 | [20] | |
| Mo5O14 | 898 | 930, 950 | [20] |
Fig. 6a resumes the results of phenol photo-degradation under UV radiation in the presence of TiO2 or x wt% Mo/TiO2. Under increasing Mo loading, the percentage of phenol degradation increases with the maximum achieved over 2 wt% Mo/TiO2 (96.2%), which was found to be higher than that corresponding to bare TiO2 (89.6%).
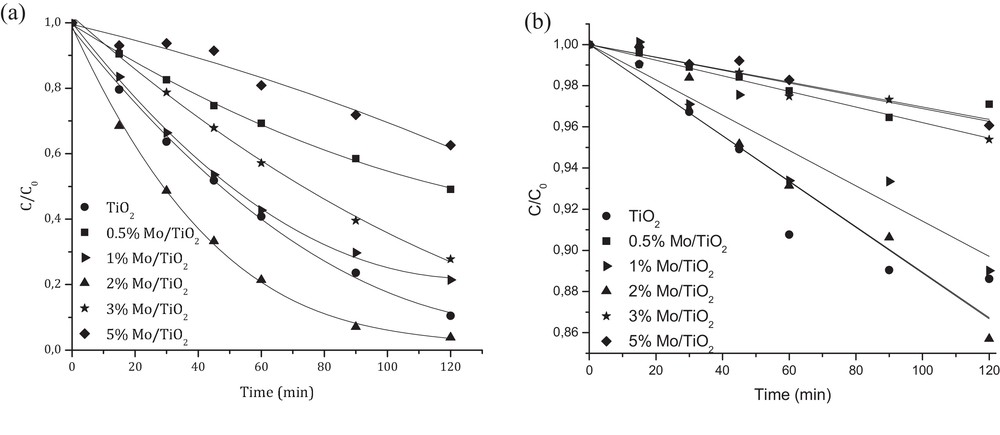
Photocatalytic degradation of phenol over TiO2 and x wt% Mo/TiO2 catalysts under: (a) UV radiation and (b) visible light (Cphenol = 20 ppm, pH = 5, Ccat = 0.5 g/L).
However, further increase in Mo content leads to the decrease in the photoactivity of the catalysts. Similar order of activity was observed under visible light (Fig. 6b): 2 wt% Mo/TiO2 (14.3%) > TiO2 (11.4%) > 1 wt% Mo/TiO2 (11%) > 3 wt%Mo/TiO2 (4.6%) > 5 wt% Mo/TiO2 (3.9%) > 0.5 wt% Mo/TiO2 (2.9%).
The acid–base properties of the studied catalysts cannot be directly correlated with their activity results. However, they can affect the extent of phenol adsorption on TiO2 surface and consequently its photoactivity. At the catalyst's ZPC, its interaction with water contaminant is minimal due to the absence of any electrostatic force. Thus, the surface of catalysts with ZPC higher than 5 (pH of reaction), i.e. 0.5–1 wt% Mo/TiO2, becomes positively charged (e.g., TiOH2+); meanwhile the molecule of phenol is a non-dissociated one (neutral, pKa = 9.95). On the other hand, the surface of catalysts with ZPC significantly lower than 5 (pH of reaction), i.e. 3–5 wt% of Mo/TiO2, will be negatively charged (e.g., TiO−) and repulse the phenolate ions (C6H5O−) in water. Thus, one can see that the phenol degradation is higher for the catalysts with ZPC close to the pH of the treated solution.
The differences in the photoactivity of Mo/TiO2 catalysts can be also attributed to their morphology. One can see that the decrease in SBET and mean pore size diameter as well as increase in catalyst agglomerate size, under increasing Mo content, was detrimental for the photoactivity.
The diffuse reflectance spectra revealed a red shift in the band gap transition under an increasing amount of Mo impregnated on TiO2 surface (Table 3). According to the literature [15], it can be related to the introduction of Mo energy levels into the band gap of TiO2. Thus, the presence of new energy levels, below the conduction band edge and above the valance band edge, can affect catalyst photoactivity since Mo ions can act as electron–hole pair recombination centers, according to the following reactions:
| (10) |
| (11) |
Finally, a relation between phenol degradation percentage and MoxOy species present on the TiO2 surface can be found. Under increasing Mo content, the appearance of different MoxOy species was registered. However, the coverage of TiO2 surface with bulk MoO3 was observed only for 5 wt% Mo/TiO2, a catalyst characterized by the lowest phenol degradation percentage.
Therefore, high activity of 2 wt% Mo/TiO2 can be attributed to the synergetic effect between SBET, mean pore size diameter, catalyst agglomerate size, band gap, ZPC, and the type of MoxOy species on TiO2 surface.
4 Conclusions
Photocatalytic degradation of phenol under both UV radiation and visible light, using TiO2 (Degussa P-25) and TiO2 loaded with some transition metal ions (Co, Cu, Fe and Mo) was examined. The most significant results can be summarized as follows:
- • from the series of metal loaded catalysts, Mo/TiO2 was the most efficient one. Its photocatalytic performance was attributed to the synergetic effect between SBET, mean pore size diameter, catalyst agglomerates size, band gap and ZPC. In the presence of Mo, neither TiO2 anatase/rutile fraction not its pore size diameter has been affected. However, Mo made its surface more acidic. The percentage of phenol degradation reached under visible light was significantly lower than that under UV radiation due to the lower degree of light absorption by the catalyst surface;
- • from the series of studied x wt% Mo/TiO2 catalysts, 2 wt% Mo/TiO2 was the most effective one. The synergetic effect between SBET, mean pore size diameter, catalyst agglomerates size, band gap, ZPC and the type of MoxOy species on TiO2 surface, depending on Mo loading, created its photocatalytic performance.
Acknowledgments
The financial support of COLCIENCIAS and Universidad Nacional de Colombia, Sede Manizales (Programa Jóvenes Investigadores e Innovadores Convocatoria 525 de 2011 – Convenio Especial de Cooperación No. 0043 de 2012) is gratefully acknowledged. This work was partially supported by DIMA–Apoyo a Tesis de Posgrado 2012 (project 15932) and the program of Semilleros de Investigación en Pregrado (Res. CFCEN-100 del 15.09.2010).
Appendix 1.
The back-scattered electron (BSE) photomicrographs and EDS maps of studied catalysts. (Magnification: × 2500).