

1 Introduction
Cost and resource-efficient extraction of natural products alongside high-quality aspects are the key elements for successful manufacturing. A lot of work was published in this field from at-line analytics [1] to rigorous model-based optimization of conventional solvent extraction [2–7] to applying alternative solvent and extraction concepts, such as pressurized hot water extraction [8–10], scCO2 [11], ultrasonic and microwave–assisted extraction, or pulsed electrical field [12–14]. In this study, the focus is on conventional solvent extraction of anethole and fenchone from fennel (Foeniculum vulgare L.) as a typical example system for natural derived molecules. Irrespective of rigorous modeling and optimization of extraction processes, plant-based substances are derived from natural resources that are subject to heavy fluctuations due to weather, watering conditions, fertilization, and so on, which have to be taken into account. For fennel, contents of the volatile fractions ranging from 1.3% to 12.5% are reported [15]. In this study, these effects will be included during extraction by applying quantitative in-line measurements with Raman spectroscopy. Because of the low measurement time and easy or in the case of in-line spectroscopy, no sample preparation, these methods are real time capable for extraction with commonly much larger time constants. The in-line measurements will serve as a database for a model-based optimization alongside predetermined model parameters and characteristics of the applied plant material. The aim was to develop a tool for advanced process control during extraction to
- • take a fluctuating feedstock into account,
- • detect the ideal end point of extraction, and
- • be able to simulate perturbations during extraction like, for example, a skipping solvent pump.
2 Modeling and model parameter determination
In general, solid–liquid extraction is described by several partial models. The corresponding equations and assumptions can be found in detail elsewhere [4,6,16]. Thus, only a brief overview of the percolation model is given.
The mass balance in the liquid phase is described by the so-called distributed plug flow model. It serves for modeling the macroscopic mass transport in the percolation column. For the solid phase, a pore diffusion model describes the mass transport in the pores of the plant material. The raw material residual load of target components and the corresponding extract concentration are accounted for by equilibrium curves.
The target component mass balance in the fluid phase (Eq. (1)) considers accumulation, axial dispersion, convective mass transport, and mass transfer from the pores of the plant material into the bulk phase.
| (1) |
| (2) |
| (3) |
| (4) |
Mass transfer from the particle into the bulk phase is calculated using the mass transfer coefficient kf and the specific particle surface aP. The specific surface area aP is calculated as (Eq. (5))
| (5) |
The mass transfer coefficient kf is derived by correlations that are widely used in chromatography and were already applied successfully for solid–liquid extraction [2].
| (6) |
| (7) |
| (8) |
Under the assumption of spherical particulates, the following equation can be derived as a mass balance for the target component in the plant material. The effective diffusion coefficient Deff has to be measured by real extraction experiments.
| (9) |
The adsorption/desorption equilibrium inside the pores is described through equilibrium curves. Herein q is the plant material residual load linking the equilibrium curve to the pore diffusion model. A well-known approach is, for example, the Langmuir equilibrium. The parameters KL and qmax can be derived from measurements. The maximum load qmax is the total amount of anethole and fenchone. The equilibrium curves are measured with multistep macerations. The approach is described in detail elsewhere [4,6].
| (10) |
3 Materials and methods
3.1 Plant material
Dried whole fennel seeds (F. vulgare L.) were ordered from CfM Oskar Tropitzsch GmbH, Marktredwitz, and stored at 4 °C. Anethole and fenchone of analytical quality were bought from Sigma Aldrich. The ethanol for extraction was from VWR, purity was >99.5%. The fennel seeds were ground to a mean diameter of 1 mm with a Knife Mill Grindomix GM 200 from Retsch before extraction.
3.2 Extraction equipment
For extraction experiments, an already established setup was extended with a flow cell from Helma and a Raman spectroscope QEPRO from Ocean Optics equipped with a 785 nm diode laser. The solvent pump is a P110 preparative high-performance liquid chromatography (HPLC) pump from VWR and the collector is a Foxy Jr. The pump and the collector are controlled with the EZChrom Elite HPLC software. The percolation column itself consists of stainless steel and is equipped with frits to ensure proper solid retention during extraction. The inner diameter (i.d.) is 2.4 cm and the length is 10 cm. Spectra processing is performed with The Unscrambler X 10.5. During extraction, samples are taken with the collector to gain reference data for the partial least square (PLS) calibrations. The experimental setup is shown in Fig. 1.
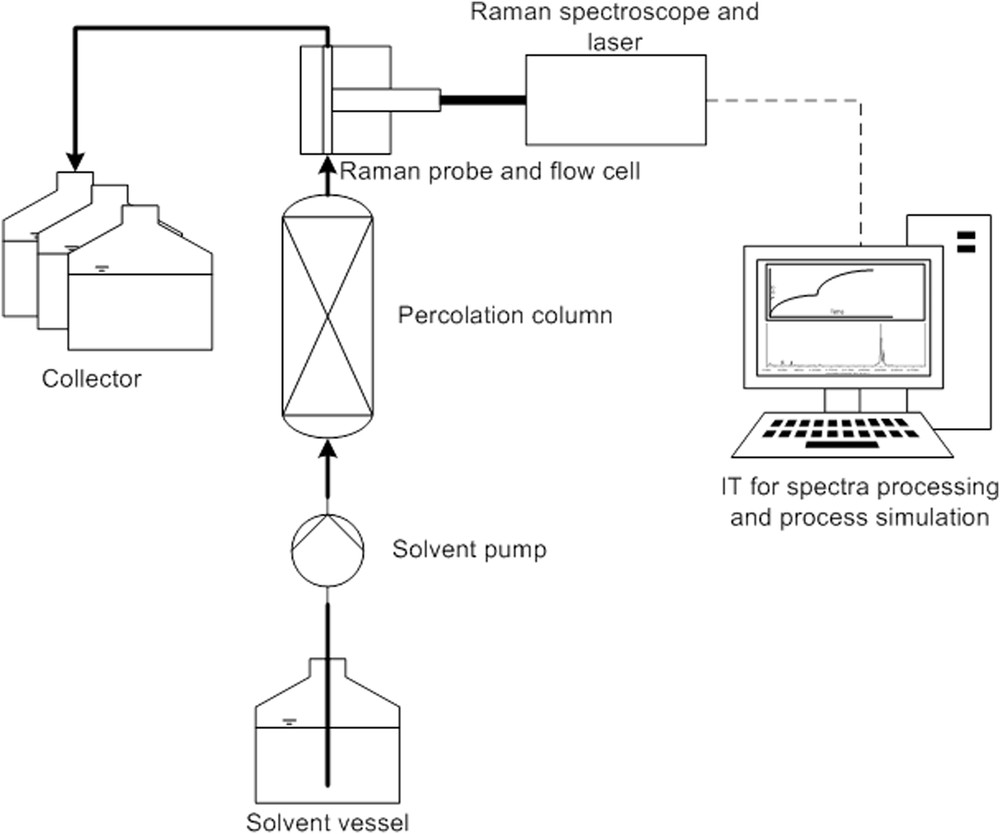
Setup for in-line measuring and advanced process control.
3.3 Analytics
To obtain reference data for partial least square regression (PLS-R) calibration the collected extract is analyzed by an Agilent SCION 436-GC gas chromatography (GC) using anethole and fenchone as external standards. The chromatographic conditions are as follows: injector temperature 250 °C, detector temperature 280 °C, split ratio 1:120, column: Agilent DB-5 30 m × 0.32 mm i.d., 0.25 μm film, column temperature: 80 °C for 3 min, 8 °C/min for 15 min, 200 °C for 3 min, carrier gas hydrogen, injection volume 1 μL.
The samples were filtered through a 0.2 μm syringe filter before analysis and injected undiluted into the gas chromatograph after the experiments to avoid influence of storage.
4 Results and discussion
Note: In the following a physicochemical (rigorous) process model serves for predictive simulation of the extraction. A statistical PLS-R model was used to measure the concentrations of anethole and fenchone by Raman spectroscopy. Both are models in the linguistic usage but the underlying theory and scope of application are totally different.
With its very short measuring time (ranging from a few milliseconds to a few seconds) and a fully automatable data processing, spectroscopy provides the possibility to monitor extraction processes in real time. Furthermore, it is possible to adjust a rigorous process model to control the process (advanced process control). Moreover, this technology is rather cheap as compared to HPLC or GC, because no chemicals or movable parts are used.
As depicted, fennel seeds serve as an example system because the target component anethole has significant Raman bands at 1651 cm−1 (vinylic CC stretching vibration) and 1604 cm−1 (CC aromatic stretching vibration) [21]. A corresponding spectrum is shown in Fig. 2. There is an obvious incline of the baseline toward lower Raman shifts due to fluorescence of the sample [22]. Besides for anethole, a PLS-R was made for the side component fenchone. Because there are no obvious bands in the spectrum that can be matched to fenchone, this is more challenging than in case of anethole.
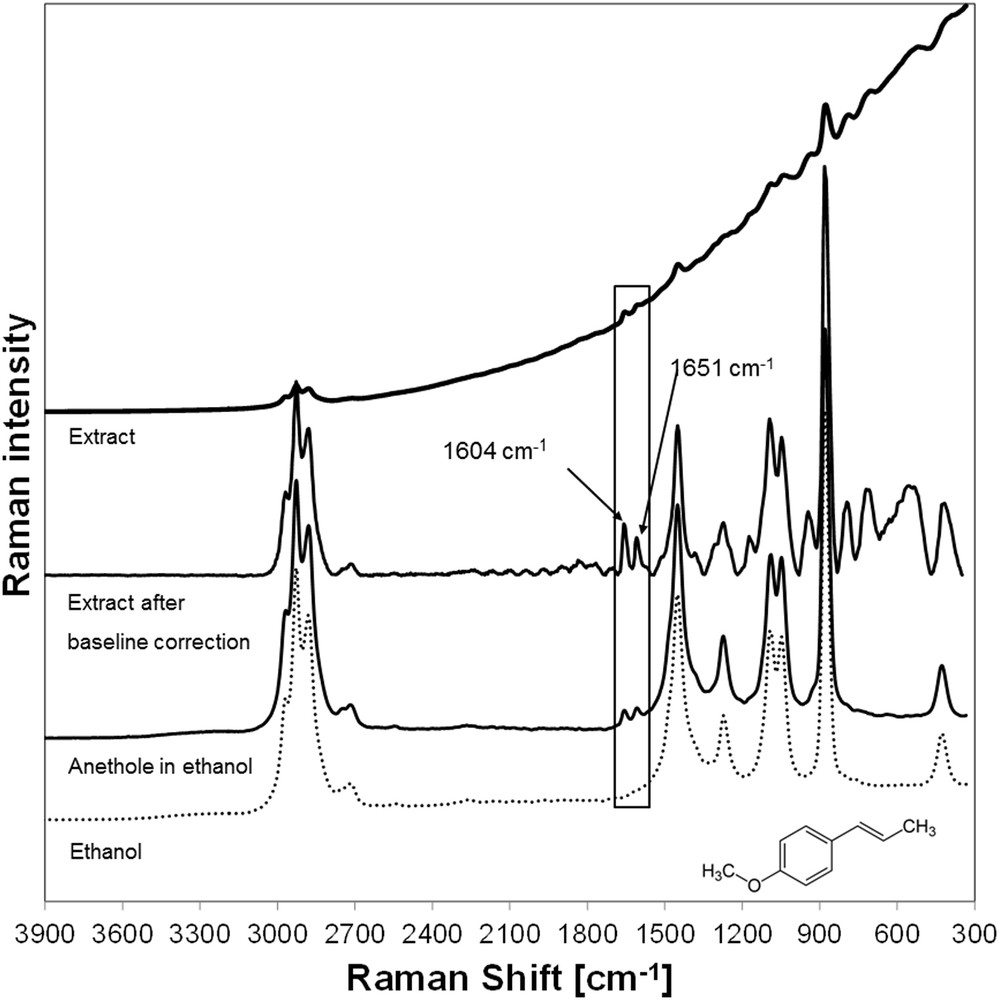
Spectrum of an ethanolic fennel extract.
To obtain the PLS-R models, a total of four extraction experiments with the equipment shown in Section 3.2 were carried out. Two of the data sets serve for calibration (number of samples = 94) and the other two for model validation (number of samples = 77). To achieve a robust and reliable model no cross validation was applied in this work. The measuring time for each spectrum was fixed to 500 ms and five spectra were averaged to one single spectrum to raise the signal-to-noise ratio. No data pretreatment was used before PLS-R to assess the opportunities and limits of the PLS-R with raw data. Calibration of anethole was performed using the two significant bands at 1604 and 1651 cm−1. Fenchone was calibrated using the full spectrum. Reference data were obtained by GC. The PLS model for anethole has an error of calibration of 0.0125 g/L (root mean square error of calibration [RMSEC] = 0.0126 g/L, R2 = 0.99), which is a deviation of approximately ±1.26% with regard to the mean value of about 1 g/L. The error of calibration for fenchone is 0.01188 g/L (RMSEC = 0.01188 g/L, R2 = 0.98) resulting in an error percentage of ±3.39% with regard to the mean value of 0.35 g/L. The root mean square errors of validation (RMSEVs) for anethole and fenchone are 0.02608 g/L (±2.6%) and 0.01945 g/L (±5.55%), respectively. This means, for the given data the anethole model has a minimum deviation of ±1.26% and a maximum deviation of ±2.6%. The deviations for the fenchone model are between ±3.39% and ±5.55%. The models are shown in Fig. 3.
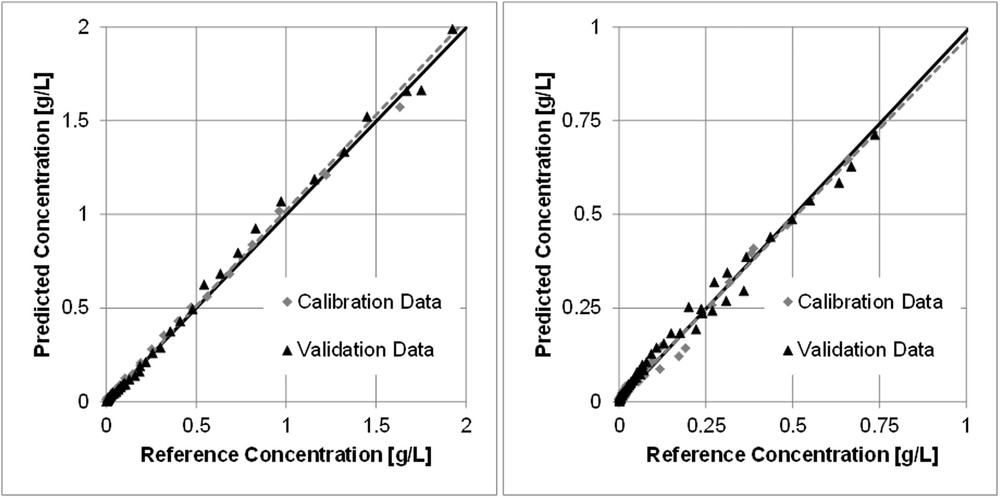
PLS-R models for anethole (left) and fenchone (right) in ethanolic fennel extract.
Because of its distinctive spectrum, the anethole model achieves higher accuracy because the calibration was performed using only two bands (error of validation is only half the value of fenchone). Thus useless parts of the spectrum were excluded and do not influence the model. The lack of significant bands results in a higher model error for fenchone because noise has to be processed as well, or rather, the relevant information is not isolated sufficiently from the data or is not present at all, in the first place.
In the PLS models discussed above, no data pretreatment was used to see how good the models are when only raw data are used. To find the best model an overview of different calibrations using common pretreatment methods is given in Table 1. The best results are highlighted. For completeness, a calibration for anethole using the full spectrum was done as well.
PLS-R models for anethole and fenchone using common pretreatment methods.
| Model | Pretreatment | Factors | RMSEC (g/L) | RMSEV (g/L) | R2 (cal.)/R2 (val.) |
| Anethole, full spectrum | None | 5 | 0.00936 | 0.03143 | 0.99/0.99 |
| Standard normal variate (SNV) transformation | 5 | 0.09619 | 0.13433 | 0.87/0.91 | |
| Multiplicative signal correction (MSC) | 4 | 0.10023 | 0.13957 | 0.86/0.90 | |
| 1. Derivative, 3 grid points (Savitzky–Golay) | 4 | 0.01343 | 0.03552 | 0.99/0.99 | |
| 1. Derivative, 7 grid points (Savitzky–Golay) | 4 | 0.00942 | 0.03876 | 0.99/0.99 | |
| 2. Derivative, 3 grid points (Savitzky–Golay) | 4 | 0.01541 | 0.0860* | 0.99/0.96 | |
| 2. Derivative, 7 grid points (Savitzky–Golay) | 3 | 0.01619 | 0.04217 | 0.99/0.99 | |
| Smoothing, 3 grid points (Savitzky–Golay) | 5 | 0.00971 | 0.03146 | 0.99/0.99 | |
| Smoothing, 7 grid points (Savitzky–Golay) | 5 | 0.01036 | 0.03026 | 0.99/0.99 | |
| Anethole, 1604 and 1651 cm−1 | None | 2 | 0.01256 | 002608 | 0.99/0.99 |
| SNV transformation | 4 | 0.12179 | 0.17320 | 0.79/0.85 | |
| MSC | 4 | 0.12049 | 0.17303 | 0.30/0.85 | |
| 1. Derivative, 3 grid points (Savitzky–Golay) | 1 | 0.01646 | 0.03041 | 0.99/0.99 | |
| 1. Derivative, 3 grid points (Savitzky–Golay) | 1 | 0.02210 | 0.04587 | 0.99/0.99 | |
| 2. Derivative, 7 grid points (Savitzky–Golay) | 1 | 0.01421 | 0.03444 | 0.99/0.99 | |
| 2. Derivative, 7 grid points (Savitzky–Golay) | 1 | 0.01412 | 0.03835 | 0.99/0.99 | |
| Smoothing, 3 grid points (Savitzky–Golay) | 2 | 0.01463 | 0.027079 | 0.99/0.99 | |
| Smoothing, 7 grid points (Savitzky–Golay) | 2 | 0.01608 | 0.02306 | 0.99/0.99 | |
| Fenchone, full spectrum | None | 4 | 0.01188 | 0.01945 | 0.98/0.98 |
| SNV transformation | 5 | 0.03958 | 0.05229 | 0.36/0.90 | |
| MSC | 4 | 0.04123 | 0.05401 | 0.35/0.89 | |
| 1. Derivative, 3 grid points (Savitzky–Golay) | 3 | 0.01254 | 0.02268 | 0.98/0.98 | |
| 1. Derivative, 7 grid points (Savitzky–Golay) | 4 | 0.00616 | 002166 | 0.99/0.98 | |
| 2. Derivative, 3 grid points (Savitzky–Golay) | 2 | 0.01514 | 003677 | 0.98/0.95 | |
| 2. Derivative, 7 grid points (Savitzky–Golay) | 3 | 0.00737 | 0.01559 | 0.99/0.99 | |
| Smoothing, 3 grid points (Savitzky–Golay) | 4 | 0.00955 | 0.01785 | 0.99/0.98 | |
| Smoothing, 7 grid points (Savitzky–Golay) | 4 | 0.00665 | 0.01420 | 0.99/0.99 |
When calibrating anethole using the two bands at 1651 and 1604 cm−1, no improvement can be seen by applying common pretreatment methods. The information content is sufficient for proper PLS-R. When calibrating anethole using the two significant bands, an improvement in the validation error of about 11% can be achieved by smoothing the spectra with the Savitzky–Golay algorithm using seven grid points. This model is preferred, despite a rising error of calibration. By selecting the two bands for model calculation only two factors have to be used, whereas five factors are needed when the full spectrum is considered. The model for fenchone shows a decreasing error of calibration (−44%) by applying the same smoothing algorithm, because the signal-to-noise ratio improves. The error of validation decreases by 27%.
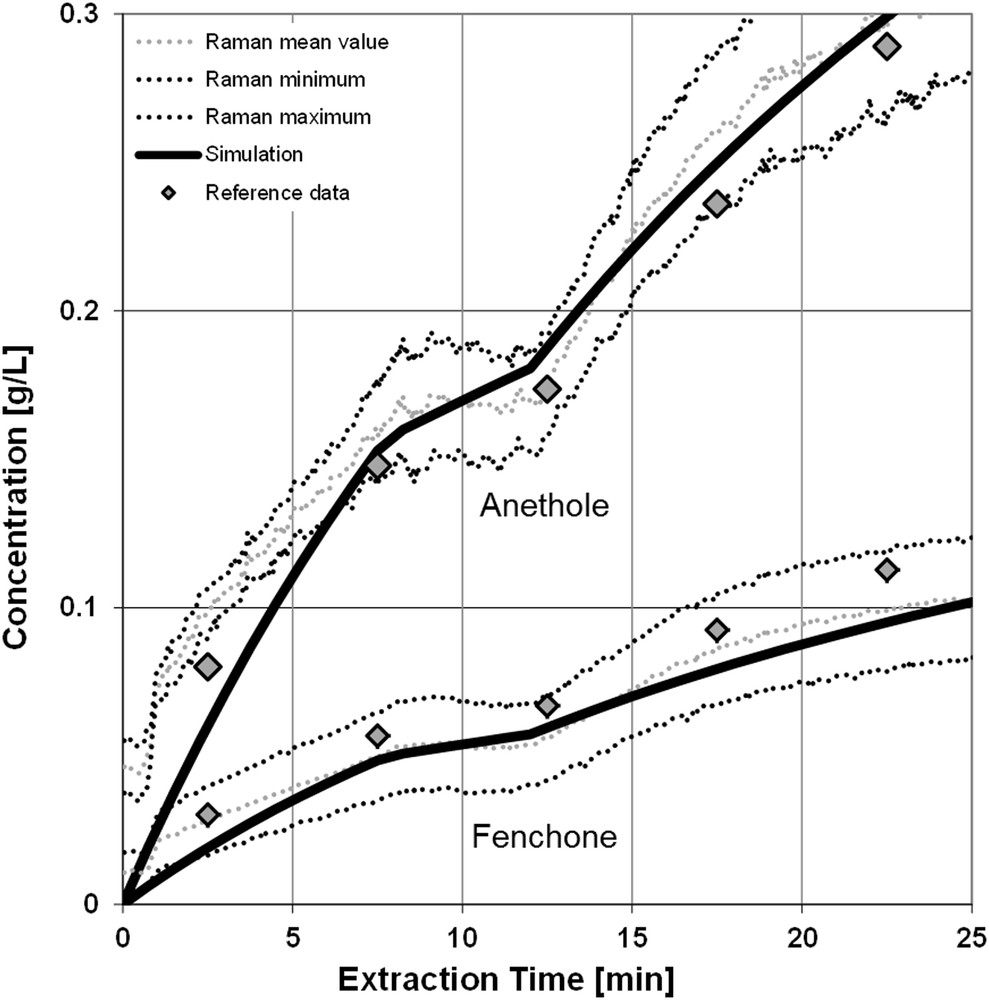
The two valid PLS models (anethole: 1651 and 1604 cm−1, smoothing; fenchone: full spectrum, smoothing) allow to monitor the extraction process in real time, as shown in Fig. 4 for an independent experiment. Moreover, it is now possible to adjust parameters of the physicochemical process model, such as the effective diffusion coefficient or the content of the regarded target and side components of the used plant material. The equilibrium data were measured before the in-line experiments by multistep maceration [4,6,23]. In Fig. 4, the black lines are the simulation results; the data cloud represents the concentrations determined by Raman spectroscopy. The data cloud surrounding the mean values is the confidence interval of the PLS-R. The rhombs are concentrations measured by off-line GC after the extraction has taken place. For this experiment, 20 g of ground fennel seeds were extracted with pure ethanol at 1 mL/min for 150 min at room temperature. The good agreement between the concentrations measured by GC and Raman spectroscopy indicates the usability of the method. The GC data are underestimated by the PLS models systematically, but they are still in the range of the confidence interval.
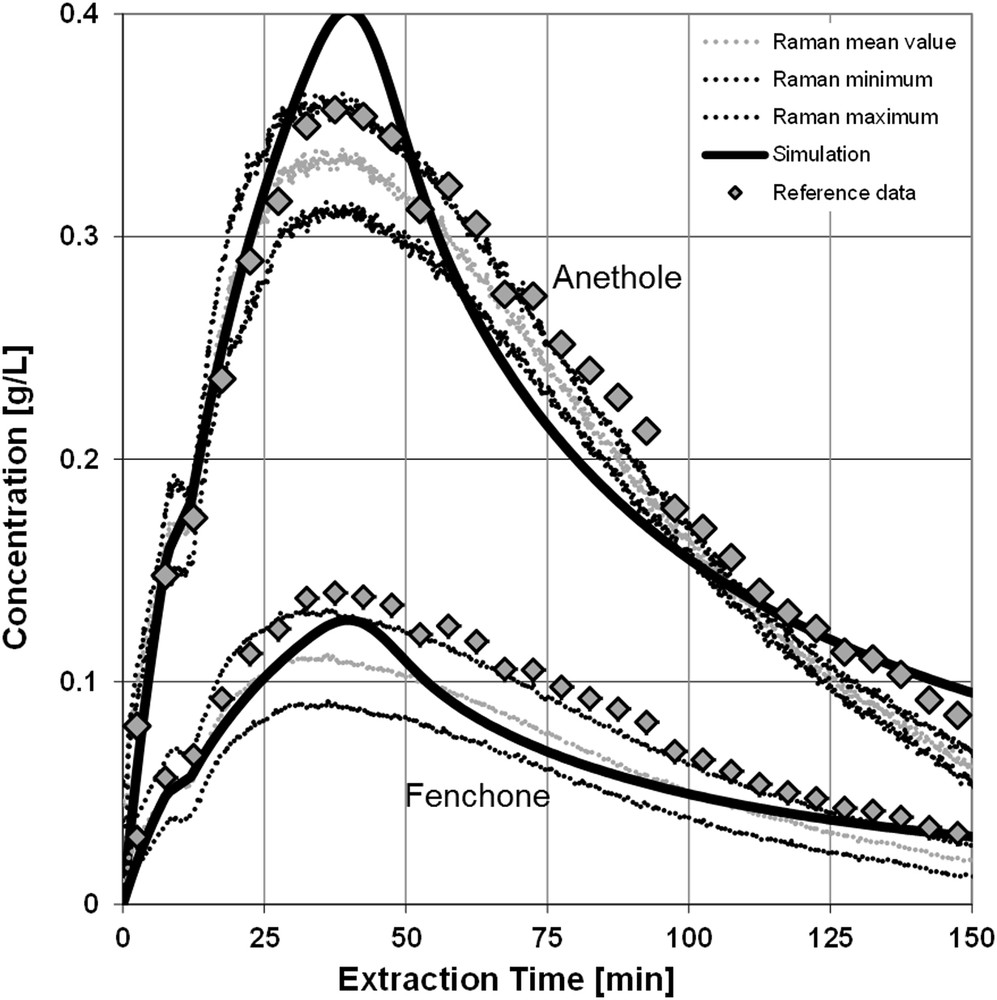
Concentration profile and simulation results.
The extraction curves shown in Fig. 5 result in converting the concentrations into accumulated masses. The black lines are again the simulation results. The gray lines in the middle of its surroundings are the values from Raman spectroscopy including the confidence interval. The rhombs represent the GC data comparison. It is not surprising that the extraction curves show a high conformity, as they are directly derived from the concentrations in Fig. 4. This figure repeats the underestimation of the concentrations, resulting in a deviation of the accumulated mass of about 5% for anethole and 20% for fenchone.
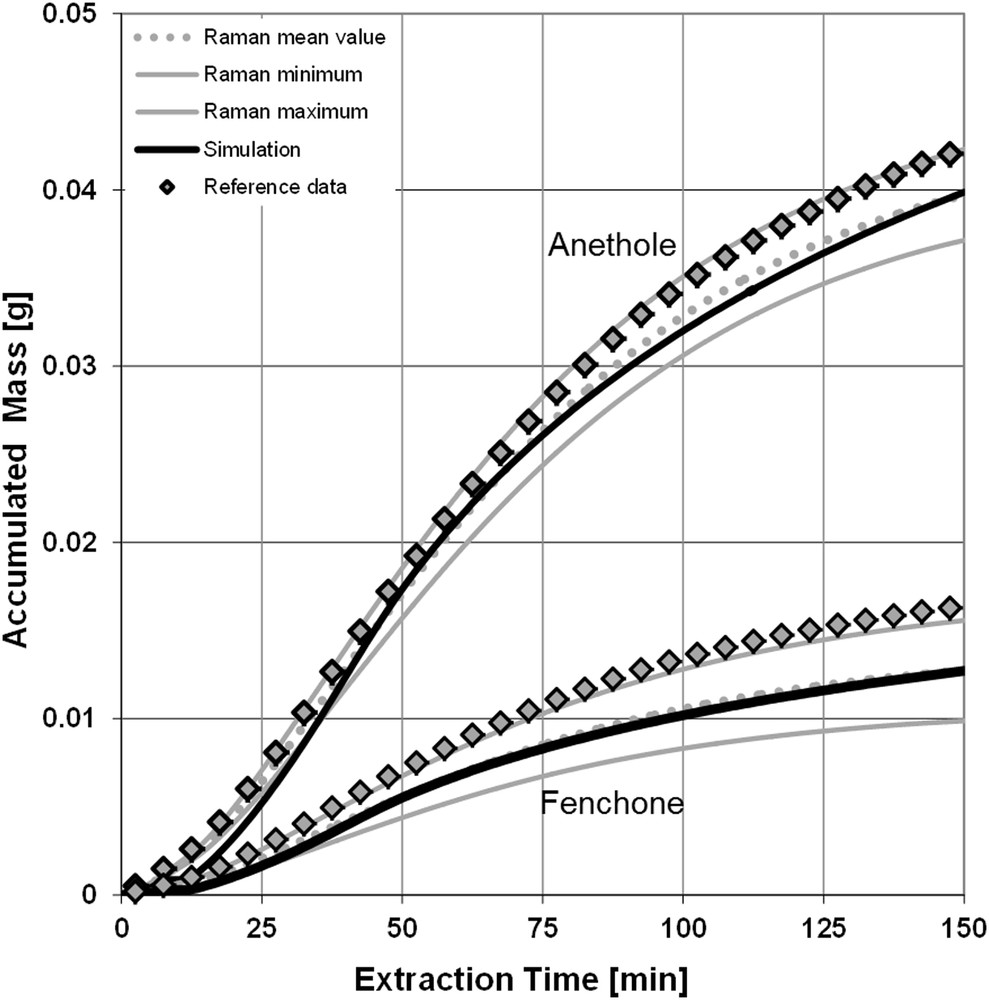
Extraction curves and simulation results.
The demonstrated approach makes data-driven decisions during extraction of valuable compounds from plants possible. Despite a systematic prediction error, this method is a suitable way to monitor the process in real time in combination without additional operating costs. By applying a rigorous process model, the impact of decisions can be assessed and operation parameters can be readjusted if necessary. This advanced process control strategy is a real added value for phytoextraction. Common scenarios occurring during processing can now be evaluated by predictive process simulation, such as the following:
- • A changing load of target and side components from harvest to harvest leads to an adjustment of the solvent amount and the extraction time. Thus blending and storing of various batches of the same plant material can be reduced or even avoided. The overall amount is a model parameter, which can be measured experimentally a priori with minimal effort in laboratory scale to be set in the simulations. Moreover, there are possibilities for its determination by means of spectroscopy [15,24].
- • While extracting several batches of one homogeneous harvest of the same plant material, the extraction takes longer. This may be traced to larger particles due to wear in the shredder.
- • A major failure (e.g., wrong solvent or composition, wrong plant material) is recognized immediately and the process is stopped so that damage occurring can be limited.
- • Random changes in the standard procedure, such as a skipping solvent pump (demonstrated in this example at 12 min of extraction time, notably buckling in the concentration profile in Fig. 6), are recognized and the effects on the process can be evaluated with the physicochemical process model. Actions for compensation can be initiated early.
- • The process is based on a lead structure and controlled by a rigorous process model. A high level of process knowledge is therefore generated, which is the key element for modern concepts of quality assurance like quality-by-design [25,26] and modern manufacturing concepts like “Industrie 4.0” [27].
Concentration profile and simulation results for a random fault (skipping pump).
The approach shows the high additional value of in-line spectroscopy for extraction. This example relies mainly on the two strong bands of anethole at 1604 and 1651 cm−1 and that there are no solvent bands in this range to overlap them. The calibration for fenchone using the full spectrum delivers accurate predictions as well. Other typical challenges for phytoextraction like the extraction of the antimalaria drug artemisinin from Artemisia annua L. cannot rely on such strong and unobstructed bands [28]. This results in reduced prediction accuracy and lower robustness of the model. Furthermore, the manifold of different components in complex mixtures contributes to the spectrum. Therefore, the relevant information of the target component is hidden, and in some cases cannot be isolated at all. In such cases, other techniques, like NMR spectroscopy have to be used, which is becoming more and more affordable due to upcoming low-field equipment [29]. Even a combination of two orthogonal methods at once like Raman and NMR is possible and realistic.
5 Conclusion
The study showed that in-line spectroscopy and advanced process control with a rigorous process model for phytoextraction processes is ready to use. Even if techniques like Raman spectroscopy cannot be applied to any plant material or extracts, there is an emerging field of various other methods, like NMR, UV–vis, and so on. Due to the high performance of modern computers, real-time data processing and predictive simulation are possible and should be further industrialized avoiding batch failures, increasing process robustness, and product quality, as well as optimal resource utilization toward sustainable Green Extraction processes. Furthermore, extraction processes can be controlled in real time to meet an optimized operating point with regard to solvent consumption, energy demand, resource efficiency, and productivity. A reduction in process time and solvent amount by a factor of 2 is easily possible, due to the exponential shape of the extraction curve, if the desired yield should only be 80% instead of 95%. Therefore, real-time measurements are necessary for accurate end point detection. By applying innovative and mass transport–enhancing methods like ultrasound or microwave–assisted extraction [13,14,30], the extraction processes are much faster, thus rapid in-line measurement techniques are needed for a proper process monitoring and therefore contribute especially well in terms of Green Extraction.
Acknowledgments
We gratefully acknowledge the financial support obtained from the Deutsche Forschungsgemeinschaft (DFG) in Bonn, Germany (project STR 586/4-2, Schu 566/14-2).
Nomenclature
SymbolsaP
specific surface area, 1/m
cLconcentration in the liquid phase, kg/m³
cPconcentration in the porous particle, kg/m³
Daxaxial dispersion coefficient, m/s2
Deffeffective diffusion coefficient, m2/s
KLequilibrium constant, m³/kg
kfmass transport coefficient, m/s
PePéclet number
Qloading, kg/m³
qmaxmaximum loading, kg/m³
ReReynolds number
Rradius, m
ScSchmidt number
ShSherwood number
Ttime, s
uzsuperficial velocity, m/s
zcoordinate in axial direction, m
εvoids fraction
ρdensity, kg/m³
AbbreviationsGC
gas chromatography
i.d.inner diameter
PLS-Rpartial least square regression
RMSECroot mean square error of calibration
RMSEVroot mean square error of validation
Vous devez vous connecter pour continuer.
S'authentifier