

1 Introduction
Hexavalent chromium (Cr(VI)) is a widely occurring pollutant in soils, groundwaters, and waste materials, especially in chromite ore processing residue (COPR) and foundry slags. Chromium in the hexavalent oxidation state is toxic and carcinogenic. As sodium dichromate, Cr(VI) is a base compound used in the chemical industry for the production of pigments, wood treatment, and tannery products, as well as corrosion inhibitors. For the production of sodium dichromate from chromite ore (main mineral phase, FeCr2O4), a relatively inefficient metallurgical technique is still widely used, which has given rise to a legacy of COPR material worldwide. This is a major contributor of Cr(VI) to the environment [5,6,13]. To quantify Cr(VI) in solution, most practitioners use the colorimetric method with the 1,5-diphenylcarbazide (DPC) complex, the standard method of Cr(VI) determination [1,9,14]. The color complex is very strong, leading to a high sensitivity of the method. This explains why the DPC method applies only to a fairly small concentration range, roughly from 0 to 0.8 mg/L Cr(VI). For concentrations greater than 0.8 mg/L, the samples need to be diluted. The DPC method is commonly used with sample dilution being a general practice. In our studies on COPR remediation [11,17], we are confronted with concentrations exceeding thousand times (>800 mg/L) the concentration limit for the DPC method, leading to very high dilution factors of the samples (up to 2500×). We question to what extend these very high dilutions may decrease the accuracy of the quantification data. Another practical way to measure Cr(VI) in solution is the method of “direct UV–vis spectrometry”, based on the natural color of the chromate ion in solution. Absorbing linearly over a wide range, this method may avoid excessive dilution of the samples. In addition, this direct method is fast and reliable in contrast to the DPC method that needs lengthy preparation of reagents and produces a color complex of limited stability. Few articles are available on measurement of Cr(VI) by direct UV–vis spectrometry. Hug and colleagues [3,4,8] used direct UV–vis spectrometry in kinetic studies where fast redox reactions between Fe(II) and Cr(VI) were investigated. Chromium VI shows charge transfer absorption bands, which differ in acid and alkaline conditions, thus allowing in situ studies of Cr(VI) acid–base speciation. According to their work, protonated Cr(VI) (HCrO4−) has a maximum absorption at 349 nm, whereas chromate (CrO42−) peaks at 373 nm. Hug and colleagues showed that HCrO4−, CrO42−, and Fe(III)–oxalate complexes have characteristic but overlapping spectra. They used a spectral fitting technique to quantitatively evaluate the different species in their system. In studies by Kim and Om [10] and Levitskaia et al. [12], standard solutions were scanned in the range of 300–700 nm. Levitskaia et al. retained the length of 372 nm as the length of maximum absorption, whereas Kim and Om defined the maximum absorption at 363 nm. Precise observation of the absorption curve in Fig. 1 of Kim and Om's work, however, shows that peak absorbance is actually much closer to 350 nm. Kim and Om studied the interference of various ions on Cr(VI) absorption. Common ions such as Na+, K+, NO3−, and Cl− did not affect results up to 1 g/L, SO42− and CO32− did not interfere up to 200 mg/L, whereas Al3+ and Mg2+ had an influence at concentrations greater than 100 and 15 mg/L, respectively. Fournier-Salaün and Salaün [7] used direct UV–vis spectrometry at 371 nm in a method of continuous chromium VI quantification of samples with varying pH values. The method uses molar absorption coefficients of acid and alkaline chromium species and applies a mass balance equation to link total absorption values to species-specific, pH-dependent concentrations. The authors reached good correspondence between initially added and modeled total Cr(VI) concentrations with deviations less than 6.5%. This study was limited to synthetic samples.
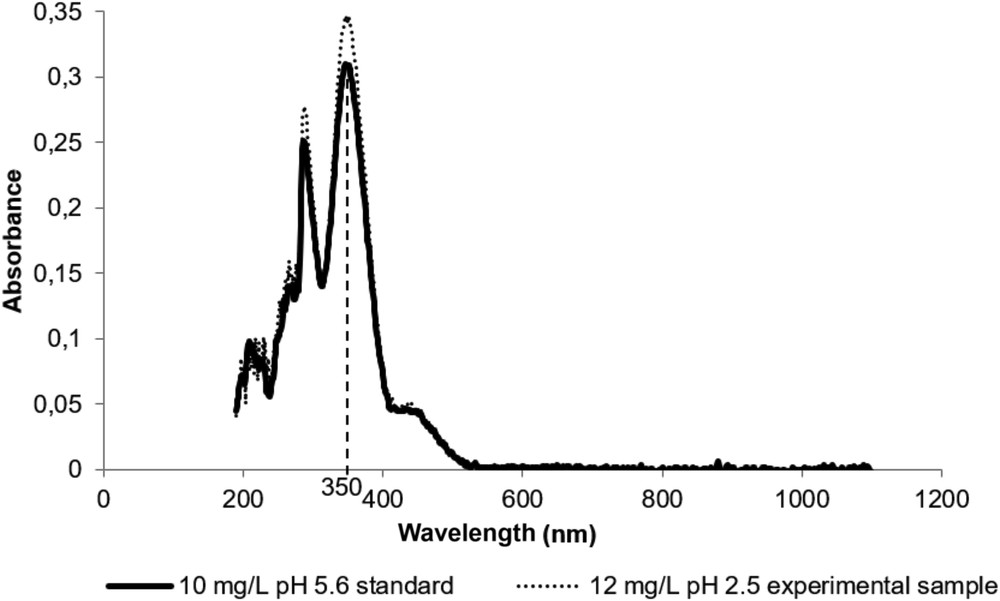
Spectral responses of a 10 mg/L standard solution (continuous line) and a 12 mg/L experimental solution (dotted line). The difference in intensities of the two spectra is due to different concentrations.
Levitskaia et al. used a liquid waveguide capillary cell to quantify very low Cr(VI) concentrations from 7.3 × 10⁻⁵ to 0.1 mg/L by using direct spectrophotometry at 372 nm. They conducted measurements on polluted groundwater samples and confirmed that solution ions including complexing cations did not impair the Cr(VI) analysis. The influence of pH on absorption intensities was treated as in Fournier-Salaün and Salaün for pH values close to the pKa (HCrO4−/CrO42−).
Although previous studies showed that the charge transfer absorption bands of Cr(VI) can be used to define linear calibrations and allow direct quantification of Cr(VI) in solutions, we will focus in this work on the comparison between direct and DPC methods. Emphasis will be on the quantification of high chromium concentrations as encountered in effluents or leachates of chromium processing industries and production residues. The two analytical methods having different calibration ranges, the effect of sample dilution on measurement accuracy will be investigated. Also, to deal with the pH dependency of the charge transfer absorption bands, a simple method is proposed that distinguishes two broad pH domains with specific absorption bands. The overall goal of the study is to propose an accurate, easy to use, direct Cr(VI) quantification method and to define the concentration ranges most adequate for best use of either this or the DPC method.
2 Materials and methods
Light absorbance measurements were conducted using an all-purpose UV–vis spectrophotometer (9400 UviLine Secomam), equipped with a xenon lamp (190–1100 nm). Polymethyl methacrylate (PMMA) cuvettes with a light path of 1 cm were used throughout. All chemicals used were of analytical grade. Potassium dichromate (K2Cr2O7 analytical grade, Sigma Aldrich) was used to prepare a Cr(VI) stock solution of 1 g/L. Standard solutions were made by diluting aliquots of this stock solution with deionized water. Experimental solutions with Cr(VI) were obtained from chromium-enriched waste materials (COPR) by using an electrokinetic leaching technique [11]. The pH was measured using a 781 Methrom pH meter. The DPC method for Cr(VI) determination [16] was conducted following the guide lines of the NF T90-043 standard (France). DPC solution was prepared by mixing 0.02 g of 1,5-diphenylcarbazide with 10 mL ethanol and 40 mL of 1.8 M sulfuric acid. Complete dissolution of the reagent was reached after 1 day by heating at 60 °C or after 2 days without heating. For measurement, 1.2 mL of DPC solution and 0.1 mL of concentrated nitric acid were added to 20 mL of the sample. An intensely colored purple complex appears, originating from the redox reaction between DPC and Cr(VI). Hexavalent chromium is reduced to trivalent chromium thereby forming a Cr(III)–diphenylcarbazone complex, which is color giving [15,16]. However, this complex has a limited stability of about 15 min. Absorption is measured at 560 nm wavelength. Linearity between absorbance and concentration is verified in the concentration range of 0–0.8 mg/L Cr(VI).
The intrinsic color of an aqueous Cr(VI) solution is yellow. To identify the most sensitive Cr(VI) absorption wavelength for direct UV–vis, a 10 mg/L Cr(VI) standard solution of pH 5 was scanned between 190 and 1100 nm wavelengths. A natural Cr(VI) solution obtained by electrokinetic leaching of a COPR sample was also analyzed to check the influence of solution background in the specific system we were investigating.
Another series of scans was performed for standard samples of varying pHs to identify the effect of pH on the wavelength of maximum Cr(VI) absorption. These samples were prepared with a concentration of 10 mg/L of Cr(VI), and acidified (HCl) or basified (KOH) to reach the desired pH. Taking into account the results obtained from the study of pH dependence of absorption maximum, two calibration curves were realized, one at pH 5 and 350 nm wavelength, representative of the acidic environment, and another at pH 10 and 373 nm wavelength for the alkaline environment. We measured 28 samples with concentrations ranging from 0.1 to 120 mg Cr(VI)/L. For the acidic condition, selected standards covering the whole calibration range (5, 10, 50 and 100 mg/L) were measured in 10 replicates and standard deviations were calculated.
Linearity of measurements including dilutions was evaluated for three concentration ranges, 0–0.8, 1–100, and 100–500 mg Cr(VI)/L, and for both analytical techniques. In the range of 0–0.8 mg/L, samples were measured in triplicate, no dilution was applied. The last two ranges implied dilution of samples. For each standard concentration, three aliquots were taken and diluted to different levels, to meet concentrations of 0.1, 0.25, and 0.5 mg Cr(VI)/L for DPC measurements, and 10, 25, and 50 mg/L for direct measurements. Dilution factors varied from 2 to 5000 for the DPC method, and from 1 to 50 for the direct method. Each aliquot was measured in triplicate. A mean concentration was calculated by considering the results from the three dilutions and taking into account the corresponding dilution factors. A standard deviation was obtained by a similar approach. These data were compared with the theoretical standard concentration and the accuracy and precision of the measurement was determined. This study was conducted for acidic conditions to be consistent with the DPC method, which imposes acidic conditions for color formation.
3 Results and discussions
3.1 Absorption maxima
The wavelength of maximal Cr(VI) absorption was recorded by scanning between 190 and 1100 nm (Fig. 1). First, a standard solution of 10 mg Cr(VI)/L with a pH of 5.6 was studied. The second curve in Fig. 1 shows the absorbance of an experimental sample, a leachate from a COPR waste material obtained by electrokinetic extraction. Chromium VI concentrations were 12 mg Cr(VI)/L and pH was 2.5. Ionic strength of this sample was 0.004 mol/L with only inorganic ions present. The absorption curve is similar to that of the standard solution with absorption maxima lying exactly at the same wavelengths despite the much lower pH. The salt content in our environmental samples was very low and no influence on Cr(VI) absorption intensities was noticed, thereby confirming previous works [10,12]. Thus the use of pure standard solutions was adequate for quantification studies of this type of environmental samples. The following discussion will focus on pure standard solutions.
The maximum absorbance wavelength of Cr(VI) absorption lays at 350 nm under the acidic conditions considered in Fig. 1. At 290 nm another peak of charge transfer transition between O and Cr(VI) is observed [2]. According to Subramaniam and Selvi [18], the 210 nm peak is also due to the Cr(VI) compound. However these two absorption bands are narrow and generally not used for Cr(VI) quantification. The observed maximal absorption wavelength of 350 nm is comparable to data by Hug and colleagues [3,4,8] and coincides with Kim and Om's data, reinterpreted [10].
The pKa values for the chromate acid–base couples are, respectively,
| H2CrO4/HCrO4−: pKa1 = 0.75 |
| HCrO4−/CrO42−: pKa2 = 6.4 |
At the pH values investigated (pH 2 and 5.6), Cr(VI) was in the hydrogenated form (HCrO4−), whereas above the pKa2 (pH 6.4), the predominant species is chromate (CrO42−). This change in Cr(VI) speciation with pH is visible by eye by a change in color of the solution from light yellow to more amber yellow and corresponds to a shift in the charge transfer absorption band [8]. Levitskaia et al. [12] and Fournier-Salaün and Salaün [7] also highlighted this effect. The shift is clearly observed in Fig. 2.
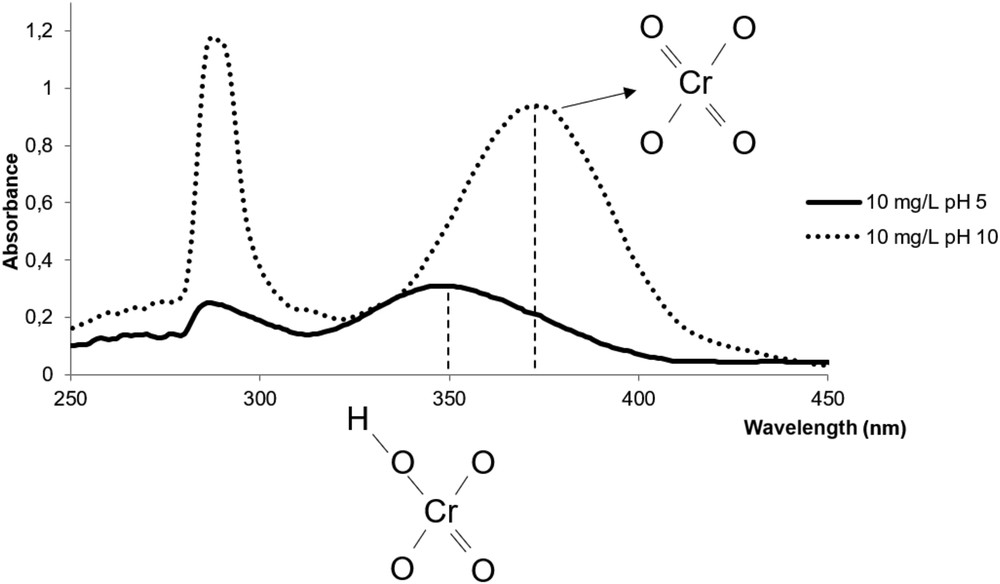
Spectral responses of 10 mg Cr(VI)/L standard solutions at pH 5 and 10, bonding structures of HCrO4− and CrO4−2 ions.
At pH 10, the absorption spectrum reveals two absorption maxima. The peak at 290 nm, related to absorption of Cr(VI) compound due to charge transfer between O and Cr(VI) [2], is unchanged. Maximal absorption of chromate is positioned at 373 nm. Fig. 2 also recalls the absorption spectrum at pH 5, already shown, with maximal absorption of chromium as hydrogenated chromate at 350 nm. The shift in the absorption band from 373 to 350 nm is due to the hydrogen bond responsible for breakage of a double covalent bond between oxygen and the chromium ion. We infer that the photon energy transfer is higher when chromium VI species have two double bonds. Indeed Cr(VI) in the form of CrO42− has higher absorbance and absorbs light with lower energy than HCrO4− or H2CrO4 species. As a consequence, light absorption is stronger under basic conditions than under acidic conditions (Fig. 2), and the linear calibration range may be smaller.
We have studied several solutions covering the full pH range between 2 and 12, verifying that no shifts in absorption bands occur other than the one due to OH bonding. Our data fully agree with the theory thoroughly recalled by Hug colleagues [3,4,8].
3.2 Calibration curves
The pH effect on Cr(VI) light absorption leads us to determine two calibration curves, one for acidic conditions (350 nm) at pH less than 6.4 and another for basic conditions (373 nm) at pH greater than 6.4.
Fig. 3 shows the relation between absorbance and concentration for acidic conditions. Linearity is observed between 0.5 and 100 mg/L, defining the validity interval of the Beer–Lambert law. The linear equation is y = 33.594x with a correlation factor R2 of 0.9993. For concentrations less than 0.5 mg/L (results not shown), absorbance does not respect proportionality. At concentrations greater than 100 mg/L, a shift in slope is observed, which limits the upper end of the valid calibration range. Indeed, at a concentration of 120 mg/L, the difference between standard concentration and measured concentration is about 10%. The precision of the absorption data was evaluated based on selected standards (5, 10, 50, and 100 mg/L) measured in 10 replicates and used to calculate standard deviations. The values obtained were very small, well within the precision range of the spectrophotometer (±0.001 absorbance, equivalent to ±0.034 mg Cr(VI)/L), thus showing very good repeatability of measurements. For the acidic condition, two calibration curves were performed at 2 years interval based on freshly prepared standards. Despite this long time interval, both curves had almost the same slope thus pointing to a very stable concentration–absorption relationship. Indeed, the initial curve had a linear equation of y = 33.275 and an R2 of 0.9998, whereas the second, presented in Fig. 3 and discussed above, had an equation of y = 33.594x and an R2 of 0.9993. We think that the variation of slope of the calibration lines depends primarily on the spectrophotometer characteristics and on the condition of the lamp.
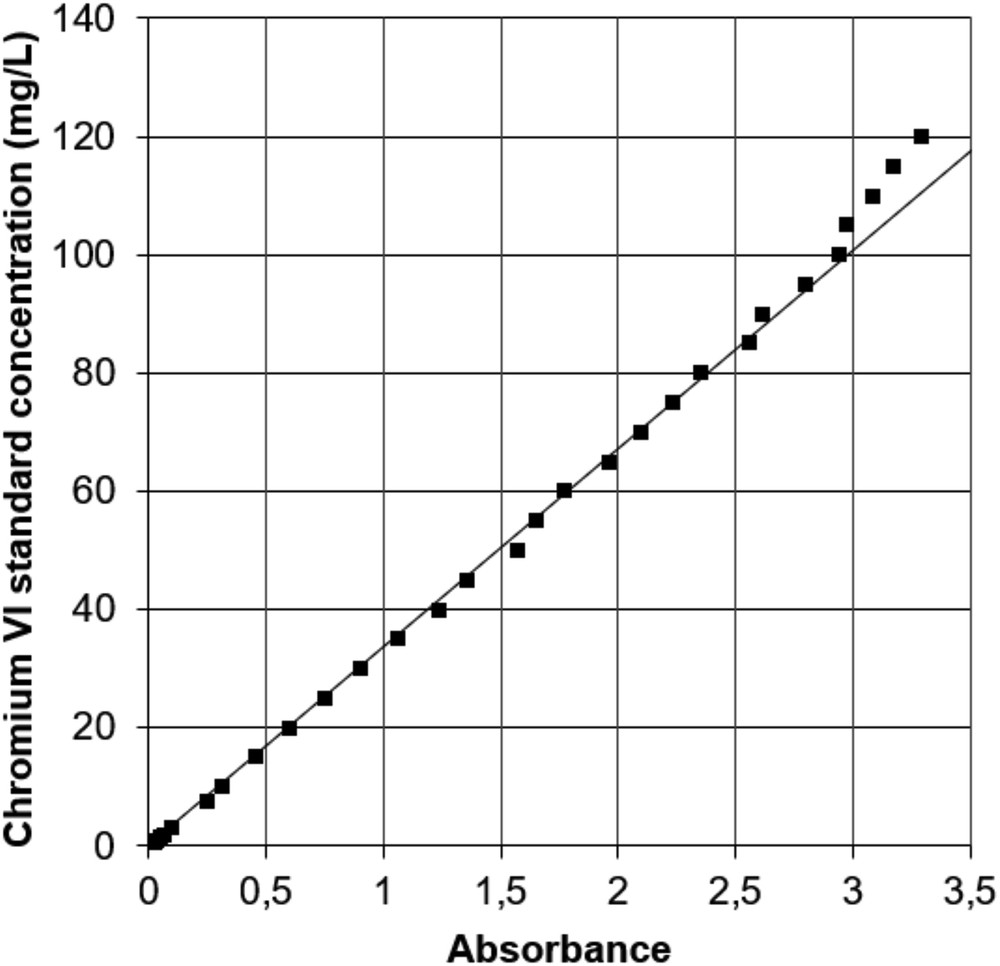
Absorbance at 350 nm wavelength of standard solutions of 0–120 mg Cr(VI)/L in acidic condition at pH 4–5. The straight line corresponds to the calibration line.
Fig. 4 shows the relation between absorbance and concentration for basic conditions (pH 10). Linearity is observed between 0.5 and 25 mg/L, defining the validity range of the Beer–Lambert law. The linear equation is y = 11.019x with a correlation factor R2 of 0.9992. At greater than 25 mg Cr(VI)/L, concentration and absorbance follow an exponential relation. At 30 mg/L, the error between standard concentration and measured concentration is 10%, increasing further with higher concentrations. As for acidic conditions, the lower limit of validity of the Beer–Lambert law lies around 0.5 mg/L.
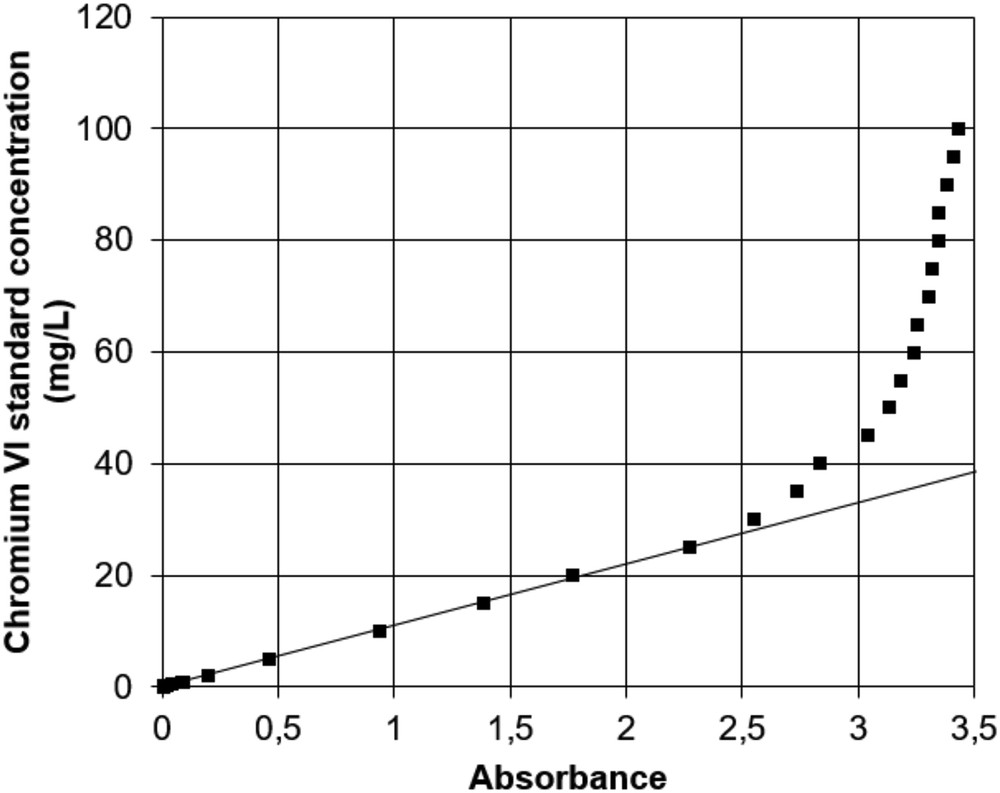
Absorbance at 373 nm wavelength of Cr(VI) standard solutions of 0–100 mg/L at pH 10. The straight line corresponds to the calibration curve.
3.3 Comparison between chromium VI DPC and chromium VI direct quantification
First, a comparison is made between Cr(VI)DPC and Cr(VI)Direct quantification for low concentrations (0–0.8 mg/L). Then, medium and high concentrations (1–100 and 100–500 mg/L) are considered where each sample is diluted at three different levels and a mean concentration value is calculated to check the accuracy of the measurement. The effect of dilution is investigated in both quantification methods.
Data in Fig. 5 for the low concentration interval show very good quantification results for the DPC method. The maximum standard deviation for three replicates is very low (<0.004 mg/L) and the mean values of each sample are very close to the standard. Conversely, the direct method gives erroneous results at a concentration less than 0.5 mg/L. At a concentration greater than 0.5 mg/L, data are more consistent but the standard deviation of the mean is high. In this concentration range, absorbances are very low in the untreated solutions, closely approaching the quantification limit of the instrument. This explains why the direct method does not give reliable results at the low concentrations considered and the DPC method must be preferred. Note that the lower limit of validity of the direct method may be pushed to lower values using a more sensitive spectrometer and using cuvettes with a longer light path (2.5–10 cm instead of 1 cm in this study).
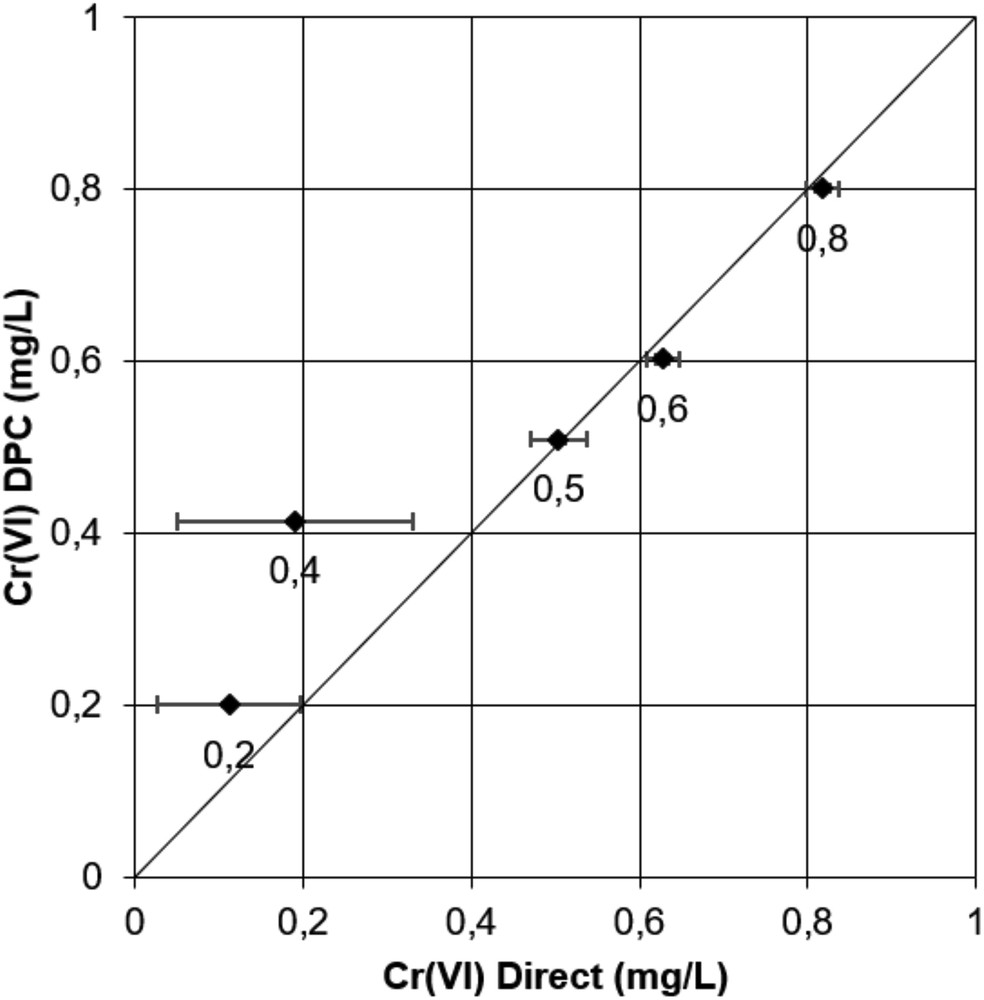
Comparison between Cr(VI)DPC and Cr(VI)Direct quantifications for low concentrations of standard samples (0–0.8 mg/L). Horizontal and vertical bars represent standard deviations of three replicates. Numbers below each dot correspond to standard concentration values.
Data in Fig. 6 show the results for medium concentrations of Cr(VI) in the range of 1–100 mg/L. Quantification by Cr(VI) DPC is satisfactory up to a concentration of 30 mg/L. At this concentration, dilution factors of 60, 120, and 300 were applied to give analytical concentrations between 0.5 and 0.1 mg/L. At concentrations greater than 30 mg/L, inaccurate mean values are observed with up to 20 mg/L divergence from the true value. Also, standard deviations are important, reaching up to 20% of the average values. The weak performances are attributed to random errors introduced by dilution. On the contrary, the Cr(VI) direct method shows accurate results. The maximal divergence between measured and standard value is observed for the 100 mg/L sample; it is, however, as low as 1.8% of the true value.
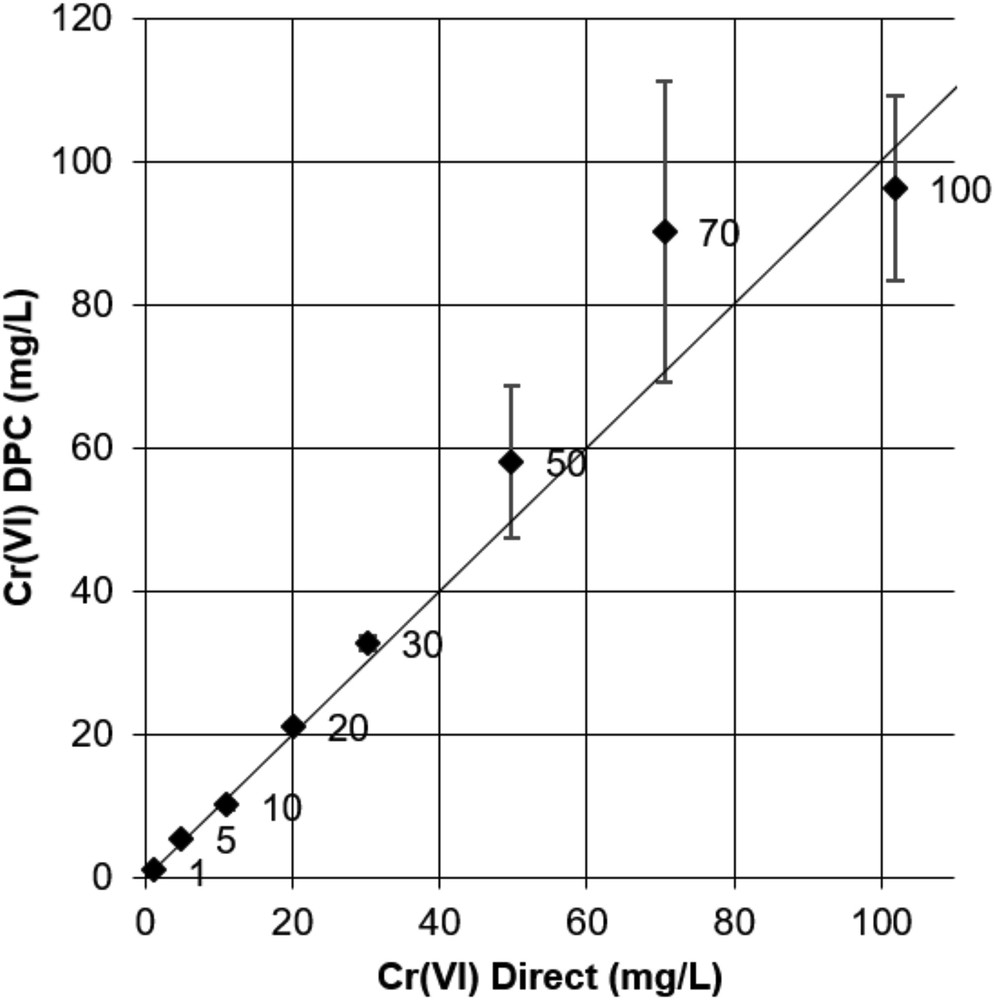
Comparison between Cr(VI)DPC and Cr(VI)Direct quantifications for standard solutions of 1–100 mg/L. Horizontal and vertical error bars represent standard deviations of the mean of three replicates with different dilution factors. Values beside data points correspond to standard concentrations.
For quantitative analysis of concentrations greater than 30 mg/L, the Cr(VI) DPC method has low accuracy, due to dilution factors greater than 300. It appears preferable to use the direct quantification method.
Data in Fig. 7 show the results for high concentrations of Cr(VI) in the range 100–500 mg/L. As concentrations increase, the standard deviation of the Cr(VI) DPC value becomes very large. At 500 mg/L standard concentration, the standard deviation is around 50% of the mean. Also, the mean value is incorrect by as much as 20%. However, no systematic trend is observed for the deviation of the mean from the true value, leading us again to attribute the lack of accuracy to random errors originating from the very high dilution factors needed for the DPC quantification. For the 500 mg/L sample, dilutions of 1000×, 2000×, and 5000× were applied. For Cr(VI) direct quantification, with a calibration range from 0.5 to 100 mg/L, significantly lower dilution factors can be applied, for the 500 mg/L sample they were of 10×, 20×, and 50×. This then explains a significantly better accuracy of results. At 500 mg/L standard concentration, the experimental value was 505.9 ± 2.4 mg/L, thus closely approaching the true value. The direct quantification method is clearly to be preferred over the DPC method for this concentration range.
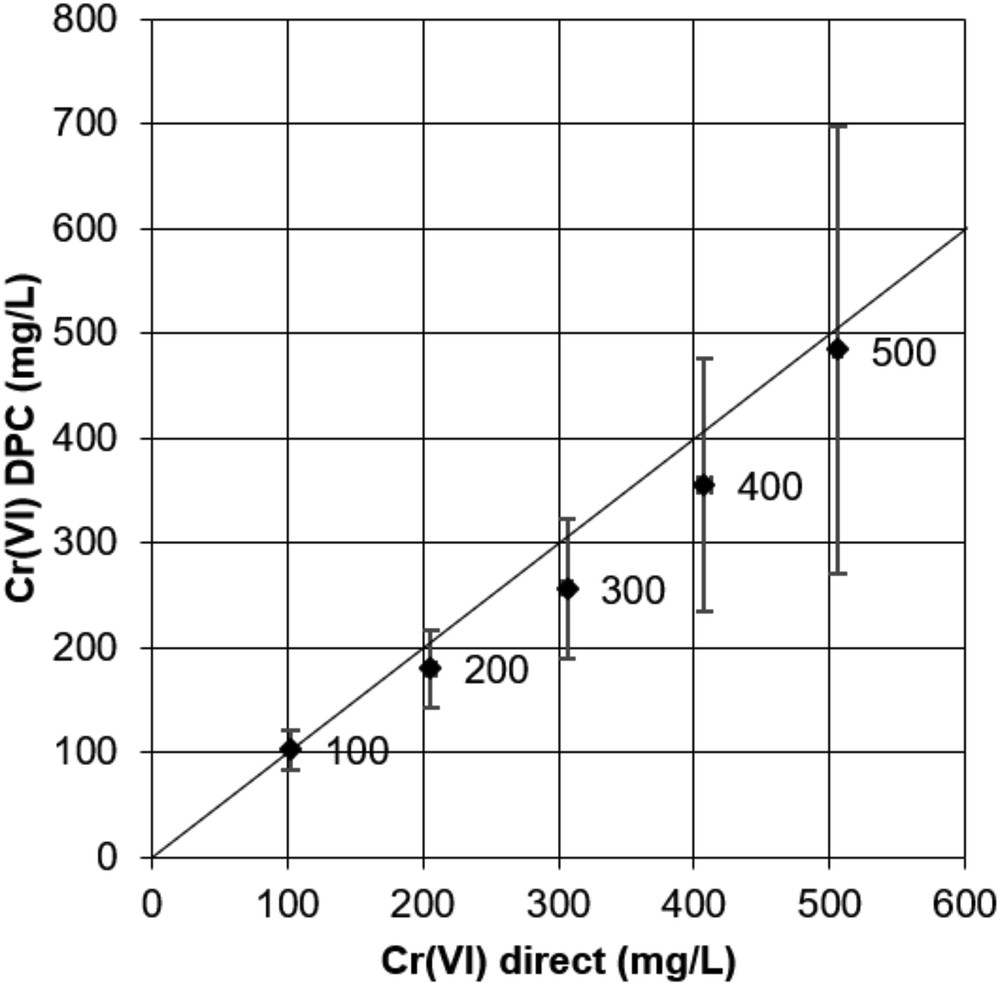
Comparison between Cr(VI)DPC and Cr(VI)Direct quantifications for standard solutions of 100–500 mg/L. Horizontal and vertical error bars represent standard deviations of the mean of three measures with different dilutions. Values beside data points are standard concentrations.
4 Conclusions
In this study, we used the natural yellow color of aqueous Cr(VI) compounds for UV–vis absorption spectrophotometry. Our results show that color intensity follows the Beer–Lambert law over a very wide concentration range. Acid–base speciation of Cr(VI) has an influence on the wavelength of maximum absorption. The pKa2 of 6.4 marks the limit between the acid domain, where maximal absorption wavelength is 350 nm, and the alkaline domain, where 373 nm is the corresponding maximum wavelength. In both domains, color intensity is linear over a wide range from 0.5 to 100 mg/L under acidic conditions and from 0.5 to 25 mg/L under basic conditions, making the method very attractive for application fields such as environmental chemistry of pollution, where the above-mentioned concentration ranges are more realistic than the narrow field of 0–0.8 mg/L valid for the DPC colorimetric method. The wide measuring range avoids extensive dilution of high concentration samples, thereby minimizing random errors and leading to good accuracies of measurements. The method is robust, in that inorganic background ions have no influence on absorption intensity at low and medium ionic strengths. However, in the presence of organometallic complexes in solution, the existence of interferences should be checked. A significant advantage of the Cr(VI) direct method is the use of the intrinsic color of the chromate ion, which guaranties stability in time. The Cr(VI) DPC method, on the other hand, uses the Cr(VI)–DPC complex with limited stability, thus strongly conditioning the timing of measurements and being an easy source of incorrect data.
We strongly recommend to use direct UV–vis spectrophotometry rather than DPC colorimetry for aqueous samples of Cr(VI) concentrations greater than 1 mg/L. In addition to a gain in data accuracy, a gain in data acquisition time and handling facility can be expected as the method does not require any reagent preparation.
Acknowledgments
The French directorate for road infrastructure (DIR-NORD) is acknowledged for funding this research work. The French national agency for environment and energy management (ADEME) and DIR-NORD are acknowledged for supporting the principal investigator, A.S.-H. The authors are grateful to Céline Hebrard-Labit, Gaëtan Lefebvre, and Guillaume Carlier (CEREMA Nord-Picardie) for inspiring discussions. Romain Abraham, Marion Delattre, and Philippe Recourt (LOG, University of Lille) are thanked for their every day presence and help in the laboratory.