

1 Introduction
Ascorbic acid (AA-Vitamin C) is a water-soluble vitamin and acts as an antioxidant in human and mammalian systems. Because humans lack the enzyme gluconolactone oxidase, AA forms an important part of our daily diet. Lack of Vitamin C causes various diseases such as scurvy, anemia, skin hemorrhages, deterioration of collagen, and lowering of body resistance from infections [1]. It is mainly helpful in the treatment of cancer, acquired immune deficiency syndrome (AIDS), infertility, common cold, and mental illness [2]. Dopamine (DA) is an electroactive excitatory neurotransmitter produced from l-Dopa precursor in adrenal glands and some parts of the brain. DA is responsible for some important physiological events such as reward-related behavior, brain–body coordination, and mood [3]. Paracetamol (PCT) is a well-known nonsteroidal drug widely used as an over the counter analgesic and antipyretic agent. It reduces fever and pain by sedating hypothalamic heat-regulating center and inhibiting synthesis of prostaglandins [4]. PCT at nominal therapeutic doses gets easily metabolized to inactive components and is eliminated in urine. However, at higher doses it produces toxic metabolites that accumulate and cause severe nephrotoxicity and hepatotoxicity [5].
AA, DA, and PCT are physiologically related electroactive species, coexisting in biological samples such as human blood plasma. Therefore, determination of these species is of high analytical significance with applications toward pharmaceuticals, diagnostics, biomedical, and pathological research. Several methods have been reported for determination of AA, DA, and PCT such as high-performance liquid chromatography (HPLC) [6,7], UV–Vis spectrophotometry [8–10], electrophoresis [11,12], chemiluminescence [13–15], and fluorescence [16–18]. However, most of the techniques are complicated, expensive, time consuming, require extensive sample preparation, specialized equipment, and trained staff [19]. On the contrary, electrochemical method is a good alternative and offers many advantages such as low cost, rapid response, ease of operation, miniaturization, onsite monitoring, and low sample volume requirements [20]. Among various electroanalytical techniques, differential pulse voltammetry (DPV) has gained huge importance because of its high sensitivity and selectivity in electrochemical detection offering low detection limits, coupled with elimination of capacitive currents, high precision, and simplicity.
AA, DA, and PCT can be individually determined using different modified electrodes reported in the literature. It is also important to determine each of the analyte in the presence of other two analytes because they coexist with each other. But the caveat in determining each analyte in the presence of other(s) is the overlapping electrochemical signals of the rest of the analytes. Moreover, electrode fouling is an important factor resisting the sensitivity, selectivity, and reproducibility on bare electrode surface [21]. Therefore, it becomes essential to separate the electrochemical signals of AA, DA, and PCT and improve the sensitivity of the sensor for their individual determination in the presence of a mixture of analytes. On account of this, many modified electrodes have been developed to determine selectively either two or all of the analytes consisting of AA and/or DA and/or PCT. Peik-See et al. [22] have developed iron oxide/reduced graphene oxide–modified glassy carbon electrode (GCE) toward the electrochemical determination of AA and DA in the presence of each other. Dalmasso et al. [23] have used multiwalled carbon nanotubes (MWCNTs) dispersed in polyhistidine-modified GCE for the electrochemical determination of each of the analyte (AA and PCT) in presence of the other. Kannan and Sevvel [24] made use of poly-4-amino-6-hydroxy-2-mercaptopyrimidine (Poly-AHMP) film-modified GCE for the electrochemical determination of DA and PCT in the presence of each other. Biswas et al. [25] have developed nitrogen-doped porous graphitic carbon for electrochemical determination of AA and PCT in the presence of each other with good sensitivity and selectivity. But none of them have hitherto used pristine platinum nanoparticle (PtNPs)-decorated graphene nanosheets for the determination of AA, DA, and PCT in presence of each other.
Recently, graphene has been attracting tremendous attention from scientific community on account of its extraordinary physicochemical properties such as high surface area, excellent electrical conductivity, high mechanical and chemical stability [26]. Graphene has been found in many potential applications such as batteries, supercapacitors, field-effect transistors, solar cells, chem/biosensors to name a few, owing to its superior properties [27]. Graphene has gained significant importance in view of electrochemical sensing of various chemical and biological compounds since the establishment of chemical methods for its production [28]. Moreover, the catalytic properties of graphene can be further enhanced by combining it with noble metal nanoparticles to form graphene-based noble metal nanoparticle nanocomposites [29]. These nanocomposites exhibit the synergistic physicochemical properties of the individual entities along with certain novel properties that can be better applied in developing various electrochemical sensors demonstrating high electroactive surface area, increased catalytic activity, reduction in overpotential, and enhanced charge transfer ability between the analyte and the transducer element [30]. A combination of these helps in multiplex detection of analytes in complex biological samples.
In the present study, we have synthesized pristine PtNPs and decorated on graphene to form graphene platinum nanoparticles (GPtNPs) nanocomposite. The nanocomposite was coated on GCE and used for the electrochemical determination of AA, DA, and PCT in the presence of each other. Fig. 1 illustrates the pristine PtNPs-decorated graphene used for the electrochemical determination of AA, DA, and PCT.
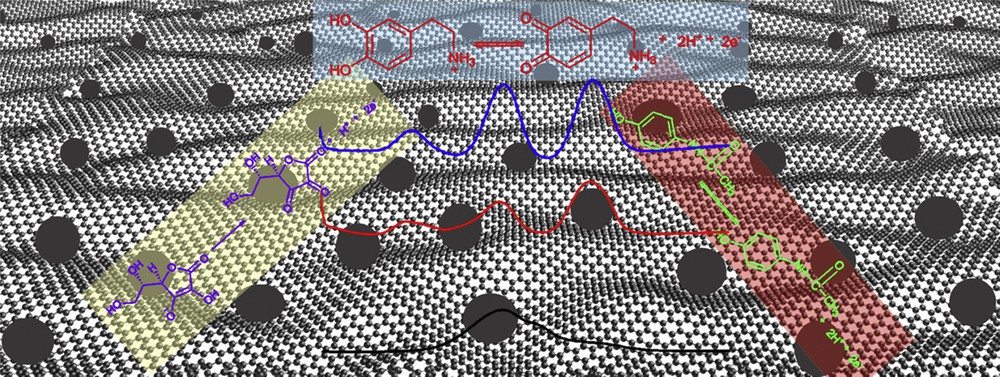
Pristine PtNPs–decorated graphene toward the electrochemical determination of AA, DA, and PCT in the presence of each other.
2 Experimental section
2.1 Reagents
Graphene was procured from graphene supermarket. AA, DA, PCT, platinum acetylacetonate (Pt(acac)2), oleylamine, and borane tert-butylamine complex were obtained from Sigma Aldrich. Sodium phosphate monobasic, sodium phosphate dibasic, sodium hydroxide, and hydrochloric acid reagents were of analytical grade. Milli-Q Millipore water with resistivity of 18.2 MΩ·cm was used all throughout the experiments.
2.2 Characterization
The morphological and topographical aspects of GPtNPs nanocomposite were analyzed by using field-emission scanning electron microscopy (FESEM) and transmission electron microscopy (TEM). FESEM images along with the energy-dispersive X-ray spectroscopy (EDX) spectra of GPtNPs nanocomposite were obtained using FESEM-Zeiss. TEM images were obtained by using Hitachi H-7650. UV–Vis spectral measurements were done using a Shimadzu 2450PC UV–Vis spectrophotometer. The phase composition of graphene, PtNPs, and GPtNPs was studied using a PANalytical X'Pert Pro MPD X-ray diffractometer with the following settings: current, 30 mA; voltage, 45 kV; configuration, theta-theta; scan rate, 2°/min. The spectrum of the GPtNP nanocomposite using X-ray photoelectron spectroscopy (XPS) was obtained using an S-probe TM 2803 instrument.
2.3 Electrochemical measurements
Electrochemical measurements were conducted using an Ivium CompactStat electrochemical workstation with IviumSoft user interface for monitoring the electrochemical parameters. Conventional three-electrode setup consisting of GCE as working electrode, Pt wire as auxiliary electrode, and Ag/AgCl (in 3 M NaCl) as reference electrode was used for all of the measurements. Cyclic voltammetry (CV) measurements were acquired at a scan rate of 50 mV/s, unless specifically mentioned. DPV measurements were performed with the following parameters: pulse amplitude, 70 mV; pulse time, 50 ms; Estep, 5 mV; and scan rate, 20 mV/s.
2.4 Synthesis of PtNPs
PtNPs were synthesized by following an earlier reported procedure [31]. Under nitrogen atmosphere and constant stirring, 50 mg of Pt(acac)2 was dispersed in 15 mL of oleylamine present in the round-bottomed flask. The solution was then heated to 100 °C in 20 min resulting in the formation of yellow colored solution. At this point, 200 mg of borane tert-butylamine complex dissolved in 3–4 mL of oleylamine was quickly injected into the reaction mixture. Then, the temperature was gradually increased from 100 to 120 °C at the rate of 2 °C/min. The reaction mixture was kept at this temperature for 1 h resulting in the formation of PtNPs. The solution was then allowed to cool and reach the room temperature followed by the addition of 30 mL ethanol. The reaction mixture was centrifuged at 9000 rpm for 8 min to isolate the PtNPs.
2.5 Preparation of the GPtNPs nanocomposite
Graphene and PtNPs (10 mg each) were dispersed in 20 mL of hexane and sonicated for 2 h to ensure uniform decoration of PtNPs on graphene nanosheets. The mixture was later centrifuged at 9000 rpm for 8 min. The residue was then washed twice with ethanol and dispersed in 15 mL of glacial acetic acid followed by heating at 70 °C for 10 h to remove oleylamine capping agent [32]. It helps in the generation of pristine PtNPs-decorated graphene nanocomposite. The nanocomposite was later separated from acetic acid by centrifugation at 9000 rpm for 8 min, followed by washing twice with ethanol.
2.6 Preparation of graphene and GPtNPs nanocomposite ink-modified GCE
Before modification, bare GCE was polished successively with 0.3 and 0.05 μm alumina slurries. After polishing each electrode was sonicated for 1 min in water for removing the fine particles of alumina powder present on the surface of GCE. The electrode was finally sonicated in ethanol and air dried at room temperature. Graphene and GPtNPs catalytic inks were prepared by mixing 1:3 isopropanol and water to obtain 2 mg/mL catalytic ink. About 10 μL of the catalytic ink was drop casted on clean GCE and air dried to obtain catalyst (graphene or GPtNPs)-modified GCE.
3 Results and discussion
3.1 Characterization of GPtNPs nanocomposite
The morphology, skeleton, and topography of GPtNPs nanocomposite analyzed by using FESEM and TEM are presented in Fig. 2. Images obtained from both the instruments at different regions and magnifications clearly indicate the uniform distribution of PtNPs on graphene nanosheets. Fig. 2(a and b) indicates the distribution of wrinkled graphene in the form of an entangled silk veil spread on the indium tin oxide (ITO) substrate. EDX spectrum of it presented in Fig. S1(a) exhibits the presence of carbon. The conspicuous distribution of PtNPs on graphene nanosheets is clearly evident from Fig. 2(c–f). Similarly, the EDX spectrum of GPtNPs (Fig. S1b) demonstrated the peaks for platinum along with carbon, further confirming the presence of PtNPs on graphene nanosheets. Silicon peaks in the spectrum arise because of the ITO-coated glass substrate. The elemental analysis of graphene and GPtNPs (consisting of the atomic and weight percentages of C, O, and Pt atoms) are presented in Table 1 and Table S1, respectively. Fig. 2(e and f) presents the TEM images of PtNPs loaded on graphene nanosheets. The UV–Vis spectra of graphene, PtNPs, and GPtNPs are presented in Fig. 3(a). The 270 nm absorption peak for graphene indicates the π–π∗ electronic transition of sp2 hybridized CC bonds in graphene nanosheets [33]. PtNPs demonstrated an absorption peak in the UV region and is in tune with the literature [34]. GPtNPs also showed an absorption peak corresponding to graphene at 270 nm and PtNPs. An XPS spectrum provides only surface characteristics but not the bulk property because the depth of the analysis is only 10 nm. The survey XPS spectrum of GPtNPs nanocomposite presented in Fig. 3(b) does not have other peaks except for C, O, and Pt indicating the high purity of the synthesized nanocomposite. High-resolution Pt4f spectrum exhibited doublet peaks at 70.36 and 73.86 in Fig. S2(a) corresponding to the spin–orbit splitting of Pt4f7/2 and Pt4f5/2 [35]. These peaks indicate the presence of metallic platinum confirming the successful reduction of Pt(II). Deconvolution of C 1s spectra (Fig. S2b) demonstrated signatures corresponding to CC/CC, CO, and OCO functionalities at 284.3, 285.9, and 288.27 eV, respectively [36]. O 1s spectra (Fig. S2c) demonstrated peaks at 531.55 and 532.77 eV corresponding to OCO and CO, complementing the information provided by C 1s spectra [37]. Fig. 3(c) depicts the X-ray diffraction (XRD) spectra of graphene, PtNPs, and GPtNPs nanocomposite. A weak peak at 24.2° represents the characteristic (002) diffraction peak of graphene with a d spacing of 3.4 Å [38]. Both PtNPs and GPtNPs demonstrated diffraction peaks at 40.04°, 46.44°, and 67.4° corresponding to the (111), (200), and (220) crystal planes of face-centered cubic lattice of PtNPs [35].
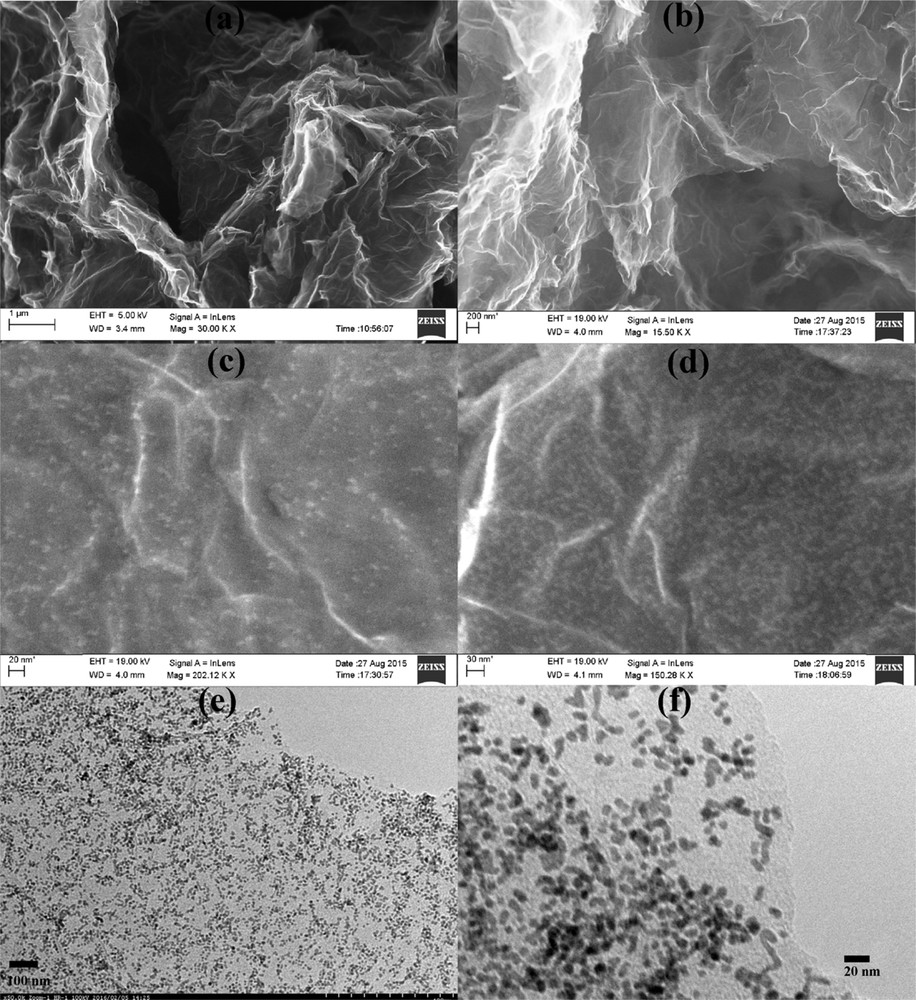
(a, b) FESEM images of wrinkled graphene nanosheets spread on ITO substrate. (c, d) FESEM images of PtNPs-decorated graphene nanosheets. (e, f) High-resolution TEM images of the GPtNPs nanocomposite.
Elemental analysis of GPtNPs, obtained from the EDX spectrum, demonstrating the atomic and weight percentages of C, O, and Pt atoms.
| Element | Weight percentage | Atomic percentage |
| C K | 73.24 | 89.95 |
| O K | 9.49 | 8.75 |
| Pt M | 17.28 | 1.31 |
| Total | 100.00 |
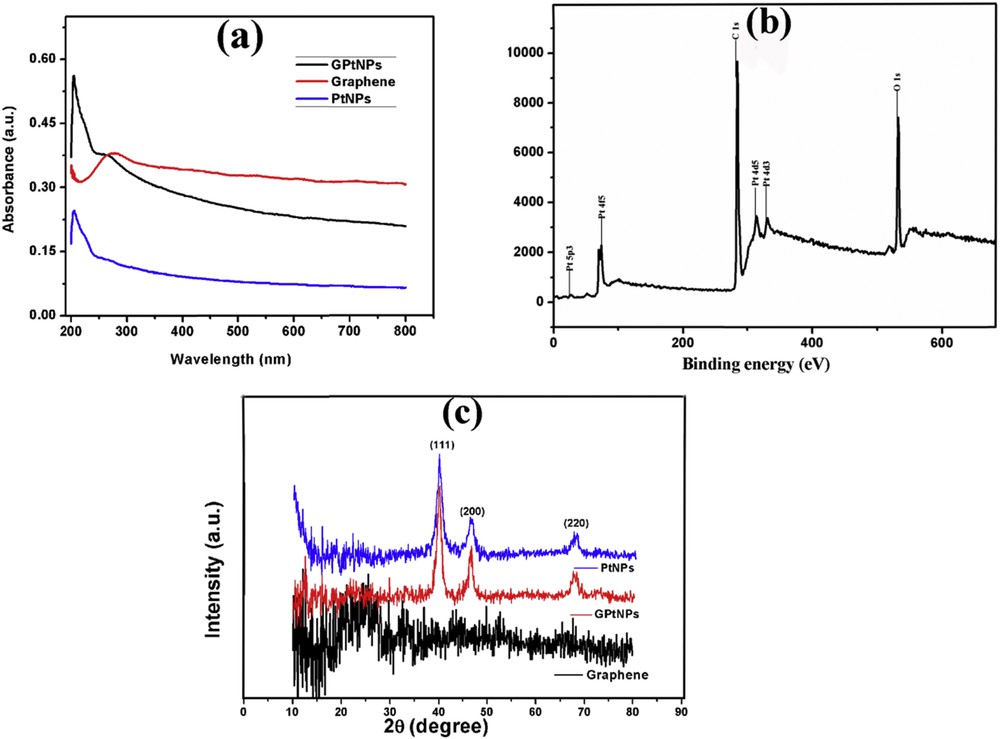
(a) UV–Vis spectra of graphene, PtNPs, and GPtNPs nanocomposite. (b) XPS survey spectrum of the GPtNPs nanocomposite showing peaks corresponding to C, O, and Pt. (c) XRD spectra of graphene, PtNPs, and GPtNPs nanocomposite. PtNPs and GPtNPs demonstrating characteristic peaks for face-centered cubic platinum.
3.2 Scan rate study
The effect of scan rate on the redox behavior of the analyte demonstrates the kinetic and mechanistic aspects. Fig. S3(a, c, and e) represents the CVs recorded for the increasing scan rates of 5 mM AA, 1 mM DA, and 100 μM PCT on GPtNPs modified GCE ranging from 20 to 1,000, 20–900, and 20–1000 mV/s, respectively. The redox peaks of AA and DA exhibited linearity plots with respect to square root of the scan rate, whereas PCT exhibited linearity versus scan rate. This indicates that the charge transfer process occurring for the electro-oxidation of AA and DA is diffusion controlled, whereas in the case of PCT it is adsorption controlled [39]. The linearity plots corresponding to Ipa versus scan rate or square root of scan rate for AA, DA, and PCT are presented in Fig. S3(b, d, and f), respectively. Moreover, with increasing scan rates, the ΔEp values increased for DA indicating the quasi-reversible nature of the analyte. The reduction peak of AA is not as clear as its oxidation peak indicating the irreversible electrochemical behavior of the analyte. On the other hand, PCT exhibited quasi-reversible electron transfer behavior.
3.3 Electrochemical behavior of modified electrodes in Fe[(CN)6]3−/4− solution
CVs demonstrating the electrochemical behavior of bare GCE, G-GCE, and GPtNPs-GCE recorded in 5 mM [Fe(CN)6]3−/4− with 0.1 M KCl as supporting electrolyte are presented in Fig. 4(a). It demonstrates the oxidation and reduction peaks of Fe2+ and Fe3+, respectively. The anodic peak currents for bare GCE, G-GCE, and GPtNPs-modified GCE were found to be 12.54, 17.18, and 19.57 μA, respectively. GPtNPs-GCE demonstrated highest current response followed by G-GCE and bare GCE. Moreover, the peak-to-peak separation (ΔEp) is minimal for GPtNPs followed by G and bare GCE indicating the rapid electron transfer occurring on the modified electrodes, in the following order: GPtNPs-GCE > G-GCE > bare GCE. Therefore, it is clear from the aforementioned result that GPtNPs exhibit higher catalytic activity and rapid electron transfer as compared with G-GCE and bare GCE.
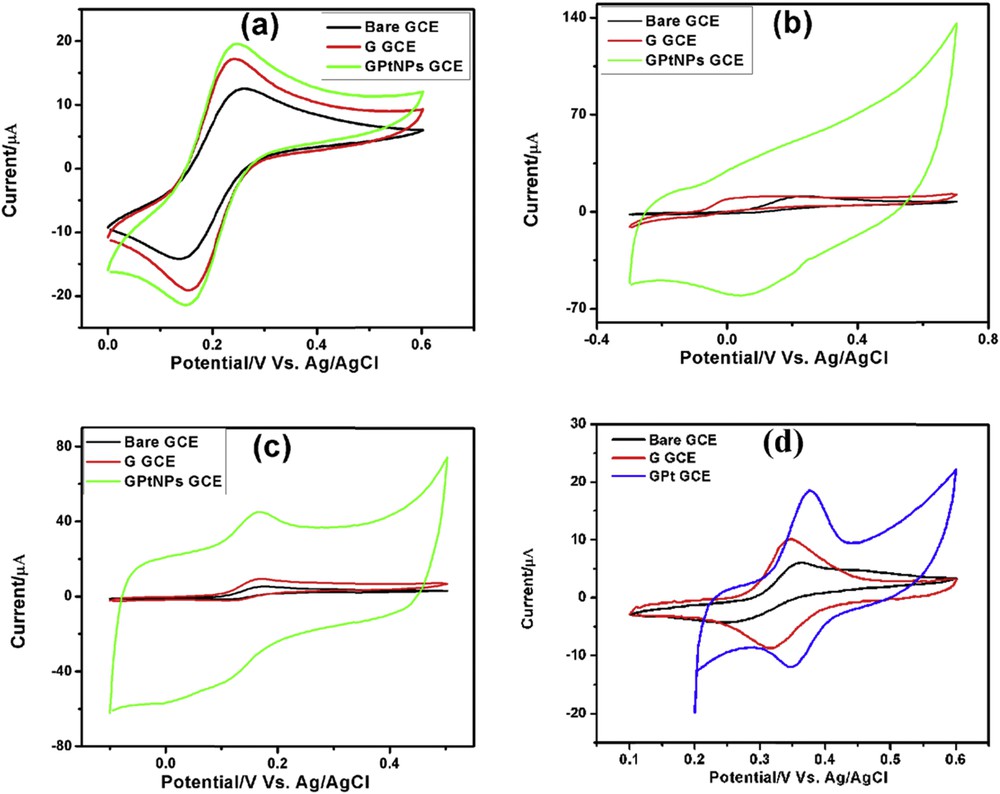
CVs of bare GCE, G-GCE, and GPtNPs-modified GCE demonstrating electrochemical behavior in (a) 5 mM Fe[(CN)6]3−/4− redox couple solution with 0.1 M KCl as supporting electrolyte. (b) 5 mM AA, (c) 1 mM DA, and (d) 1 mM PCT in PBS (pH = 7.4) at 50 mV/s scan rate.
3.4 Electrochemical behavior of AA, DA, and PCT on different modified electrodes
The electrochemical behavior of 5 mM AA on different modified GCEs has been presented in Fig. 4(b). Bare GCE, G-GCE, and GPtNPs-GCE showed irreversible oxidation toward AA. GPtNPs-modified GCE showed three times increase in current when compared with bare GCE, confirming the excellent electrocatalytic activity of GPtNPs-GCE. Moreover, there is a huge reduction in overpotential from 0.23 V of bare GCE to 0.13 V of G-GCE and finally to 0.06 V of GPtNPs-modified GCE. Electro-oxidation of 1 mM DA on various modified electrodes has been presented in Fig. 4(c). All of the three electrodes exhibited quasi-reversible electro-oxidation toward DA. GPtNPs-GCE showed nine times enhanced current than bare GCE. CVs of the modified electrodes recorded toward the electrochemical oxidation of 1 mM PCT has been presented in Fig. 4(d). It exhibited quasi-reversible electro-oxidation on the modified electrodes. GPtNPs showed two times enhanced current along with reduction in ΔEp value when compared with bare GCE indicating the rapid electron transfer between the transducer and PCT.
The enhanced electrochemical activity of GPtNPs-GCE can be attributed to (1) high surface area to volume ratio of pristine PtNPs with relatively more number of catalytically active sites exposed, coupled with the easy approach of the analyte toward the catalyst-modified GCE resulting from the removal of oleylamine capping agent through acetic acid wash [21,40–42]. (2) Enhanced conductivity of graphene along with its high surface area leading to rapid electron transfer and increased electrocatalytic activity [43]. (3) π–π stacking interaction of aromatic rings of the analytes with that of the aromatic rings corresponding to graphene nanosheets [44].
3.5 Electrochemical behavior of AA, DA, and PCT in a ternary mixture
Because AA, DA, and PCT are physiologically related species and coexist with each other in human physiological fluids their selective determination is of high analytical significance. Therefore, electrochemical behavior of AA, DA, and PCT was studied in ternary mixture solution using bare GCE, G-modified GCE, and GPtNPs-modified GCE. The results obtained are presented in Fig. 5. DPV of Bare GCE (Fig. 5b) demonstrated a broad peak corresponding to the oxidation of AA, DA, and PCT. Although, G-modified GCE exhibited clear separation of peaks with a bit of overlap for AA and DA, GPtNPs-modified GCE demonstrated a clear and distinct peak-to-peak separation for the oxidation of AA, DA, and PCT with enhanced currents. The peak-to-peak separations among AA–DA, DA–PCT, and AA–PCT were found to be 218.0, 218.0, and 436.0 mV, respectively. The resolution results of a GPtNPs nanocomposite presented in Table 2 are much better when compared with that of other modified electrodes from the literature. Similarly, CV of bare GCE exhibited an overlap of peaks for AA, DA, and PCT, whereas GPtNPs-modified GCE showed distinct peak separation (Fig. 5a). Therefore, GPtNPs-modified GCE demonstrated clear separation of peaks with enhanced peak currents indicating the ability of the modified electrode to determine each of the analyte in the presence of the other.
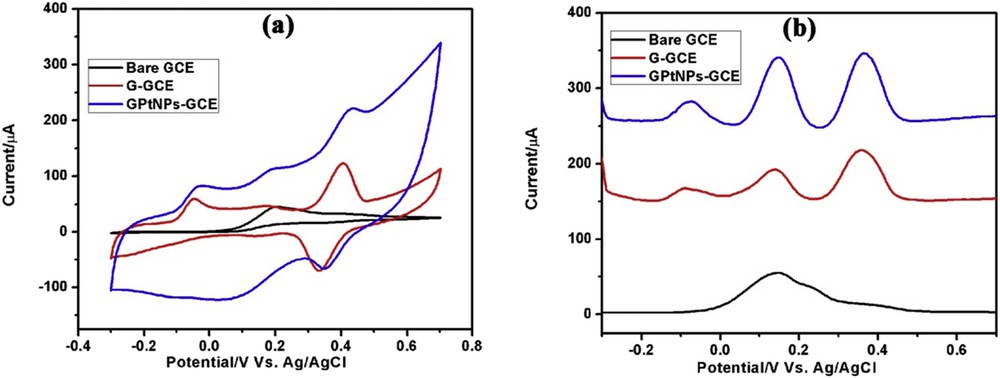
(a) CVs and (b) DPVs of bare GCE, G-GCE, and GPtNPs-GCE toward the electrochemical oxidation of ternary mixture containing AA, DA, and PCT in PBS (pH = 7.4). CV scan rate = 50 mV/s.
Comparison of the peak-to-peak resolution among AA, DA, and PCT with that of the values obtained from the other modified electrodes of literature.
| Modified electrode | Peak Resolution (mV) | Reference | ||
| AA–DA | DA–PCT | AA–PCT | ||
| Modified GCE (0.5 M NaOH solutions) | 165 | [47] | ||
| ERGO/GCE | 240 | [3] | ||
| Try-GR | 182 | [39] | ||
| MWCNT/CCE | 205 | [49] | ||
| MWCNT/GO-GCE | 204 | [20] | ||
| SWCNT/CCE | 197 | [50] | ||
| f-MWCNT-GCE | 182 | [51] | ||
| PyC films | 225 | [52] | ||
| BDDE | 220 | [54] | ||
| SWCNT/CCE | 364 | [55] | ||
| BDD electrode modified with Nafion and lead films | 430 | [56] | ||
| Carbon nanotube paste electrode | 350 | [58] | ||
| Thionine immobilized MWCNT-CPE | 303 | [60] | ||
| GCE/MWCNT–Polyhis | 397 | [23] | ||
| Pd nanocluster-coated polyfuran | 262 | 165 | 427 | [61] |
| GPtNPs-GCE | 218.0 | 218.0 | 436.0 | This work |
3.6 pH study
The influence of pH on the redox behavior of 5 mM AA, 1 mM DA, and 1 mM PCT is presented in Fig. S4(a, c, and e), in the pH range 1–8, respectively. Both anodic peak currents (Ipa) and anodic peak potentials (Epa) of the analytes were affected by the solution pH. The negative shift in Epa in a linear fashion with increasing pH validates the involvement of protons in the redox process. This in turn indicates that the electro-oxidation reaction of the analytes involve the electron transfer reaction followed by proton transfer process [44]. Fig. S4(b, d, and f) presents the linearity plots for Epa versus pH corresponding to AA, DA, and PCT, respectively. The slope values of pH versus Epa were found to be around −50 mV/pH for DA and PCT, whereas AA exhibited a slope value of −45 mV/pH. DA and PCT closely follow the Nernst equation, validating the involvement of equal number of electrons and protons in the electro-oxidation reaction. Literature proves that the electro-oxidation of DA and PCT is a two-electron process indirectly indicating the involvement of two protons in the reaction process. Although for AA, the slope value of pH versus Epa is lower when compared with the Nernst equation suggesting the involvement of less than one proton in the electro-oxidation reaction [44]. The mechanisms of electro-oxidation of AA, DA, and PCT on GPtNPs-modified GCE are presented in Schemes 1, 2, and 3, respectively, in Supporting information [45,46].
3.7 Electrochemical determination of AA, DA, and PCT
3.7.1 CV determination of AA, DA, and PCT
CV determination of AA, DA, and PCT was carried out in 0.1 M phosphate-buffered saline (PBS; pH = 7.4) using GPtNP- modified GCE. Fig. 6(a, c, and e) depicts the increasing current response of AA, DA, and PCT, respectively, with increasing concentration. Each analyte demonstrated either two or three linearity ranges. In the case of AA (Fig. 6b), first linearity segment was from 300 μM to 20.89 mM and the second linearity segment was from 22.02 to 39.87 mM. The first and second linearity ranges for DA corresponds to 5–104 and 114–684 μM, respectively (Fig. 6d). Similarly, first, second, and third linearity segments for PCT (Fig. 6f) were identified to be 10–110 μM, 140 μM to 2.52 mM, and 2.69–3.89 mM, respectively. The CV detection limits of AA, DA, and PCT were found to be 300, 5, and 10 μM, respectively. The linearity segments along with linear regression equations, correlation coefficients, and detection limits for AA, DA, and PCT are presented in Table S2.
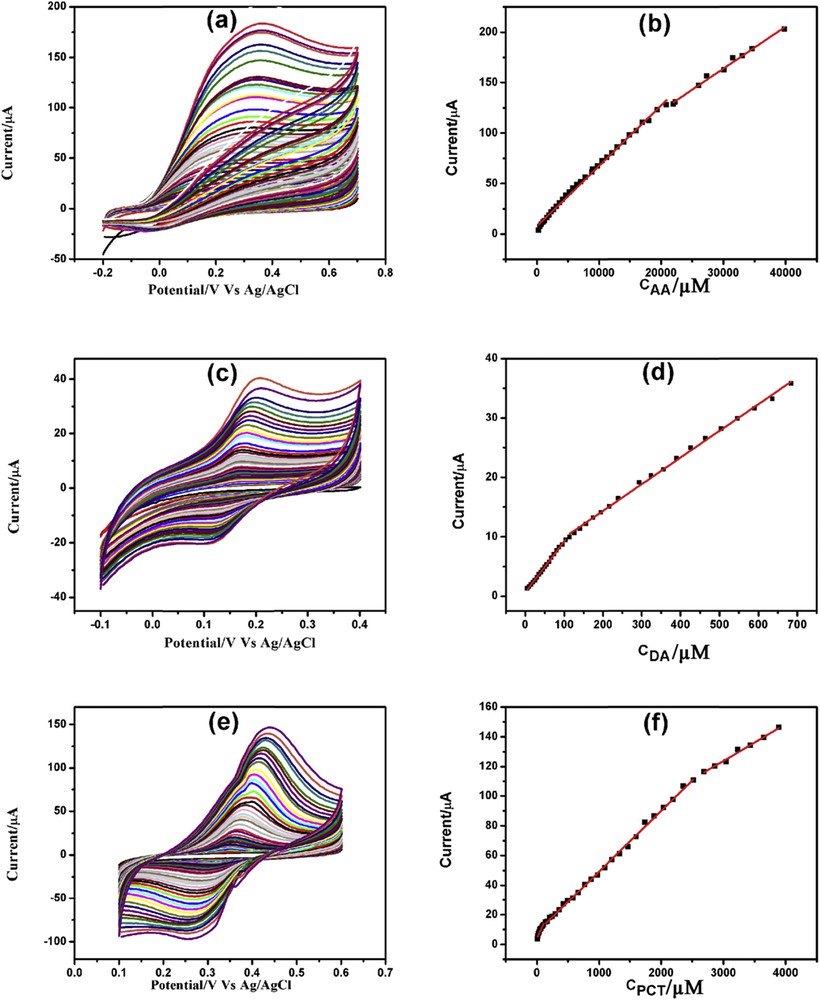
CVs of increasing concentration of (a) AA, (c) DA, and (e) PCT with corresponding linearity plots (b), (d), and (f), respectively.
3.7.2 Chronoamperometry determination of AA, DA, and PCT
The advantages of chronoamperometry (CA) over voltammetric methods are its high sensitivity, specific individual determination of an analyte at a particular potential, ease of automation, stable, and reproducible current response. CA was used for the individual determination of AA, DA, and PCT at 0.0, 0.2, and 0.5 V versus Ag/AgCl, respectively, in 0.1 M PBS (pH = 7.4) as supporting electrolyte.Fig. 7(a, c, and e) depicts CA of increasing concentrations of AA, DA, and PCT on GPtNPs-modified GCE. AA, DA, and PCT showed increasing currents with increasing concentration of the analytes with linearity plots ranging from 420 μM to 29.26 mM (Fig. 7b), from 10 to 600 μM (Fig. 7d), and from 20 μM to 6.43 mM (Fig. 7f), and detection limits of 420, 10, and 20 μM, respectively. The linearity segments, linear regression equations, correlation coefficients, and detection limits are presented in Table S3.
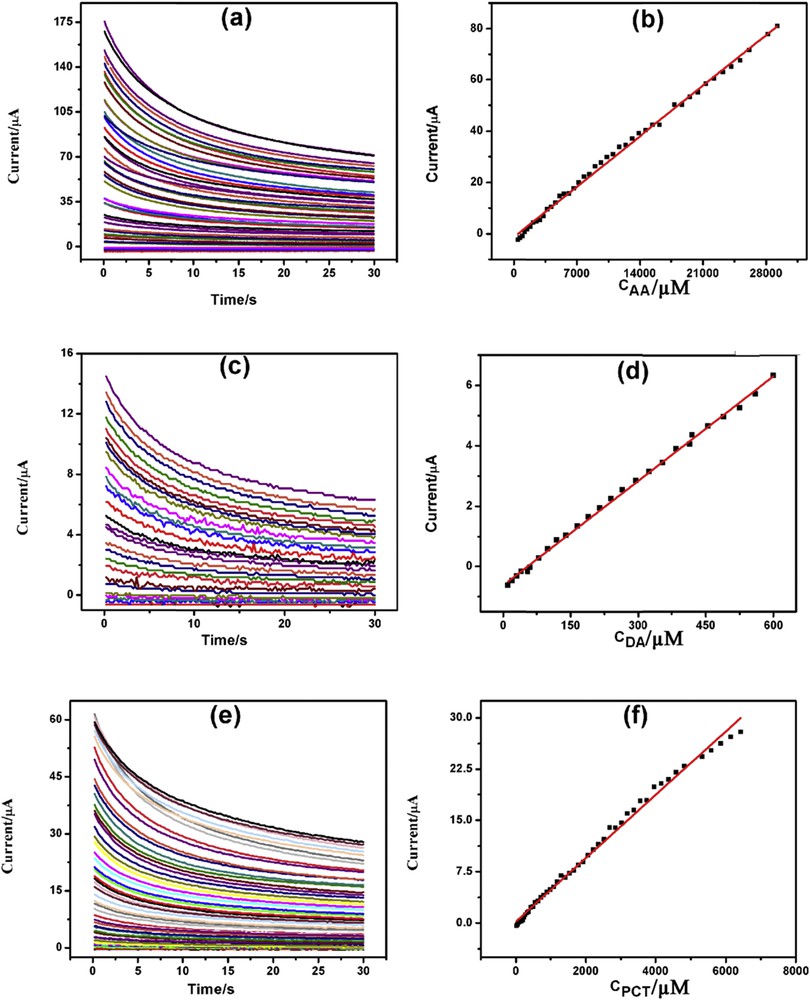
CAs of increasing concentration of (a) AA, (c) DA, and (e) PCT with corresponding linearity plots (b), (d), and (f) respectively.
3.7.3 DPV determination of AA, DA, and PCT
More sensitive technique DPV was used for the electrochemical determination of AA, DA, and PCT. Fig. 8(a, c, and e) depicts the DPV determination of AA, DA, and PCT, respectively, in 0.1 M PBS (pH = 7.4). AA demonstrated two linearity segments first one from 300 μM to 7.36 mM and second one from 8.12 to 39.87 mM (Fig. 8b). DA also showed two linearity segments one from 5 to 118 μM and the other one from 130 to 486 μM (Fig. 8d). Similarly, the linearity plots for PCT were from 5 to 75, 95 to 195 μM and from 265 μM to 1.89 mM (Fig. 8f). DPV detection limits for AA, DA, and PCT were found to be 300, 5, and 5 μM respectively. The linearity plots, linear regression equations, correlation coefficients, and detection limits for the individual determination of AA, DA, and PCT through DPV are presented in Table S4.
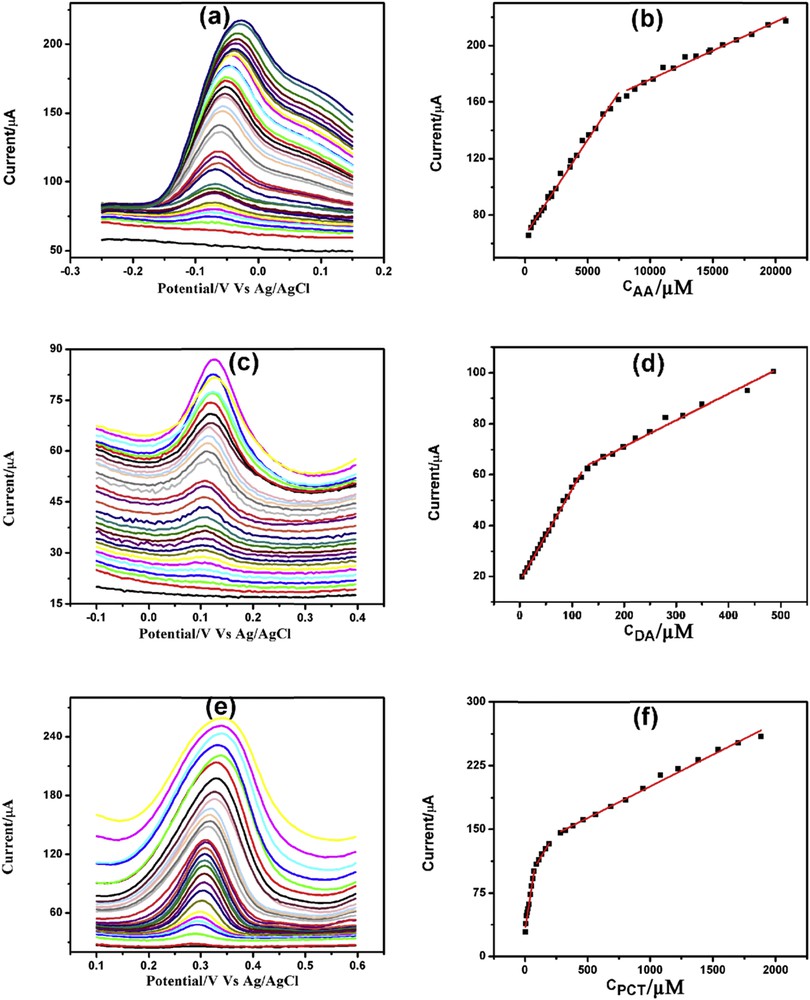
DPVs of increasing concentration of (a) AA, (c) DA, and (e) PCT with corresponding linearity plots (b), (d), and (f) respectively.
GPtNPs-modified GCE exhibited wide linearity ranges with good detection limits for AA, DA, and PCT sensing. The linearity plots obtained for CV, CA, and DPV using GPtNPs-modified GCE have been compared with other modified electrodes from the literature and are presented in Table 3.
Comparison of the linearity ranges of AA, DA, and PCT determination on GPtNPs-GCE using CV, CA, and DPV with that of other modified electrodes from the literature.
| S. no. | Modified electrode | Technique used | Linearity range | Reference | ||
| AA | DA | PCT | ||||
| 1 | Modified GCE (0.5 M NaOH solutions) | DPV | 25–300 μM | 3–30 μM | – | [47] |
| 2 | ERGOa/GCE | DPV | 500–2000 μM | 0.5–60 μM | – | [3] |
| 3 | AgNPs/rGO/GCE | LSV | 10–800 μM | 10–800 μM | – | [48] |
| 4 | Trp-GRb | DPV | 200–3400 μM 3.4–12.9 mM | 0.5–110 μM | – | [39] |
| 5 | GPdNPs-GCE | CA | 20–6500 μM | 10–1200 μM | – | [19] |
| 6 | MWCNT/CCEc | DPV | 15–800 μM | 0.5–100 μM | [49] | |
| 7 | MWCNT/GO-GCE | DPV | 0.2–400 μM | 0.2–400 μM | [20] | |
| 8 | SWCNT f/CCE | DPV | 0.4–150 μM | 0.2–100 μM | [50] | |
| 9 | f-MWCNT-GCE | DPV | 3–200 μM | 3–300 μM | [51] | |
| 10 | PyCd films | DPV | 18–270 μM | 15–225 μM | [52] | |
| 11 | MWCNTs–NHNPse–MCM-41/GCE | DPV | 1.5–45 μM 70–350 μM | 0.2–20 μM 20–220 μM | [53] | |
| 12 | BDDE | DPV | 10–100 μM | 10–100 μM | [54] | |
| 13 | SWCNT/CCE | DPV | 5–700 μM | 0.2–150 μM | [55] | |
| 14 | BDD electrode modified with Nafion and lead films | DPV | 1–500 μM | 0.5–200 μM | [56] | |
| 15 | MnFe2O4@CNT-N/GCE | SQWT | 2–100 μM | 1–1000 μM | [57] | |
| 16 | Carbon nanotube paste electrode | DPV | 100–700 μM | 39.4–146.3 μM | [58] | |
| 17 | Modified CPEg | LSV | 1–10 mM | 3 μM–7.5 mM | [59] | |
| 18 | Thionine immobilized MWCNT-CPE | DPV | 1–100 μM | 0.1–100 μM | [60] | |
| 19 | GCE/MWCNT–Polyhis | DPV | 25–2500 μM | 0.25–10 μM | [23] | |
| 20 | Pd nanocluster-coated polyfuran | DPV | 50–1000 μM | 0.5–100 μM | 0.5–100 μM | [61] |
| 21 | GPtNPs-GCE | CV | 300–20,889 μM 22,019–39,869 μM | 300–7460 μM 8120–39,869 μM | 420–29,260 μM | This work |
| CA | 420 μM −29.26 mM | 10–600 μM | 20 μM −6.43 mM | |||
| DPV | 5–104 μM 114–684 μM | 5–118 μM 130–486 μM | 10–600 μM |
a ERGO: electrochemically reduced graphene oxide.
b Trp-GR: tryptophan functionalized graphene.
c CCE: carbon ceramic electrode.
d PyC: pyrolytic carbon.
e NHNPs: nickel hydroxide nanoparticles.
f SWCNT: single-walled carbon nanotubes.
g CPE: carbon paste electrode.
Because AA, DA, and PCT coexist in biological samples, individual determination of each of the analyte in the presence of other(s) was also done using DPV. Figs. 9–11 demonstrate the increasing concentration of AA, DA, and PCT, respectively, by keeping the concentration of other analyte/analytes constant.
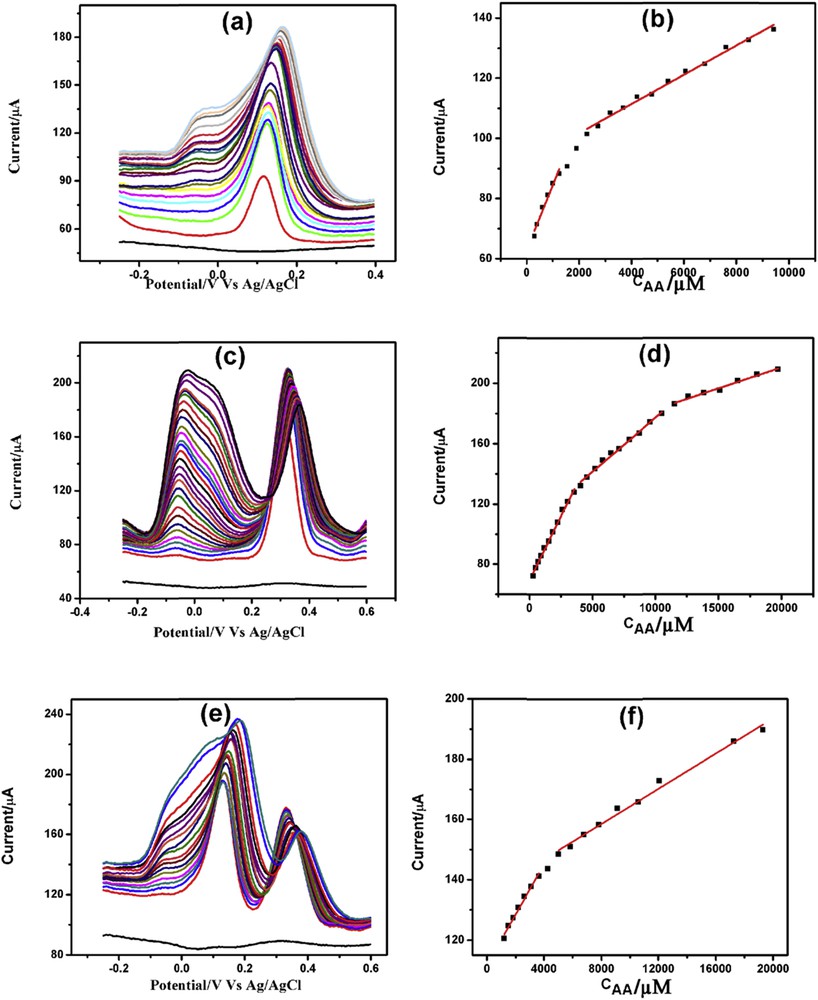
DPVs of increasing concentration of AA in the presence of (a) 200 μM DA, (c) 200 μM PCT, and (e) both 200 μM DA and 200 μM PCT with corresponding linearity plots (b), (d), and (f), respectively.
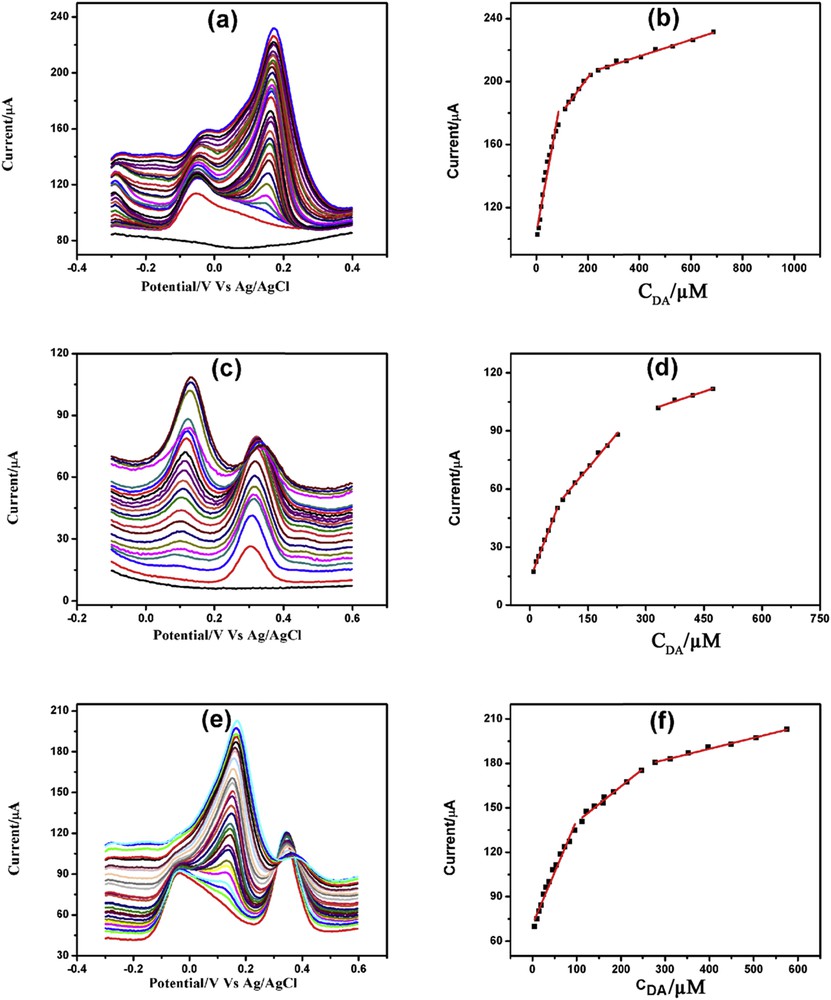
DPVs of increasing concentration of DA in the presence of (a) 5 mM AA, (c) 200 μM PCT, and (e) both 5 mM AA and 200 μM PCT with corresponding linearity plots (b), (d), and (f), respectively.
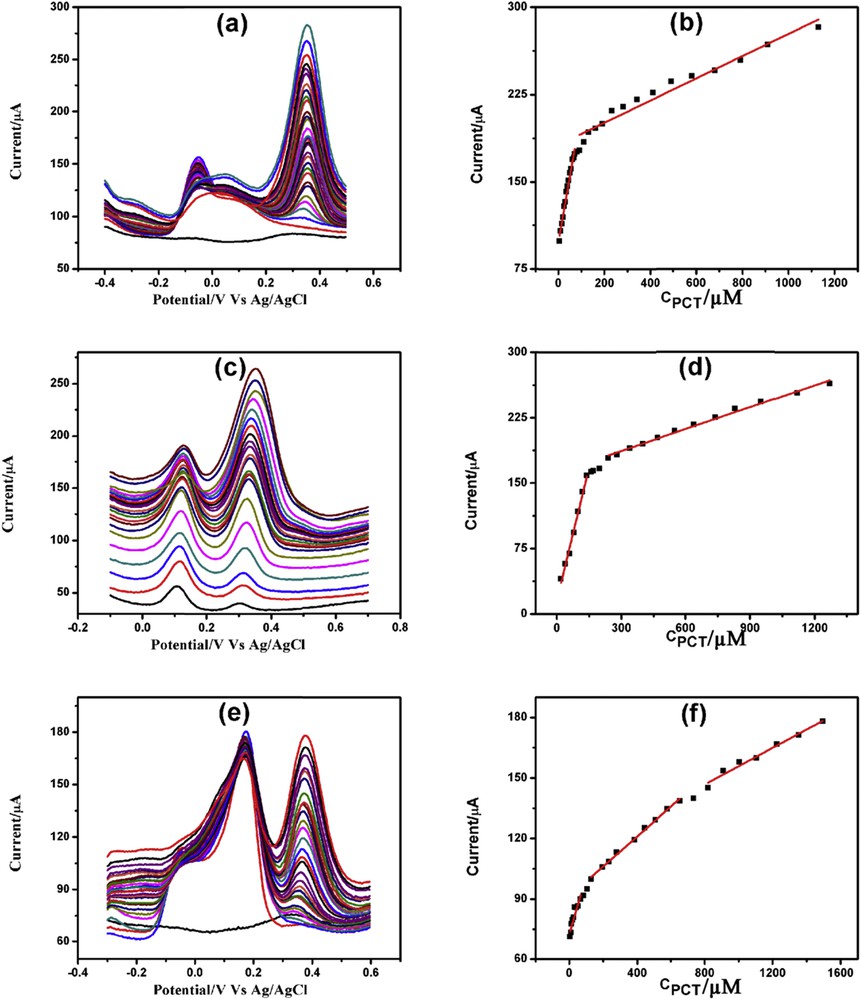
DPVs of increasing concentration of PCT in the presence of (a) 7 mM AA, (b) 200 μM DA and (c) both 7 mM AA and 200 μM DA with corresponding linearity plots (b), (d) and (e), respectively.
3.7.4 DPV determination of AA in the presence of DA and/or PCT
Fig. 9(a, c, and e) demonstrates the AA determination in the presence of 200 μM DA, 200 μM PCT, and both 200 μM each of DA and PCT. AA determination in the presence of DA showed two linearity segments, one from 300 μM to 1.25 mM and the other from 2.30 to 9.42 mM (Fig. 9b). The first, second, and third linearity segments for AA determination in the presence of PCT were from 300 μM to 3.56 mM, from 4.05 to 10.53 mM, and from 11.53 to 19.73 mM, respectively (Fig. 9d). Similarly, the first and second linearity ranges for AA determination in the presence of DA and PCT were from 1.20 to 3.65 mM and from 4.28 to 19.28 mM, respectively (Fig. 9f). The linearity plots, linear regression equations, correlation coefficients along with detection limits are presented in Table S5.
3.7.5 DPV determination of DA in the presence of AA and/or PCT
Fig. 10(a, c, and e) demonstrates DA determination in the presence of 5 mM AA, 200 μM PCT, and both 5 mM AA and 200 μM PCT, respectively. Determination of DA in the presence of AA demonstrated three linearity segments: 5–86, 111.5–211, and 240–688 μM (Fig. 10b). DA determination in the presence of PCT also showed three linearity segments: 10–71.5, 85–227.5, and 332.5–473.5 μM (Fig. 10d). Similarly, the three linearity segments of DA determination in the presence of AA and PCT were 5–96, 112–247, and 278.5–575 μM (Fig. 10f). Table S6 illustrates the linearity plots, linear regression equations, correlation coefficients, and detection limits of DA determination in the presence of AA and/or PCT.
3.7.6 DPV determination of PCT in the presence of AA and/or DA
PCT determination was done in the presence of 7 mM AA, 200 μM DA, and both 7 mM AA and 200 μM DA. Fig. 11(a, c, and e) illustrates the PCT determination in the presence of AA, DA, and both AA and DA, respectively. Determination of PCT in the presence of AA demonstrated two linearity segments: 5–71.5 μM and 91.5 μM to 1.13 mM (Fig. 11b). PCT determination in the presence of DA also showed two linearity segments: 20–140 μM and 240 μM to 1.27 mM (Fig. 11d). Similarly, determination of PCT in the presence of AA and DA demonstrated three linearity plots: 5–67, 129.5–734.5 μM, and 819.5 μM to 1.49 mM (Fig. 11f). The linearity plots, linear regression equations, correlation coefficients, and detection limits of PCT determination in the presence of AA and/or DA are illustrated in Table S7.
4 Conclusions
In the present study, we have synthesized PtNPs and assembled them on graphene nanosheets to form the GPtNPs nanocomposite. The nanocomposite was heated in glacial acetic acid at 70 °C for 12 h to generate a pristine PtNPs-decorated graphene nanocomposite and characterized using various techniques. GPtNPs exhibited highest peak currents when compared with G-GCE and bare GCE in [Fe(CN)6]3−/4− solution and toward the electrochemical oxidation of AA, DA, and PCT in PBS. Reduction in overpotential was also observed for AA using the GPtNPs nanocomposite. CV demonstrated the longest linearity ranges for the individual determination of AA and DA, whereas CA exhibited longest linearity range for PCT. DPV showed lowest detection limits of 300, 5, and 5 μM for the individual detection of AA, DA, and PCT. Good peak-to-peak resolution of 218.0, 218.0, and 436.0 mV was observed for AA–DA, DA–PCT, and AA–PCT, respectively.
Acknowledgments
S.S.R. and M.A.K. acknowledge the funding from DBT-Ramalingaswami fellowship (Sanction Order No. 102/IFD/SAN/1118/2014-15) and UGC-CSIR SRF (2061210007), Govt. of India. We acknowledge the Central Library, SSSIHL, for providing access to SciFinder services. We are thankful to Rajashekar Badam and Sai Gourang Patnaik research scholars from Matsumi Laboratory, JAIST, Japan, for their help and support in TEM and XPS characterization. We thank A. Sai Kiran for his help in preparing the graphical abstract. We also thank Muralikrishna Molli for his help rendered in XRD characterization. M.A.K. acknowledges his brother, Manne Aravind Kumar, for his constant support. The authors are grateful to Bhagawan Sri Sathya Sai Baba, founder chancellor, SSSIHL, for his constant inspiration.