

1 Introduction
The concentration of carbon dioxide (a greenhouse gas) inexorably increases in the atmosphere. Various methods are currently examined to decrease the CO2 concentration or to convert it into valuable chemical products. The use of CO2 as a feedstock for the synthesis of high added value chemicals is a promising alternative for CO2 abatement [1,2]. The simplest way to use carbon dioxide is the hydrogenation into valuable compounds, such as methanol (MeOH) and DME (dimethyl ether) [3–8]. Such conversion is often performed on copper-based catalysts. Industrial methanol synthesis is performed by catalytic hydrogenation of syngas (H2/CO/CO2) over Cu/ZnO/Al2O3-type catalyst. Unfortunately, the industrial Cu/ZnO/Al2O3 catalyst is neither active nor selective in CO2 hydrogenation. Previous published research studies demonstrated that the use of industrial catalysts brings to very low hydrogenation conversions of CO2 to methanol [9].
This issue can be overcome by developing suitable catalysts, which can effectively convert carbon dioxide to methanol [10–13]. Even if copper-based materials are promising catalysts for the hydrogenation of CO2 [14–19], further investigations are required for developing new catalytic materials able to give high conversion of CO2 and improved selectivity to MeOH.
To improve the catalytic performance of methanol synthesis from H2/CO2 feeding gas, CuO/ZnO catalysts have been widely modified by adding various activators or other metals (Zr, Si, La, Ti, Cr, Ga, Ce, Fe, Nb, Pd, etc.) [20–25]. The effect of the support was also extensively studied. The type of support affects both CO2 conversion and methanol selectivity, and, in general, basic oxides such as La2O3, Sm2O3, Nb2O5, In2O3, and ThO2 [26,27] used as supports favor the methanol formation. The preparation methods have also a considerable influence on the catalytic performance [28–30]. Several methods such as coprecipitation [31–35], impregnation [36–38], and sol–gel [38,39] have been developed to prepare copper-based oxide catalysts. Moreover, the coprecipitation synthesis was improved by addition of reducing agents such as chitosane [14] and NaBH4 [15]. Surfactant-assisted coprecipitation [16], solvent-free routine combustion [40], and microfluidic coprecipitation [41] are novel synthesis methods that allow obtaining a good repeatability of the synthesis and an improved homogeneity of the phases present in the catalyst. Other methods, such as impregnation and sol–gel, can also produce catalysts with large specific surface areas and high CuO dispersion [42]. Polyol synthesis represents a good alternative to the classical synthesis methods. In particular, it presents many advantages, such as the possibility to precisely modulate the stoichiometric ratio, the homogeneous mixing of the various components, the low cost, and the short reaction time. Therefore, polyol synthesis reveals to be an attractive technique for the synthesis of nanooxide powders.
CuO/ZnO/Al2O3-type catalysts obtained by polyol synthesis have been successfully applied in the reverse water gas shift reaction [43], in the alcohol-assisted low temperature methanol synthesis from syngas [44] and in methanol reforming [45].
The polyol method [46,47] permits to synthesize nanosized metallic powders with uniform size distribution and shape [46–48]. In recent years, the polyol method has been studied by many researchers [49–52]. These investigations showed that the crystallite size and shape [46] can be controlled by varying the reduction temperature, the pH, and the nucleation-protective agent concentration [44,49–52]. Until now, and to the best of our knowledge, no attempts to prepare Cu/ZnO catalyst for methanol production using the polyol method have been done. In a typical polyol synthesis, polyols (ethylene glycol, diethylene, glycerol, and tetraethylene glycol) act at the main time as the reaction medium and as the reducing agent. The metal precursor is reduced through a redox reaction between the metal precursors and polyolic species. Therefore, the reaction temperature is an important parameter, because the oxidation potential of polyol chemicals decreases with the increase in the reaction temperature [49,53,54]. Nucleation-protective chemicals such as polyvinylpyrrolidone are occasionally used to prevent sintering and agglomeration of metal particles [53,54]. The various published articles indicate that the choice of the preparation conditions strongly affects the activity of catalysts prepared by the polyol method.
In the present work, the so-called “polyol method” has been used to obtain improved catalytic materials for the hydrogenation reaction of CO2 to methanol. The influence of metal dispersion, spinel formation, and surface properties of binary and ternary catalysts (CuOCeO2, ZnOCeO2, CuOZnOCeO2, and CuOZnOAl2O3), prepared by the polyol method using polyethylene glycol as a solvent, is evaluated in the CO2 hydrogenation to methanol at atmospheric pressure, used as a test reaction.
2 Experimental section
2.1 Preparation of binary and ternary polyol catalysts
Two binary catalysts (labeled ZnOCeO2 and CuOCeO2, with Zn/Ce and Cu/Ce molar ratios equal to 1) and two ternary catalysts (labeled CuOZnOCeO2 and CuOZnOAl2O3, with molar ratios of Cu/Zn/Ce and Cu/Zn/Al equal to 1/1/2) were prepared by the polyol method. The reaction temperature and the choice of the solvent were selected referring to the available investigations reported [44,45]. These experimental conditions seem to favor the formation of nanocrystallites. Different from the synthesis reported in these published studies, nitrate-base precursors were used in the present research instead of Me acetates. In fact, nitrates do not participate in secondary reactions like those operated by acetates that can react to form methyl acetate and ethyl acetate. First, copper nitrate Cu(NO3)2·2.5H2O (Sigma–Aldrich 98%) and/or zinc nitrate Zn(NO3)2·6H2O (Sigma–Aldrich 99%) were dissolved in polyethylene glycol (C2H6O2)n (Sigma–Aldrich 99%, d = 1.13 g/mL). The solution at pH = 2 was then heated up, step by step, and kept under stirring for 1 h at 70 °C, 2 h at 120 °C, and 2 h at 180 °C. Cerium and/or aluminum nitrates (Ce(NO3)3·6H2O and/or Al(NO3)2·1H2O (Sigma–Aldrich 99%) were then added to the initial solution under vigorous stirring for 4 h at the same temperature (180 °C). The formation of a precipitate was observed. The suspension was cooled down to 100 °C, and NH4OH was added dropwise to reach a pH of 7. The resulting suspensions were kept under vigorous stirring at 100 °C for 24 h. Finally, the formed gel was dried at 180 °C for 72 h and then calcined in air at 450 °C for 5 h.
2.2 Characterization techniques
Thermogravimetric analyses (TGAs) were performed using a TGA one LF 1100 STARe system from Mettler Toledo. The samples were heated up at 5 °C/min under airflow (100 mL/min) from room temperature to 500 °C.
The X-ray diffraction (XRD) patterns were acquired using a PANalytical MPD X'Pert Pro diffractometer operating with Cu Kα radiation, λ = 0.15406 nm at 40 mA and 45 kV with a scan rate of 2° min−1. Data were collected in the 5–60° 2θ range. The diffraction patterns were analyzed using the Joint Committee on Powder Diffraction Standard. CuO, ZnO, and CeO2 crystallite sizes were calculated by means of the Scherrer equation:
| (1) |
N2 adsorption isotherms of the samples were acquired at −196 °C using a Micromeritics ASAP2420 apparatus. Catalyst (0.25 g) was pretreated at 300 °C for 10 h under vacuum (∼50 mTorr). The specific surface area was calculated using the multi-Pont BET (Brunauer, Emmett, and Teller) method [55], whereas the pore size distribution was obtained by the BJH (Barrett, Joyner, and Halenda) method [56] to the desorption branch of the isotherm.
Scanning electron microscopy (SEM) coupled with energy dispersive X-ray spectroscopy was performed using a Philips XL 30 instrument (electron acceleration voltage of 15 kV).
X-ray photoelectron spectroscopy (XPS) measurements were performed using a Kratos Axis Ultra DLD spectrometer equipped with a monochromatic microfocused Al Kα (1486.6 eV and Mg Kα=1253.6 eV) X-ray exciting source. The pass energy of the analyzer was set at 40 eV. The adventitious C 1s peak (284.6 eV) was used as internal reference with an accuracy of ±0.3 eV. XPS was used to evaluate the oxidation state of copper, zinc, and cerium species. O 1s, Cu 2p, Zn 2p, Ce 3d, and Al 2p species were quantified by analysis of the survey XPS spectra. The binding energies of C 1s, O 1s, Cu 2p, Zn 2p Ce 3d, and Al 2p were analyzed to identify the associated surface species and the relative atomic concentration.
2.3 Catalytic tests
The catalytic hydrogenation of carbon dioxide to methanol was evaluated in a fixed-bed continuous flow reactor. During each test, 0.3 g of catalyst was pretreated with hydrogen at 300 °C for 3 h. After the reduction step, the catalyst was exposed to a H2/CO2 (1/9 volume ratio) flow at different reaction temperatures (190–240 °C). The feeding mixture and the reaction products were analyzed online with a gas chromatograph (Shimadzu GC-2014) equipped with flame ionization detector (FID) and thermal conductivity detector (TCD). CO2 conversion (X) and products' selectivity were calculated as follows, using the quantitative correction factor (kf) and peak area (S) for the different species:
| (2) |
| (3) |
| (4) |
3 Results and discussions
3.1 Characterization of catalysts
3.1.1 Thermal behavior
The thermal behavior of catalysts before and after calcinations is shown in Fig. 1. The sample mass continuously decreased with the temperature. For the catalysts before calcination, the TGA curves showed three main events connected to the decomposition of residual precursors (Fig. 1a) (indeed, the most part of the precursors has been eliminated by the thermal treatment during the synthesis).
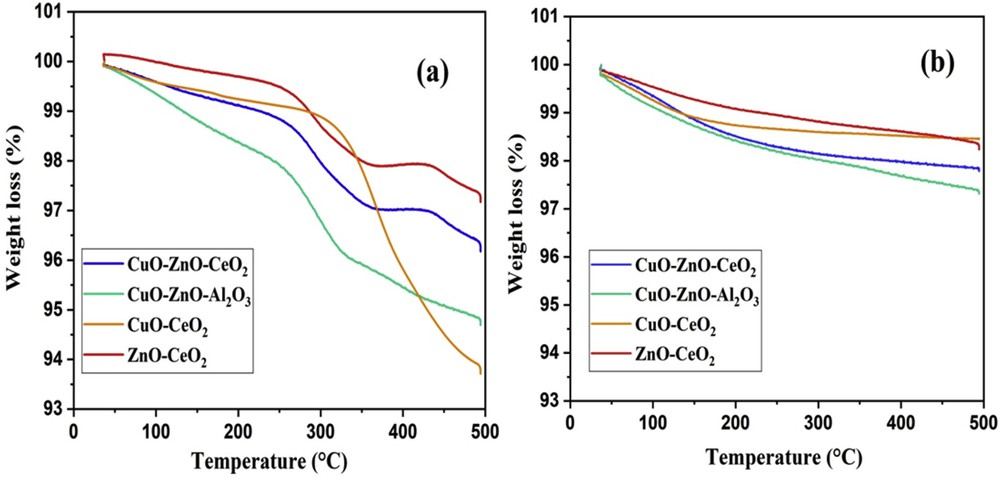
TGA profiles of the catalyst (a) before calcination and (b) after calcination at 500 °C.
A first mass variation in the 0.5–2.5% range was observed up to 250 °C and was attributed to the loss of water (physisorbed and chemisorbed) as well as to the decomposition of residual nitrates from the precursors. The second and highest mass loss (0.5–3%) between 250 and 350 °C was probably related to the elimination of polyethylene glycol. The third step, at temperature greater than 350 °C, corresponded to the lowest mass loss (0.5%) and was attributed to the decomposition of hydroxyl groups, leading to metal oxide formation. After calcinations (Fig. 1b), the catalyst showed a low mass loss (<2%), attributed to the release of physisorbed water (<150 °C), and the decomposition of carbonates formed by a reaction with atmospheric CO2. The presence of carbonates was observed also by XPS (as described in Section 3.1.3).
3.1.2 Structure and morphology of the catalysts
The X-ray diffractograms of the calcined bimetallic and trimetallic catalysts are displayed in Fig. 2. For the three calcined catalysts, CuOCeO2, ZnOCeO2, and CuOZnOCeO2, only the diffraction peaks relative to the CuO, ZnO, and CeO2 phases could be clearly identified. The diffraction peaks centered at 28.6°, 33.1°, 47.5°, 56.3°, 59.1°, and 69.0° 2θ, corresponding respectively to the (111), (200), (220), (311), (222), and (400) diffraction planes of cubic CeO2 [57,58], were observed for the ZnOCeO2, CuOCeO2, and CuOZnOCeO2 catalysts. For the ZnOCeO2 and CuOZnOCeO2 samples, diffractions at 31.7°, 34.5°, 36.2°, 62.9°, and 69.0° 2θ indicated the presence of hexagonal ZnO [31,57,59,60] and corresponded respectively to the (100), (002), (101), (103), and (201) planes. The cubic CuO phase [31,57,59], present in the CuOCeO2 and CuOZnOCeO2 samples, was characterized by broad diffraction lines at 35.5° and 38.7° 2θ corresponding to the (−111) and (111) planes. Broad diffraction lines at 2θ = 35.5°, 38.7°, 61.5°, and 68.1° indicated the presence of CuO and correspond respectively to the (−111), (111), (−202), (−113), and (−220) planes. In addition to CuO, CuAl2O4 and ZnAl2O4 spinels could be identified in the CuOZnOAl2O3 sample. The diffraction peaks of CuAl2O4 and ZnAl2O4 were superposed and placed at 31.2°, 36.8°, 55.6°, 59.3°, and 65.2° 2θ. No diffraction peaks relative to ZnO could be identified in CuOZnOAl2O3; all zinc was present as spinel CuZnAl2O4.
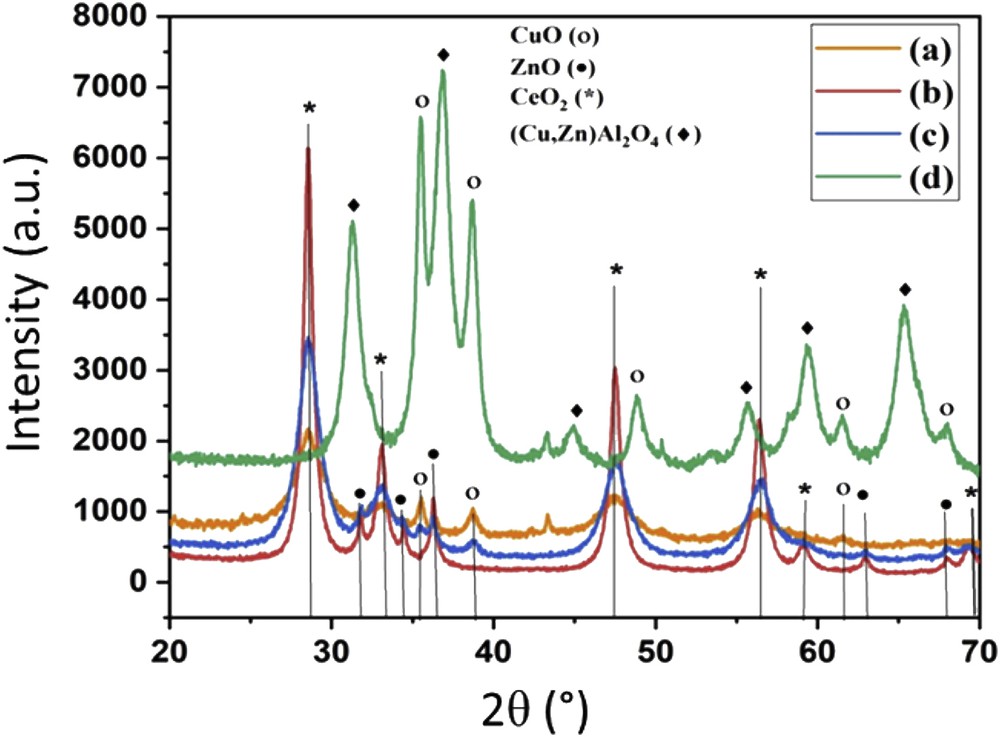
XRD patterns of calcined catalysts: (a) CuOCeO2, (b) ZnOCeO2, (c) CuOZnOCeO2, and (d) CuOZnOAl2O3.
The metal oxide crystallite dimensions were evaluated applying the Scherrer equation to the main diffraction peak of each phase, and the results are reported in Table 1. ZnO crystallite size of 20–30 nm was calculated in the binary ZnOCeO2 catalyst. CuO crystallites, in the 10–20 nm dimension range, were detected for the CuOCeO2 catalyst (Table 2). The CuO (6 nm) and ZnO (12 nm) crystallites were much smaller for the ternary CuOZnOCeO2 sample, indicating that the presence of zinc and copper oxides together ameliorates the oxide distribution and dispersion during the synthesis procedure.
Morphological and structural properties of the catalysts.
| Sample | SBET (m2 g−1) | Vpore (cm3 g−1) | Dporea (nm) | Crystallite size with XRD analysisb (nm) | |||
| CuO | ZnO | CeO2 | Cu,ZnAl2O4 | ||||
| CuOCeO2 | 32 | 0.07 | 17 | 10–20 | – | 5 | – |
| ZnOCeO2 | 18 | 0.03 | 20 | – | 20–30 | 5 | – |
| CuOZnOCeO2 | 38 | 0.12 | 22 | 6 | 12 | 5 | NA |
| CuOZnOAl2O3 | 30 | 0.04 | 23 | 20–30 | – | – | 30–40 |
a Determined from desorption branch of N2 adsorption isotherm by the BJH model.
b Crystallite size calculated by the Scherrer equation.
Surface elements' presence as determined by XPS analysis.
| Orbital | CuOZnOCeO2 | CuOZnOAl2O3 | ||||
| Binding energy (eV) | Species | At (%) | Binding energy (eV) | Species | At (%) | |
| C 1s | 284.98 | CC | 16.54 | 285.01 | CC | 2.46 |
| 286.53 | COR | 0.60 | 286.56 | COR | 0.28 | |
| 287.98 | CO | 2.55 | 288.01 | CO | 0.40 | |
| 289.48 | OCO | 4.62 | 289.47 | OCO | 0.89 | |
| O 1s | 529.49 | CuO | 6.97 | 529.80 | CuO | 9.02 |
| 529.43 | Ce4+/CuO | 29.07 | 531.71 | AlO | 33.22 | |
| 530.90 | Ce3+/ZnO | 4.17 | 530.80 | ZnO | 8.51 | |
| 531.90 | (CO3)2− | 7.04 | 531.40 | (CO3)2− | 2.64 | |
| Cu 2p | 932.75 | Cu2+/Cu+ | 5.87 | 933.61 | Cu2+ | 4.31 |
| 934.91 | Cu2+/Cu+ | 0.97 | 935.66 | Cu2+ | 1.42 | |
| 940.92 | Cu2+/Cu+ | 0.99 | 940.87 | Cu2+ | 1.68 | |
| 943.54 | Cu2+/Cu+ | 0.78 | 943.43 | Cu2+ | 1.65 | |
| Zn 2p | 1021.56 | ZnO | 0.53 | 1021.87 | ZnO | 7.71 |
| Ce 3d | 881.00 (V0) 899.39 (U0) | Ce3+ | 0.92 | – | – | – |
| 882.44 (V) 900.76 (U) | Ce4+ | 4.42 | – | – | – | |
| 884.95 (VI) 903.20 (UI) | Ce3+ | 3.80 | – | – | – | |
| 888.70 (VII) 907.36 (UII) | Ce4+ | 5.33 | – | – | – | |
| 898.16 (VIII) 916.34 (UIII) | Ce4+ | 4.82 | – | – | – | |
| Al 2p | – | – | – | 74.47 | Al3+ | 24.86 |
The nitrogen adsorption–desorption isotherms of the various polyol samples (acquired at −196 °C) are shown in Fig. 3a. The catalysts isotherm shows a continuous increase in adsorbed nitrogen over the whole P/P0 range, with a relatively steep increase at P/P0 ≥0.85. For all catalysts, the N2 adsorption isotherms (Fig. 3b) were of type II [61] with no plateau at high P/P0 values, which is usually observed for materials with macropores or interparticular mesoporosity [62]. H4-type hysteresis was observed for the CuOZnOAl2O3 sample, and H3-type for the ZnOCeO2, CuOCeO2, and CuOZnOCeO2 samples [63]. These types of hysteresis are typical of lamellar compounds or slit-shaped pores [64].

(a) N2 adsorption–desorption isotherms and (b) pore size distribution of all samples.
All materials presented relatively low porous volumes (Table 1, third column), as expected for this kind of preparation that produces bulk oxides. Fig. 3b represents the pore size distribution of the catalysts. All catalysts presented a certain mesoporosity centered in the 17–23 nm range. The presence of macropores (up to 150 nm) was observed for the three samples containing CeO2, whereas even larger pores were present in the CuOZnOAl2O3 sample.
The presence of copper oxide seems to improve the specific surface area of the catalysts (in the 30–38 m2 g−1 range), as reported in Table 1. The catalyst with the lower surface area (18 m2 g−1) was ZnOCeO2. This behavior is probably connected to the improved pore volume that can be obtained in the presence of the copper precursor, which end up into a higher internal surface area. Indeed, ZnOCeO2 presented the lowest pore volume and the hysteresis between the adsorption and desorption isotherms was almost absent.
The morphology of the different calcined CuOCeO2, ZnOCeO2, CuOZnOCeO2, CuOZnOAl2O3 samples was investigated by SEM, and the acquired images are presented in Fig. 4. The catalysts containing CeO2 showed a sponge-like morphology, as reported in Fig. 4 for the CuOCeO2 (a–c), ZnOCeO2 (d–f), and CuOZnOCeO2 (g–i) samples. The three ceria-containing samples were characterized by the presence of round-shaped cavities and pores of various dimensions, well distributed in the sample catalyst structure. CuOZnOAl2O3 presented a different morphology (Fig. 4j–l), with well-developed and thin plate-shaped bonded sheets in the 1–5 μm dimension interval. The presence of macropores was confirmed by these images and linked to the formation of gas bubbles during the preparation step, because of the decomposition of the metal oxide precursors.
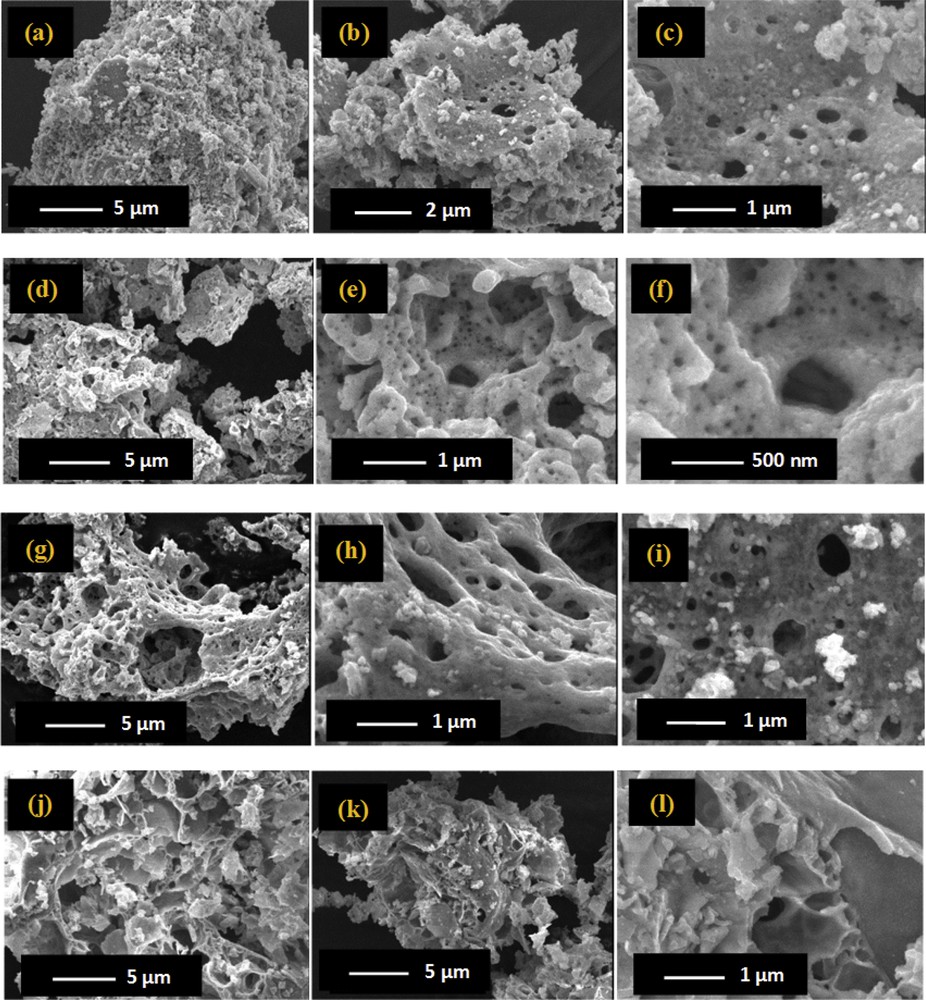
SEM images at different magnification of all catalysts (a–c) CuOCeO2, (d–f) ZnOCeO2, (g–i) CuOZnOCeO2, and (j–l) CuOZnOAl2O3.
Energy dispersive X-ray spectroscopy analysis showed a very homogeneous distribution of the different oxides in all samples.
3.1.3 Chemical composition and surface properties
Photoelectron spectroscopy was used to evaluate the oxidation state of copper, zinc, and cerium species in the CuOZnOCeO2 and CuOZnOAl2O3 calcined catalysts, as well as to evaluate their surface chemical composition (Table 2). All elements (Cu, Zn, Ce, Al, and O) were present at the sample surface (Table 2). The survey XPS acquisition permitted to quantify the various atoms (O 1s, Cu 2p, Zn 2p, Ce 3d, and Al 2p) for the two trimetallic catalysts. Clear differences in the surface elements were observed for the two samples. Zn concentration was particularly low on the surface of the CuOZnOCeO2 sample (0.53%). On the contrary, a large amount of carbon was detected on its surface (24.31%). Because the most part of carbon on the surface of CuOZnOCeO2 could be assigned to residual contamination or hydrocarbon chains, as described later in this section, these results can suggest that the carbon pollution presented a higher affinity for Zn, thus selectively covered at the extreme surface. Less dramatic differences were identified in the CuOZnOAl2O3 sample that showed similar concentrations of copper and zinc on the surface.
No N 1s XPS peak (generally placed around 400.3 eV) related to nitrate (NO3−) species (salt precursors) has been identified for the CuOZnOAl2O3 and CuOZnOCeO2 catalysts, as an indication of the complete decomposition of nitrated after calcination.
The binding energies of C 1s, O 1s, Cu 2p, Zn 2p Ce 3d, and Al 2p of the two trimetallic catalysts are listed in Table 2, as well as the associated surface species and their atomic concentration.
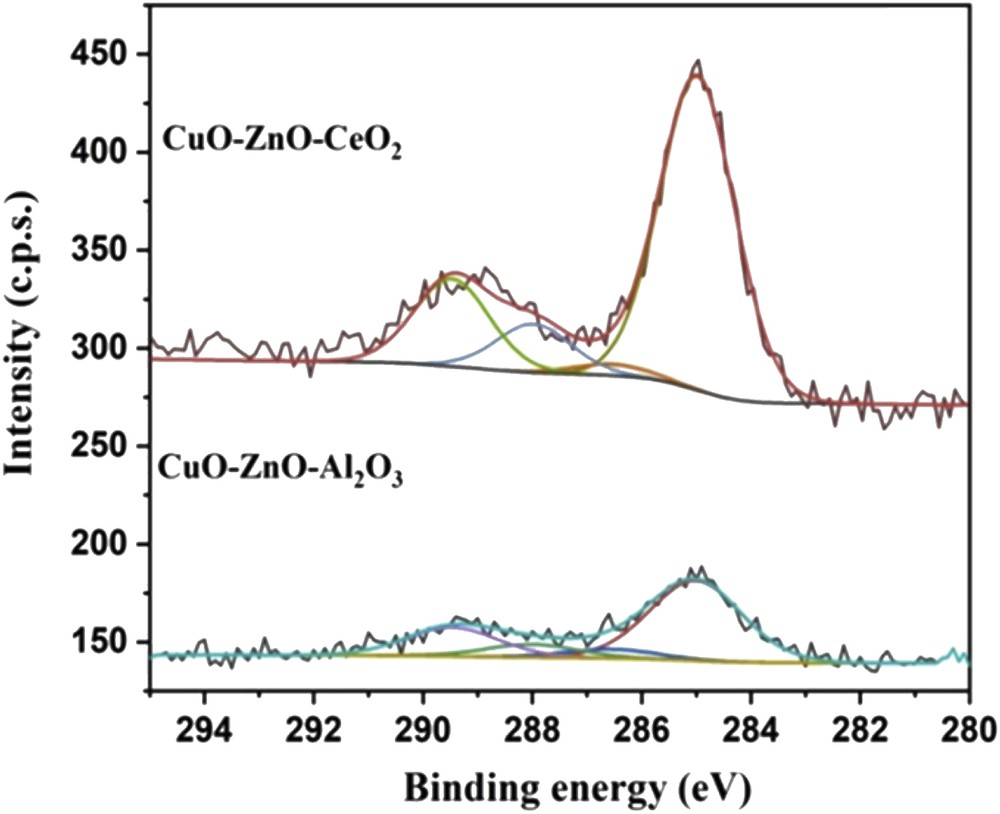
The Cu 2p spectrum of both CuOZnOCeO2 and CuOZnOAl2O3 (Fig. 5) catalysts presented the characteristic spin–orbit split Cu 2p1/2 and Cu 2p3/2 peaks, with their shake-up satellites of Cu2+ [65]. Binding energies, in the 932.0–932.8 and 933.2–934.6 eV ranges, are characteristics of Cu+ and Cu2+, respectively [66,67]. These two contributions could be identified in the CuOZnOCeO2 sample (upper spectrum in Fig. 5). The large and strong peak centered at 932.7 eV was then attributed to Cu2+ and/or Cu+ species, whereas the small and broad peak centered at 934.9 eV was assigned to Cu2+ species [68]. For the CuOZnOAl2O3 sample (Fig. 5), the Cu 2p3/2 peak presented two contributions characteristic of Cu2+ species; the first one was observed at 933.61 eV and related to copper oxide, whereas a second contribution, at a higher binding energy (935.66 eV), was assigned to Cu2+ in the CuAl2O4-like environment (the presence of the spinel structure, CuAl2O4, was also observed by XRD analysis). Indeed, the shift to higher binding energy is indicative of a charge transfer from Cu2+ toward Al2O42− [69,70]. The intensity ratio of the satellite peak to the related main peak (Isat/Ipp) was 0.17, for the CuOZnOCeO2 catalyst and 0.44 for CuOZnOAl2O3. The lower Isat/Ipp value is characteristic of well-dispersed copper oxide species in an octahedral coordination environment, whereas the higher value is symptomatic of a coordination change, most probably because of the formation of the spinel [71]. In addition, the contribution at around 529 eV of the O 1s spectra can also be assigned to the presence of Cu2+ and Cu+ (see Table 2).

Cu 2p XPS spectra of CuOZnOCeO2 and CuOZnOAl2O3 samples.
The Zn 2p3/2 XPS spectra for the two trimetallic catalysts were characterized by one defined peak around 1021–1022 eV that could be assigned to Zn2+ species. The presence of ZnO has also been confirmed by the O 1s band centered at 530.8 eV [72,73]. The XPS signal of CuOZnOCeO2 was much less intense than that of CuOZnOAl2O3, indicating the higher ZnO concentration on the CuOZnOAl2O3 surface (8.68%atom for CuOZnOAl2O3 and 0.53%atom for CuOZnOCeO2 catalysts.
The presence of carbon was detected on the surface of both samples. The C 1s spectra are reported in Fig. 6 for the CuOZnOCeO2 and CuOZnOAl2O3 catalysts. In both cases the spectra were composed of two contributions: the first, centered at 289.5 eV was assigned to carbonate species, whereas the more intense band, at around 285 eV, to residual contamination or hydrocarbon chains, probably deriving from the polyethylene glycol used during the catalyst synthesis. Indeed, cerium oxide and reduced cerium are known to react with CO2 (e.g., present in the atmosphere) and give rise to carbonate species on the surface [74]. The carbonate band was much less intense for the CuOZnOAl2O3 catalyst, and the corresponding atomic percentage was about 1.3% instead of 7.2% for the CuOZnOCeO2 catalyst. The presence of carbonates was also confirmed by the O 1s XPS band centered at high binding energies (531.9 and 531.4 eV, respectively for CuOZnOCeO2 (Fig. 7a) and CuOZnOAl2O3 (Fig. 7b)).
C 1s XPS spectra of CuOZnOCeO2 and CuOZnOAl2O3 samples.
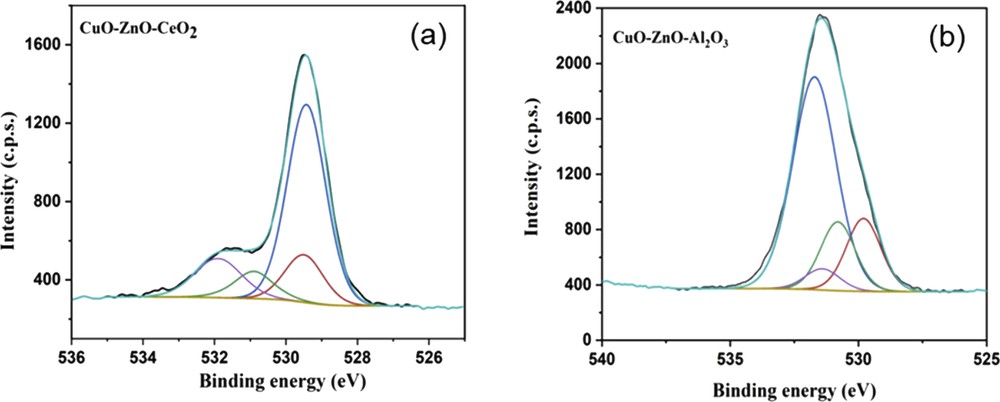
O 1s XPS spectra of (a) CuOZnOCeO2 and (b) CuOZnOAl2O3 samples.
The XPS spectrum of Ce 3d for the CuOZnOCeO2 sample is depicted in Fig. 8 and presents a complex behavior. The split of the band into numerous peaks is because of the hybridization between the final state Ce 4f orbitals and the O 2p oxygen orbital [75]. In Fig. 8, the peaks are identified by V and U labels, indicating respectively the spin–orbit coupling three d3/2 and 3d5/2 [76], by applying the convention introduced by Burroughs et al. [77] in 1976. Ce 3d spectrum can be decomposed in five doublets, (UIII, VIII), (UII, VII), (UI, VI), (U°, V°), and (U, V), corresponding to the emissions from the spin–orbit split 3d3/2 and 3d5/2 core levels [76–78]. The five doublets were assigned to different final states of tetravalent (Ce4+) or trivalent (Ce3+) in Ce compounds (see Table 3); UIII (916.6 eV) and VIII (898.2 eV) were because of a Ce 3d94f0 O 2p6 final state, UII (907.4 eV) and VII (888.8 eV) to a Ce 3d94f1 O 2p5 final state, UI (903.2 eV) and VI (884.9 eV) to a Ce 3d94f1 O2p6 final state, U° (899.3 eV) and V° (881.0 eV) to a Ce 3d94f2 O 2p5 final state, and U (900.8 eV) and V (882.4 eV) to a Ce 3d94f2 O 2p4 final state. Specifically the well-defined UIII peak at 916.6 eV was characteristic of the presence of Ce4+ [76].
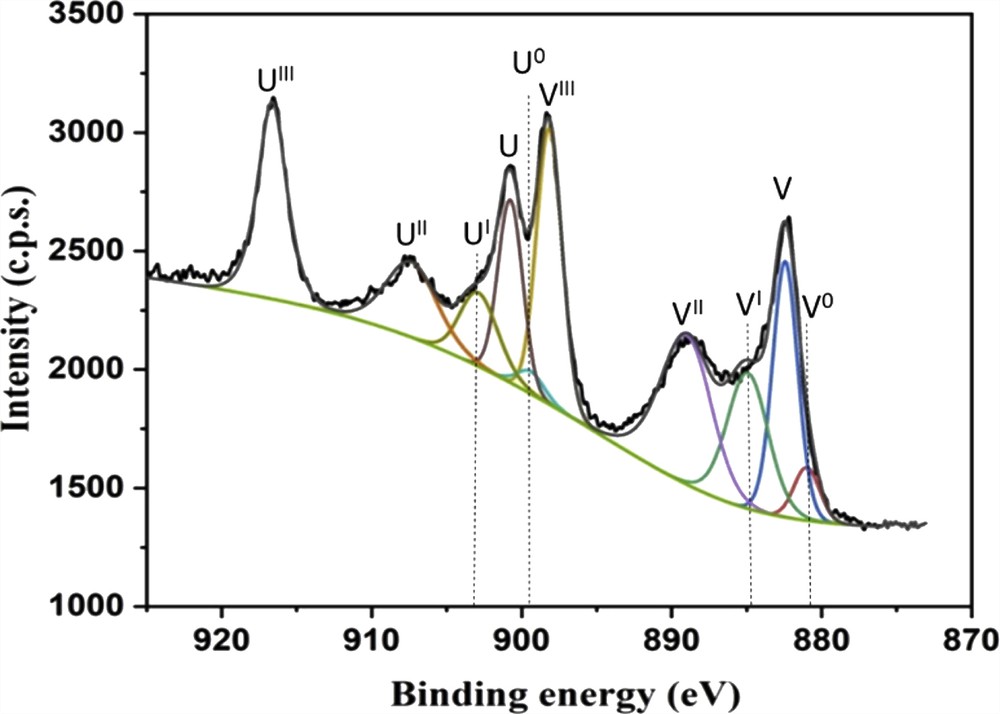
Ce 3d XPS spectra of the CuOZnOCeO2 sample.
Catalytic performances in the hydrogenation of CO2, obtained on the catalysts prepared.
| Type of catalyst | Preparation method | T (°C) | P (MPa) | R (H2/CO2) | CO2 conversion (%) | CH3OH Selectivity (%) | Reference |
| CuOZnOAl2O3 | Polyol method | 240 | 0.1 | 9.0 | 14 | 86 | This work |
| CuOZnOCeO2 | Polyol method | 240 | 0.1 | 9.0 | 20 | 90 | |
| CuO/ZnO/Al2O3 | Solvent-free routine | 240 | 3.0 | 3.0 | 16 | 64 | [40] |
| CuO/ZnO/ZrO2 | Surfactant coprecipitation method | 240 | 3.0 | 3.0 | 12 | 33 | [16] |
| CuOZnOZrO2 (M) | Coprecipitation microfluidic | 240 | 5.0 | 3.0 | 9 | 47 | [41] |
| CuOZnOZrO2 (pH) | Coprecipitation at controlled pH | 14 | 50 | ||||
| CZZ0 | Precipitation/reduction method (NaBH4) | 230 | 5.0 | 3.0 | 17 | 67 | [15] |
| CZZ3 | 15 | 62 | |||||
| CZZ5 | 15 | 67 | |||||
| Cu/ZnO | Coprecipitation | 240 | 3.0 | 3.0 | 17 | 78 | [83] |
| 10Cu−/CeO2 | Coprecipitation + impregnation | 230 | 3.0 | 3.0 | 4 | 66 | [84] |
| 0.5Pd10Cu/CeO2 | 6 | 49 | |||||
| 2Pd10Cu/CeO2 | 15 | 29 | |||||
| CuOZnOTiO2ZrO2 | Coprecipitation (oxalate) | 240 | 3.0 | 3.0 | 17 | 44 | [60] |
| Cu/ZnO | Impregnation | 240 | 0.1 | 9.0 | 5 | 12 | [42] |
| CuZn/SiO2 | Impregnation | 250 | 2.0 | 3.0 | 2 | 66 | [1] |
| 5%CuZn/rGo | Incipient wetness impregnation | 250 | 1.5 | 3.0 | 14 | 3 | [19] |
| 10%CuZn/rGo | 26 | 5 | |||||
| 20%CuZn/rGo | 19 | 9 | |||||
| CuO/ZnO/Al2O3 (Cp) | With internal cooling water | 240 | 3.0 | 3.0 | 52 | 69 | [85] |
| CuO/ZnO/Al2O3 (Cp) | Without internal cooling water | ||||||
| Cu/ZrO2 + CaO | Wetness impregnation | 250 | 0.1 | 3.0 | 3 | 1 | [86] |
3.2 Catalytic tests
To verify the catalytic performances of the binary and ternary polyol catalysts in relation to the chemical composition, oxide structure, and surface properties, CO2 hydrogenation to methanol was used as a test reaction. The tests were carried-out at atmospheric pressure by feeding the tubular reactor with a H2/CO2 =1/9 mixture. Methanol and methane were the main carbon containing products, whereas only traces of carbon monoxide were detected.
The activity of the four catalysts was compared at 240 °C (Fig. 9). The binary catalysts, CuOCeO2 and ZnOCeO2, did not show any catalytic activity (CO2 conversion <2%). The ternary CuOZnOCeO2 and CuZnOAl2O3 catalysts showed similar conversion curves as a function of time, with stabilization of their activity after 4 h of reaction. The CuOZnOCeO2 catalyst showed the best result with a maximum conversion of about 20%, whereas CuZnOAl2O3 reached a conversion not exceeding 14%. The enhanced activity of the ternary catalysts is attributed to the synergistic effect between CuO and ZnO, as already known from the literature [79–81]. The higher activity of the CuOZnOCeO2 catalyst can be attributed to both the basicity of CeO2 [82], which favors the adsorption of CO2 (i.e. an acid molecule), and the enhanced reducibility of the system, leading to the increase in the number of active sites after reducing pretreatment operated in situ before the reaction tests. Moreover, in the CuZnOAl2O3 catalyst, copper and zinc oxides were not fully available because of the formation of the CuAl2O4 and ZnAl2O4 spinels, as shown by XRD. Indeed, zinc and copper trapped into the spinel cannot enter in intimate contact and their synergistic catalytic effect [80–82] cannot be deployed.
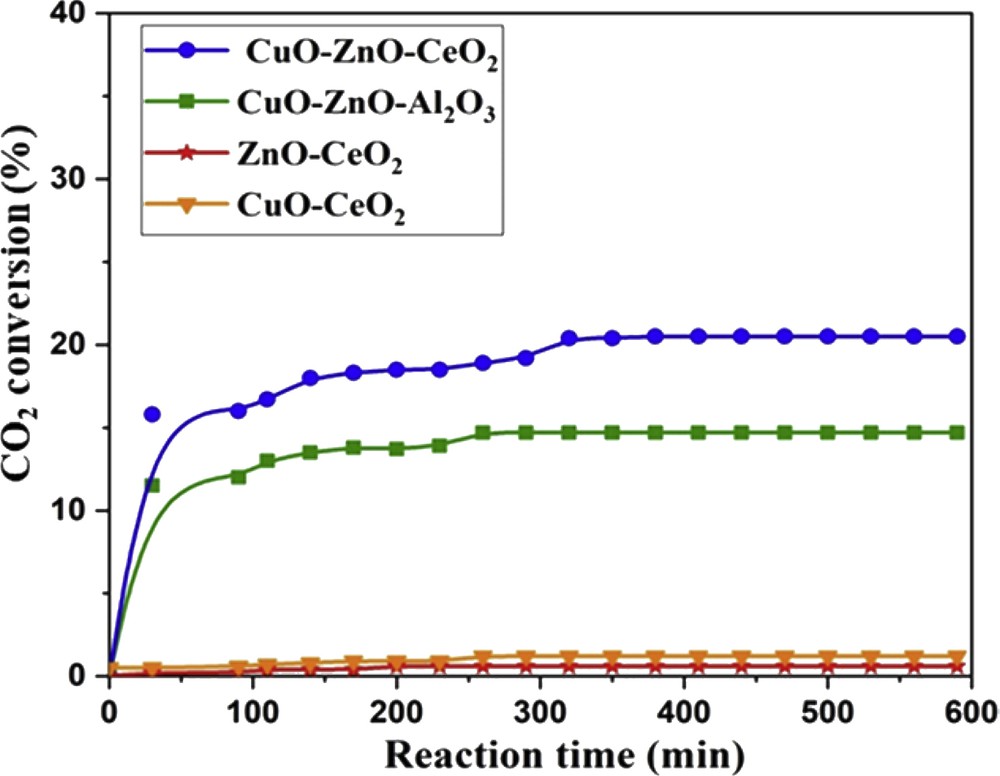
CO2 conversion as a function of the time of reaction. Reaction conditions: CO2/H2 = 1/9, T = 240 °C, flow = 1 L h−1 and P = 1 atm.
On the most active catalyst (CuOZnOCeO2), further tests at different reaction temperatures were performed. The CO2 conversion as a function of time is plotted in Fig. 10a for the tests performed in the 190–240 °C temperature range. At the beginning the curves presented an activation step, characterized by a steep section of the conversion curve; after 1 h of reaction, the change in slope indicated that the stationary state is going to reach up (maximum CO2 conversion). A slightly different behavior was observed for the test performed at 240 °C in which the approach to the maximum conversion was slower and characterized by a change in the slope. By increasing the temperature, the selectivity to CH4 increased, whereas the methanol selectivity decreased simultaneously (Fig. 10b). Methanol selectivity was favored at low temperature; MeOH is indeed unstable at high temperature and is transformed into CH4 and H2O (in the presence of hydrogen) through the following successive reactions:
| CO2 + H2 → CH3OH + H2 → CH4 + H2O |
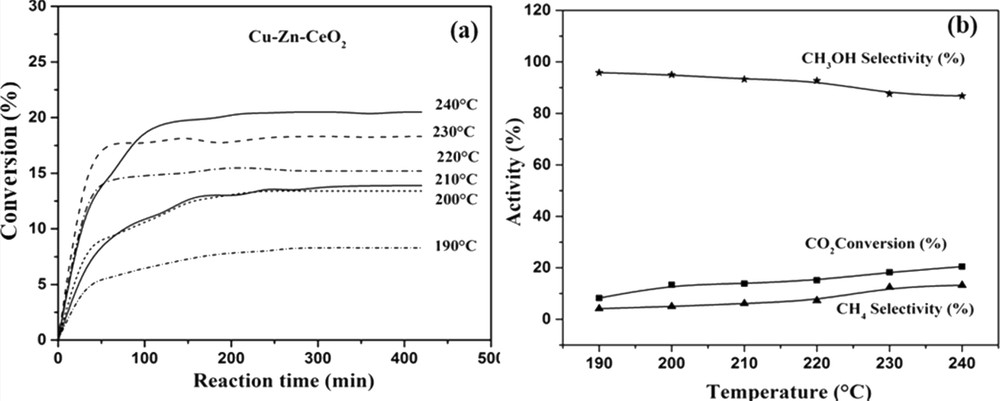
a) CO2 conversion as a function of the time and temperature of a reaction (b) MeOH and CH4 selectivity as a function of the temperature of a reaction, over the CuOZnOCeO2 catalyst: flow = 1 L h−1 and P = 1 atm.
This transformation explains also the change in slope of the CO2 conversion curve in Fig. 10a; at first the slope of the 240 °C curve followed that of the curves at lower temperature, whereas when the transformation to CH4 started, the slope decreased and the rate for reaching the stationary state slowed down.
4 Conclusions
The catalysts prepared by the polyol method, and reported in the present research, presented improved properties in terms of metal oxide dispersion and morphology (i.e. sponge-like shape for the CeO2-containing catalysts), and a variety of the metal and metal oxide species on the surface. Moreover, the CuOZnOCeO2 and CuZnOAl2O3 catalysts exhibited a higher activity and selectivity in the methanol synthesis by CO2 hydrogenation than those displayed by catalysts prepared by more conventional methods, as summarized in Table 3. The results obtained for the catalysts prepared in the present work are also reported for comparison.
The most part of the catalysts listed in Table 3 presented CO2 conversion <20% and selectivity to methanol <65%, even when the reaction was performed at a relatively high pressure (1.5–5.0 MPa), a more favorable condition than that used in the present research. It is worth to notice that on catalysts prepared by impregnation [42], the reaction performed at atmospheric pressure and with a H2/CO2 ratio of 9 allowed us to obtain only 12% conversion and 70% selectivity to methanol at 240 °C, confirming that polyol method is promising for the preparation of active catalysts for CO2 hydrogenation (20% CO2 conversion and 90% selectivity to MeOH).
Acknowledgments
All physicochemical characterizations were performed by the technical platforms of IS2M. The authors are very grateful to S. Hajjar, L. Josien, L. Michelin, and H. Nouali for their contribution.