


 CC-BY 4.0
1. Introduction
Urinary stone analysis is an essential part of the diagnosis and treatment of stone diseases [1, 2, 3], but the laboratory methods used for stone analysis have remained largely unchanged for seventy years, involving the manual dissection of stones followed by molecular spectroscopy for mineral identification [4, 5, 6]. One technology that remains relatively novel in the field of stone analysis is micro computed tomographic imaging (micro CT) [7, 8, 9].
The method was first applied to kidney stones for study of the mechanisms of stone breakage by shock wave lithotripsy [10], and in those studies it became clear that micro CT could provide exquisite detail of the structure of urinary stones. It has now been applied to the analysis of urinary stones for over a decade [7, 11], for different kinds of kidney stones including those of calcium oxalate [12, 13, 14], apatite [15], brushite [16], cystine [17], and uric acid [18].
Despite the extensive use of micro CT in imaging urinary stones, little has been published on how well micro CT performs, by itself, in identifying stone mineral. The purpose of the present paper is to introduce the technology to those unfamiliar with it, to present data on the accuracy of stone analyses done using micro CT alone, to propose a simple method for standardizing X-ray attenuation values to aid in identification of mineral type by micro CT, to describe the characteristics of different minerals as they appear by micro CT, and to show the potential of micro CT to accurately report the three-dimensional structure of stones.
2. Basics of micro CT imaging
The basic operation of a micro CT system is illustrated in Figure 1. The process is very much like the old “step-and-shoot” clinical CT systems [19], except that with micro CT the specimen itself is rotated and not the X-ray source/detector. The specimen is mounted in the path of a microfocus X-ray source and the shadow of the specimen is collected by a high-resolution X-ray camera. After one image is collected, the specimen is rotated slightly (e.g., 0.7°) and a new image collected. This is repeated until at least 180° of rotation is captured. The set of shadow images can then be converted to tomographic image slices using the Feldkamp method [20].
Basic scheme of micro CT. (A) The X-ray source shines a cone beam onto the specimen and the shadow of the specimen is captured using a high-resolution digital camera. The specimen is rotated in steps and a shadow image (B) collected at each step. The collection of rotation images is then processed mathematically to yield image slices (C). COM: calcium oxalate monohydrate.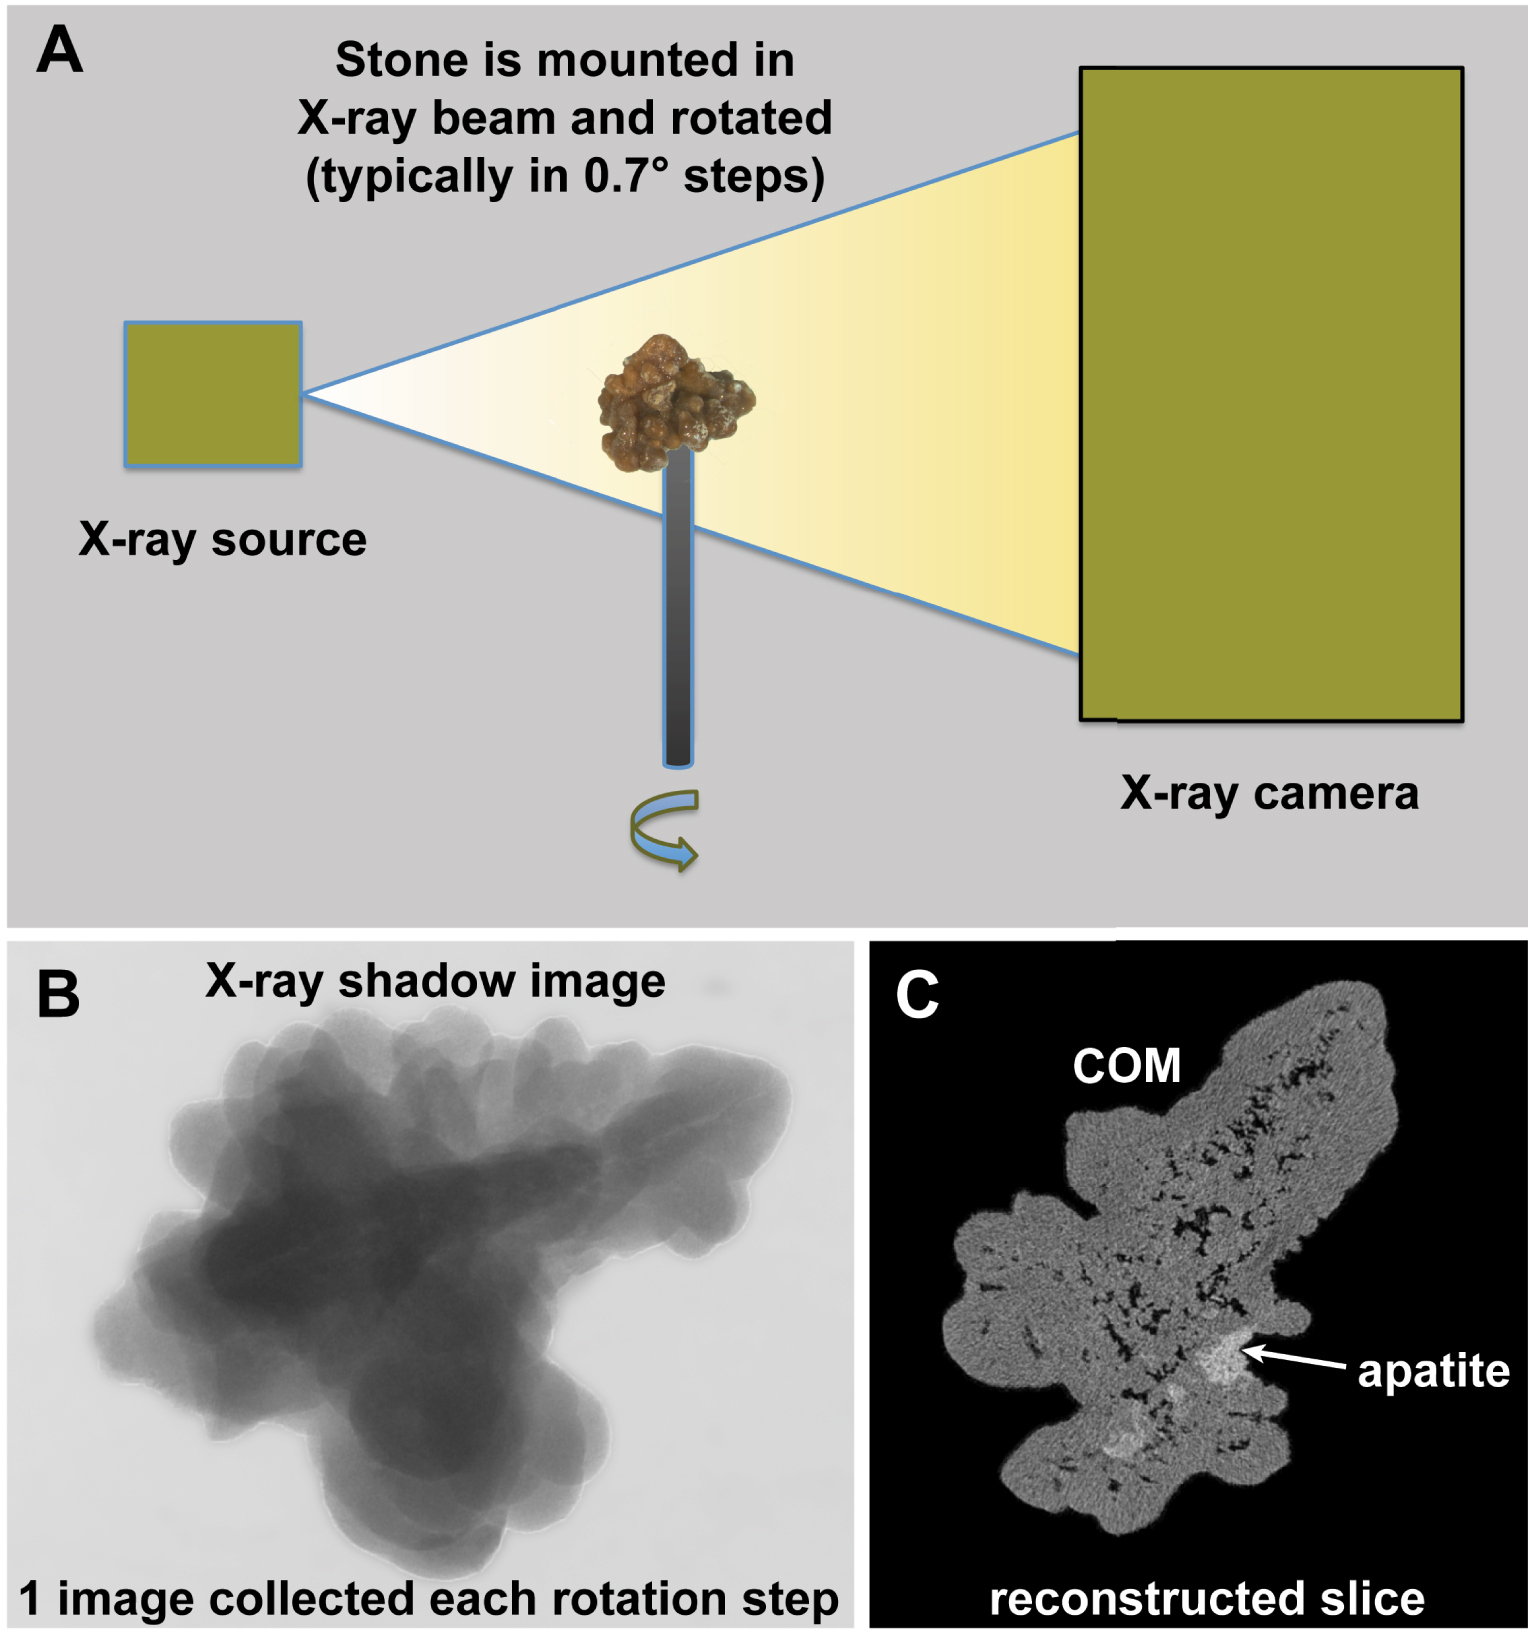
The size of specimens for micro CT is generally limited to a few centimeters in dimension, and to obtain the high-resolution characteristic of micro CT, the intensities of X-rays are high and the exposure times are relatively long (typically 15–30 min of continuous irradiation, which is generally inappropriate for living things, although for intermediate-resolution, it is possible to use micro CT in laboratory animals [21]).
3. Methods
This paper provides an overview of the method of micro CT, but also gives results of a study designed to test how well micro CT can analyze stones by itself. Most of the stones analyzed for the present paper were collected as part of an ongoing study of kidney stones, in which patients are consented for study under the Indiana University Internal Review Board (under guidelines from the United States Health and Human Services Office of Human Subjects protection). The rest of the stones were obtained as de-identified specimens, in large part as discards from a stone analysis laboratory (Beck Analytical, Greenwood, IN, USA), but also as de-identified specimens provided by other research groups for analysis. Each stone specimen was rinsed and dried at room temperature. It was then scanned using the Skyscan 1172 Micro CT system (Bruker, Kontich, Belgium), typically using 60 kVp, 0.5 mm Al filter, and 0.7° rotation step for final (cubic) voxel sizes of 2–12 μm. Stones were typically mounted in Styrofoam for scanning, as that material is remarkably X-ray lucent.
Following micro CT imaging, the minerals present were tentatively identified by a single investigator (JCW) using only photographs of the stones and the micro CT image stacks. Portions of each stone specimen were then dissected away and analyzed using conventional Fourier-transform infrared spectroscopy (FT-IR, using the KBr pellet method). If the results of the FT-IR analysis did not account for all the apparently different minerals seen by micro CT, more samples were run by FT-IR. The FT-IR results were used as ground truth for the mineral composition of each specimen, and the micro CT observations taken beforehand (i.e., blinded to the FT-IR) were graded as correct or incorrect.
Standardizing the X-ray attenuation values for micro CT with stones (e.g., establishing CT numbers as Hounsfield units) is extremely problematic because of the wide range of stone sizes scanned (over 4 orders of magnitude, from about 0.05 to over 1000 mm3). In general, there is no way to correctly adjust beam hardening correction during image reconstruction to compensate for such dramatic variations in sample volume [22]. Additionally, we always maximize the magnification in the Skyscan 1172 micro CT system for each specimen to gain the best resolution possible. While it would be possible to run a comparably sized standard at each magnification used for imaging stone specimens, this would be terribly impractical. To overcome this difficulty, we recently have been including a stone standard with the micro CT scan of at least one sample within each patient specimen. The stone standard is composed of FT-IR-verified calcium oxalate monohydrate (COM) and uric acid and is about 2 mm in diameter (Figure 2). Inclusion of this standard has allowed standardization of apparent X-ray attenuation values within any scan. Apparent attenuation values were mapped to an arbitrary scale in which the attenuation of the uric acid standard portion was taken to be 4500 and that of COM was 17,500 (to match arbitrary CT numbers seen in an earlier study [8]).
Example of a patient specimen scanned along with the COM/uric acid standard. Top shows image slice of micro CT of specimen, right, and standard, left. Regions-of-interest (ROI’s) are shown as drawn within this image, and histograms of pixel values within each ROI are shown below. Note that the CT numbers from image slice have been transformed to match the arbitrary scale previously published [8]. For comparison, the actual linear attenuation coefficient (μ) of uric acid at this voltage is approximately 0.40/cm for uric acid stones, and 1.01/cm for COM [23].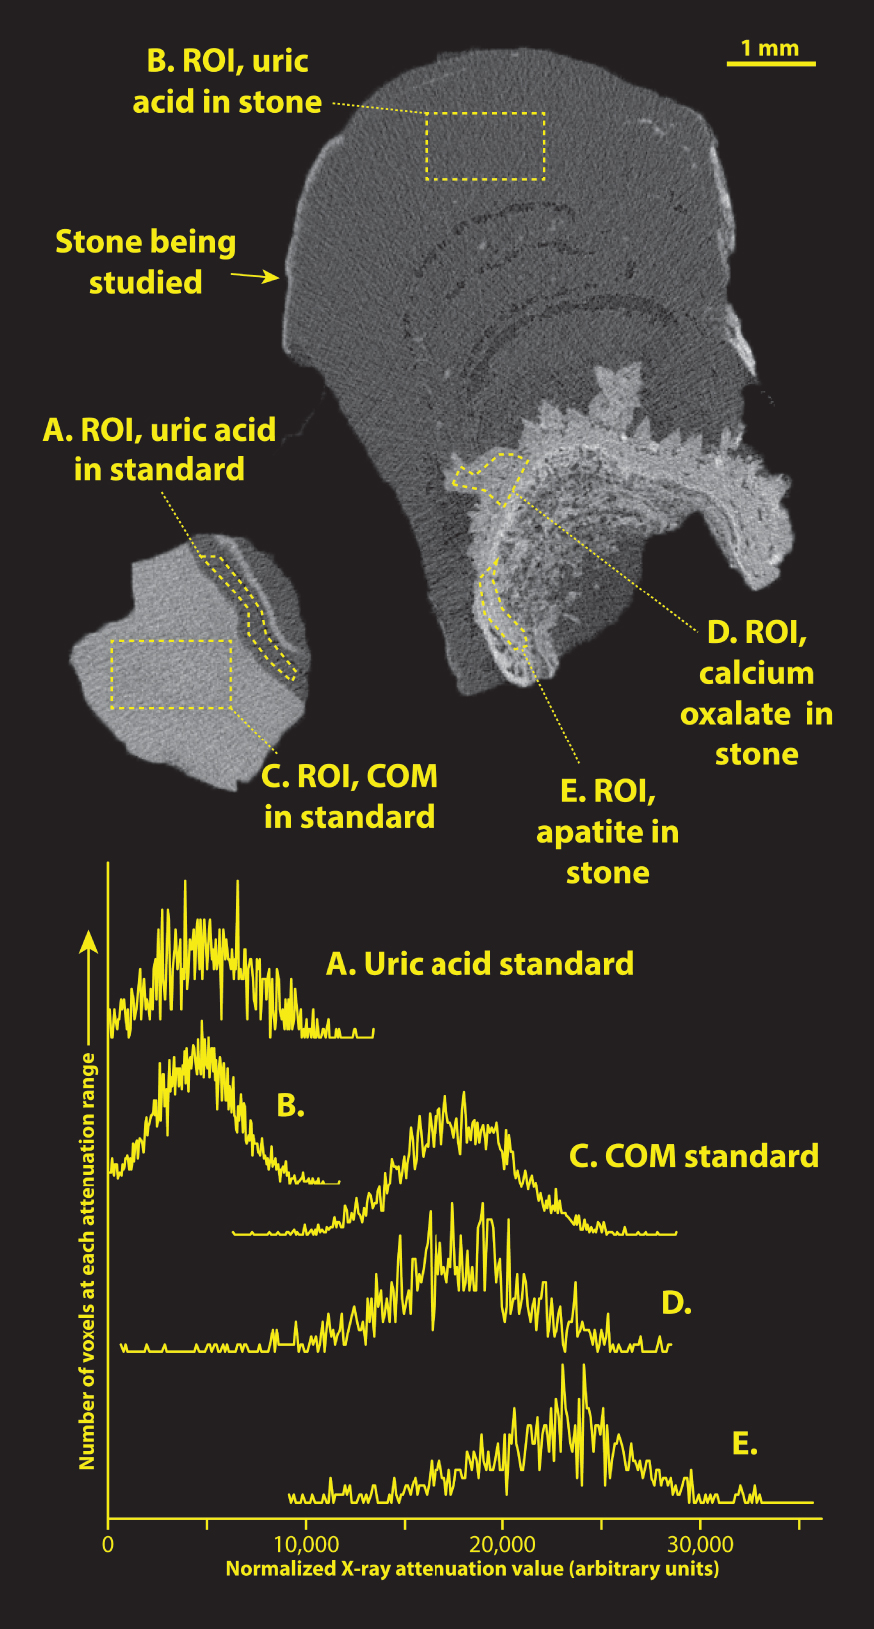
Three-dimensional (3D) imaging of micro CT image stacks was done using the 3D Viewer plugin on ImageJ [24].
In displaying 3D surface renderings of stones, we have sometimes encountered individuals who mistakenly presume that such images are similar to scanning electron microscopy (SEM). To demonstrate the differences between these methods, some stones were also imaged using SEM, using a Zeiss SUPRA 55VP field emission-scanning electron microscope. In order to preserve the structural and the chemical integrities, the SEM observations were made at low voltage (1.4 keV) and without the usual deposits of carbon at the surface of the sample [25].
4. Results and discussion
Overall accuracies for mineral identifications using micro CT are shown in Table 1. The data show that micro CT by itself is relatively useful for analyzing stones, but that significant errors did occur. In particular, infrequent stone types were never correctly identified using micro CT alone. This was expected, as an absence of experience with a rare mineral precluded the chance of recognizing peculiar morphologies, even if they were present. For example, we have examined only a handful of specimens containing any whitlockite, and no consistent morphology of this mineral has been apparent by micro CT, but we cannot rule out the possibility that this mineral could be recognized using micro CT with more experience. A great many of the organic materials (all the urates, 1-methyl uric acid, dihydroxyadenine, matrix stone) had an X-ray attenuation value similar to that of uric acid, also without apparent uniqueness of morphology by micro CT.
Overall accuracy of micro CT analysis used by itself to identify majority mineral among 757 urinary stone specimens
| Major mineral | Number | Sensitivity (%) | Specificity (%) |
|---|---|---|---|
| Calcium oxalate | 458 | 99.6 | 95.3 |
| Apatite | 114 | 88.5 | 99.2 |
| Brushite | 58 | 89.7 | 99.6 |
| Uric acid | 56 | 96.4 | 99.4 |
| Struvite | 49 | 93.9 | 99.6 |
| Cystine | 11 | 90.9 | 99.6 |
| Ammonium acid urate | 3 | 0 | 99.6 |
| 1-methyl uric acid | 1 | 0 | 100 |
| Sodium acid urate | 1 | 0 | 100 |
| Mixed urates | 1 | 0 | 100 |
| Calcium tartrate tetrahydrate | 1 | 0 | 100 |
| Dihydroxyadenine | 1 | 0 | 100 |
| Matrix stone | 1 | 0 | 100 |
| Octacalcium phosphate | 1 | 0 | 100 |
| Whitlockite | 1 | 0 | 100 |
Sensitivity is calculated as the number of correct identifications divided by the total number of specimens of that majority mineral (as verified by spectroscopic analysis). Specificity is the proportion of specimens correctly identified as not being composed of that majority mineral; less than 100% specificity indicates that there was at least one specimen that was incorrectly identified as being composed of that majority mineral.
The distribution of mineral types in this series reflects the fact that the stone specimens came primarily from a urology practice that receives a great many referrals for difficult stone cases. Thus it is that 7.7% of the specimens were majority brushite and 1.5% cystine stones, both of which are considerably higher proportions than seen in most studies [26]. Similarly, the proportion of calcium oxalate stones in this series was correspondingly low (60.5%).
Identification of apatite as the major mineral using micro CT alone was the most problematic of the common minerals, with a sensitivity of only 88.5% for 114 specimens. This is partly due to the remarkable variability in morphology of apatite stones [15], and the wide variation in X-ray attenuation of apatite mineral in stones (see more on this below). Early in the series, there were also a few instances of confusing densely packed brushite with COM, two forms which can appear with remarkably similar morphology by micro CT (also described more below). This confusion between COM and brushite has been largely eliminated in recent years by using an attenuation standard (Figure 2).
4.1. Variation in attenuation values for stone mineral in micro CT
Using a single mineral standard (composed of COM and uric acid, Figure 2) that was included with micro CT scans, the apparent attenuation values for a variety of minerals is shown in Figure 3. Note that even though the mineral in each of the regions tested was verified by FT-IR, the X-ray attenuation values varied within each mineral type. This presumably is due to variation in the density of mineral crystals within the stone matrix [27]. Nevertheless, these attenuation measurements have proved to be very useful in identifying mineral on micro CT scan. For example, a specimen that yields X-ray attenuation in the middle range (7000–12,000) can subsequently be identified by its visual appearance: If it consists of dull brown, polygonal crystals, it is likely to be calcium tartrate tetrahydrate [28]; if it consists of sparkling crystals, it is almost certainly cystine [5]; if the crystals are white, or the stone consists of rather coarse layers, the stone is probably composed of struvite [2]. Similarly, the higher attenuation of brushite than the COM in the standard has enabled more accurate identification of densely packed brushite stones and eliminated the confusion with COM that had sometimes occurred in the past.
Variation in attenuation values for urinary stone minerals, all measured against the same standard of COM and uric acid (Figure 2). Numerals indicate the number of different specimens measured. Each measurement was done on a region of stone specimen that had been confirmed in its composition using infrared spectroscopy. Plots show boxes to indicate first and third quartiles, with the horizontal line indicating the median. Whiskers extend to the outermost point or to 1.5 times the interquartile distance (whichever is smaller). The outlier point (for uric acid) shows a specimen with an attenuation value more than 1.5 times the interquartile distance below the first quartile. COD: calcium oxalate dihydrate. Tartrate: calcium tartrate tetrahydrate.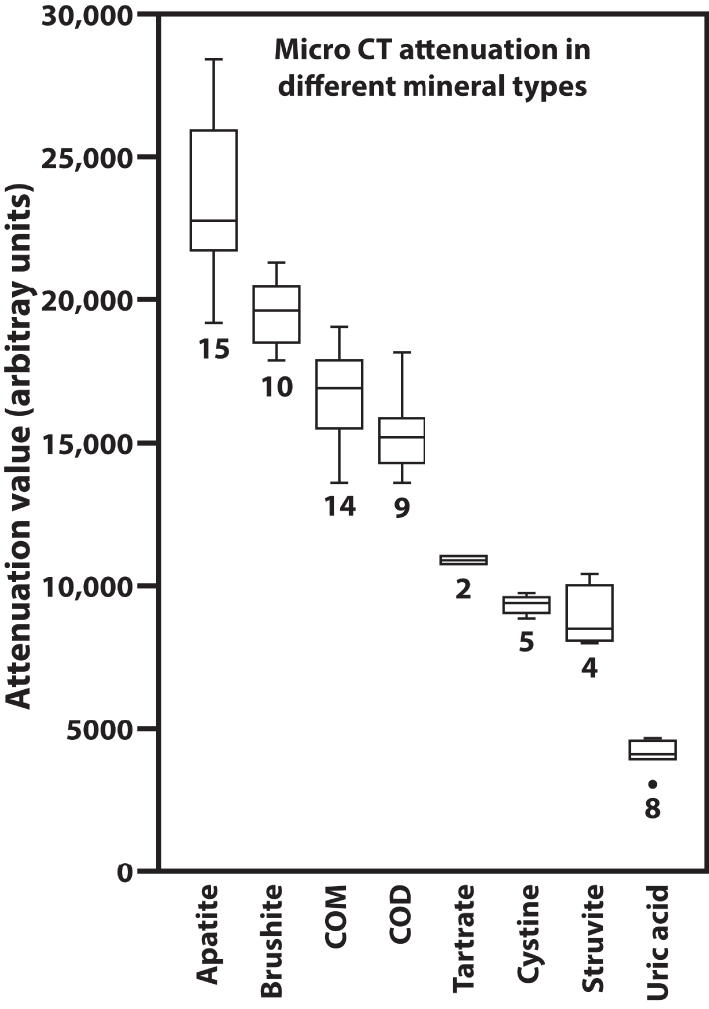
4.2. General appearance of calcium oxalate by micro CT
Several micro CT images of COM and of calcium oxalate dihydrate (COD) have already been published [7, 12, 29], but the most common forms that we have seen consist of tightly packed COM, of stones with obvious shapes of COD crystals some of which have been converted to COM [5], and others composed mainly of unconverted COD (Figure 4). Panel A shows a typical stone composed of tightly packed COM (type Ia [2]). By micro CT the COM appears as a rather homogeneous gray. Void regions are commonly seen in such stones, and the presence of any apatite is easily recognized [27]. In stones with less-tightly packed COM, the outlines of COM regions are sometimes suggestive of the characteristic polygons of COD crystals. Polygonal surface crystals were quite obvious in the stone shown in Figure 4B, where the crystal shapes are easy to see on the photograph of the stone surface. This stone was apparently formed initially as COD but with subsequent conversion of almost all of the COD to COM. Unconverted COD crystals are apparent in Figure 4C, along with the early stages of conversion to COM, which interestingly can occur from within the interior of the COD crystal [30].
Typical morphologies of calcium oxalate stones as seen by micro CT. Insets show photographs of stones on mm paper. (A) Type Ia stone, probably on Randall’s plaque, shows the rather homogeneous gray appearance of tightly packed COM. (B) Stone showing COD crystal shapes but in which the COD has been almost entirely converted to COM. (C) Stone composed mainly of COD, but showing the beginning stages of conversion to COM. In stones forming as COD crystals, it was common to see the interstices filled with apatite (panels B and C), as has been previously described [30].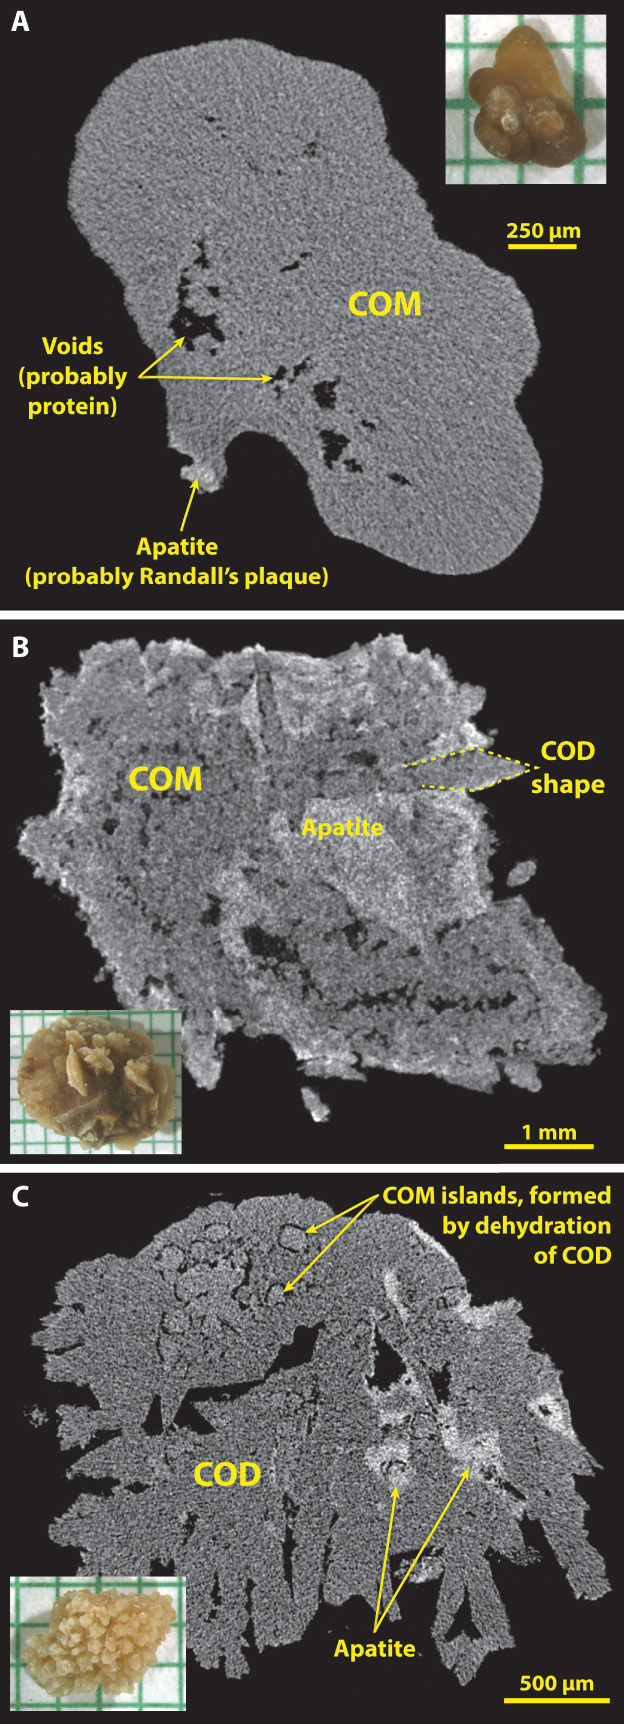
4.3. Apatite by micro CT
Figure 5 shows some common morphologies of majority apatite stones. Apatite is the stone mineral with the highest effective atomic number [31], and so it commonly shows up in micro CT as the brightest (most X-ray attenuating) mineral, but it is also clear that apatite can be present in stones in some kind of low-density form. This is seen in the common layering morphology of apatite, with alternating bright and dark layers [15, 32]. Extensive analysis of layered apatite stones (not containing calcium oxalate) using FT-IR has never revealed any mineral in the dark layers other than apatite. This is consistent with the description of type IVa stones with concentric layering by Daudon et al., who also found only apatite in this morphology of apatite stone [2]. Similarly, larger X-ray-dark regions within an apatite stone (as shown by the asterisk in Figure 5) always have shown in our experience only apatite by FT-IR. Thus it seems certain that apatite can deposit in stones in both an X-ray dense form and also with lower densities of mineral content (presumably suspended in organic material). Figure 5B shows a stone in which apatite layers alternate with COD (the IIa + IVa morphology, commonly occurring with hypercalciuria [33]). Panel C shows an apatite stone with a large, central region of lower X-ray attenuation and with a thin shell composed of COM.
4.4. Brushite by micro CT
Several micro CT images of brushite stones are already published [12, 16, 32, 34], but the two primary morphologies seen by micro CT are shown in Figure 6. When the brushite in stones manifests as long, radial crystals, it is quite distinctive and easy to recognize (Figure 6A). When brushite occurs with calcium oxalate, it is also easy to distinguish, as its X-ray attenuation is generally brighter than that of the oxalates, as shown in multiple examples in reference [16]. In contrast, we have often been fooled in the past by brushite stones in which the mineral is compact (Figure 6B), and this was the primary source of false positives for COM (Table 1). When a stone specimen is scanned with a standard containing COM, recognition of compact brushite stones by their X-ray attenuation has been straightforward.
4.5. Uric acid by micro CT
The accuracy of identifying uric acid stones solely by micro CT was good (Table 1), but undoubtedly the unique colors of these stones played some role in their being so easily recognized. For example, when one has a urinary stone that is orange in color, the subsequent discovery of it being composed of uric acid is not surprising. Nevertheless, the identification of uric acid by micro CT is still likely to be quite accurate without seeing the color of the stone, as its X-ray attenuation value is by far the lowest of the major minerals. As shown in Figure 7, if one adjusts the micro CT image so that the details of any calcium salts are visible, uric acid appears almost as dark as air.
Apatite stones most commonly show alternation of X-ray-dense and more lucent layers, and often relatively large X-ray-lucent regions (*). Spectroscopic analysis of X-ray-lucent regions in apatite stones has always shown only apatite, but sometimes with an increase in the protein content of the material. (A) A typical apatite stone, pure by spectroscopic analysis. (B) An example of the IVa + IIa morphology, with COD crystals between apatite layers. (C) An apatite stone that has thin layers of COM at its surface.
Brushite stones. (A) Brushite with radial crystals, which are quite distinctive by micro CT. (B) Brushite in a more compact form, which can be easily mistaken for COM by micro CT. Inclusion of a COM standard with the micro CT scan can make identification of brushite easier because brushite tends to have a higher X-ray attenuation than does COM (see Figure 3).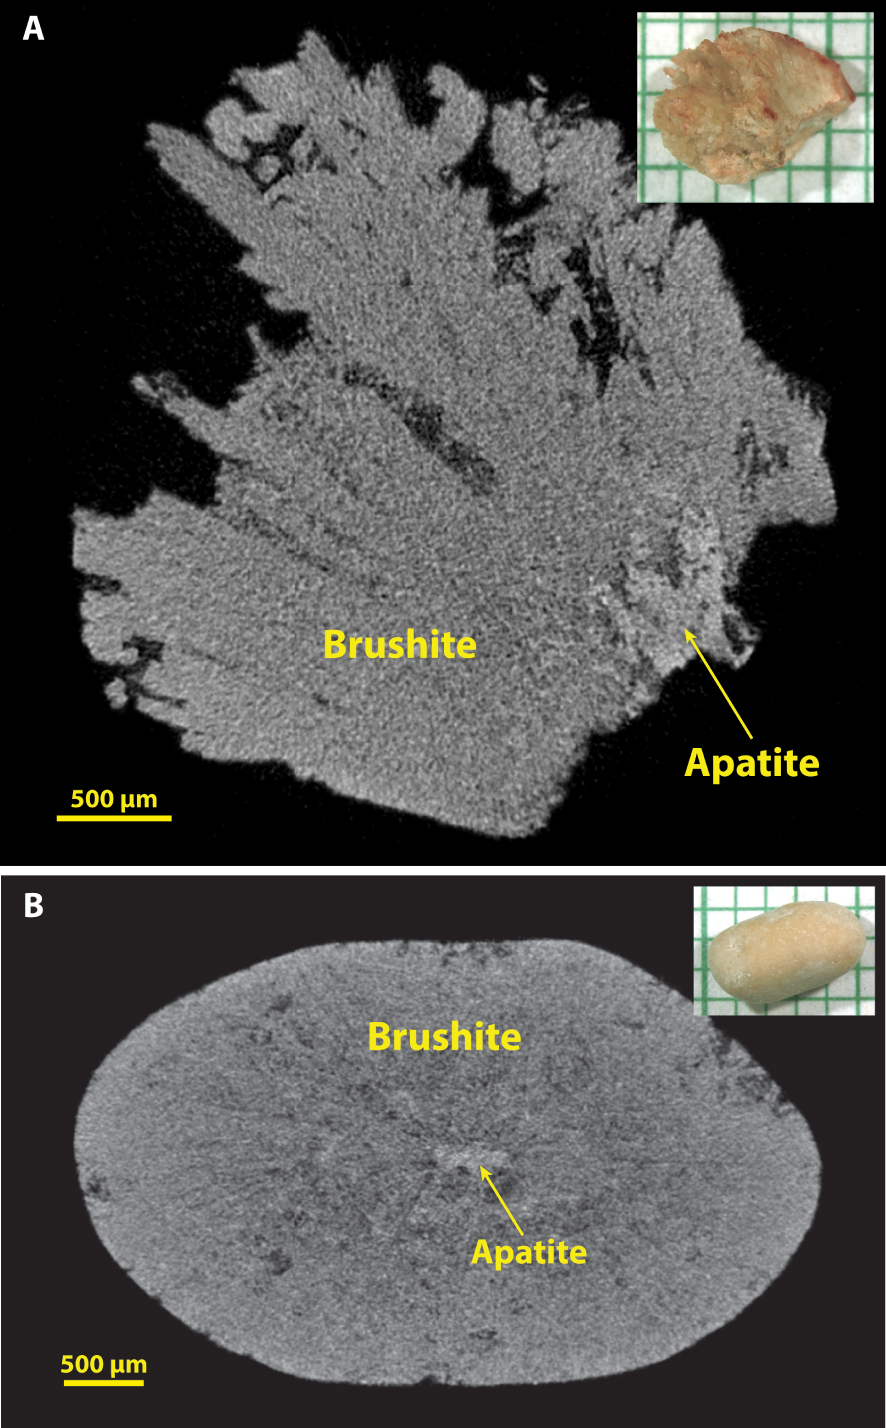
Uric acid in stones has the lowest X-ray attenuation values of the common stone minerals. (A) A typical uric acid stone, nearly pure (93% uric acid by volume). (B) A stone with alternating layers of uric acid and COM. In both (A) and (B) the uric acid was of the anhydrous form by spectroscopic analysis, but the dihydrate form of uric acid looks exactly the same by micro CT.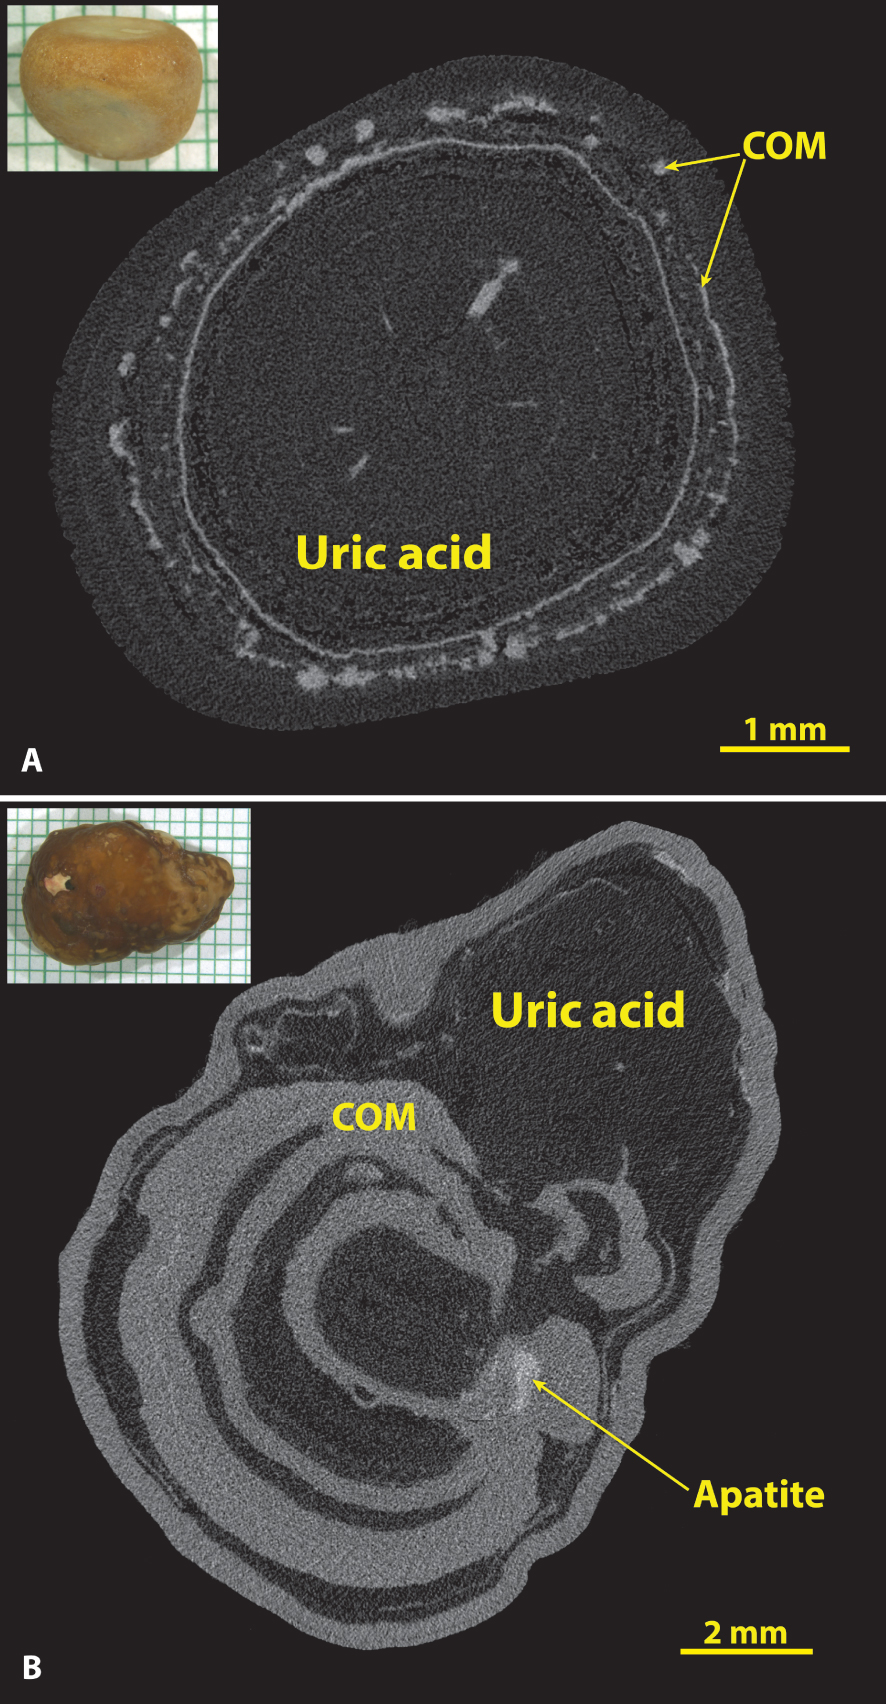
As shown in Figure 7A, even rather pure uric acid stones almost always had inclusions of calcium salts, which most commonly were found to be COM (if the inclusions were large enough to analyze spectroscopically). Out of the 55 specimens containing majority uric acid, only 2 showed no inclusions of calcium salts by micro CT, but quite a few showed calcium salts as <1% of the total volume of the stone, a level that is not likely to be detected spectroscopically. In a larger series, about 12% of majority uric acid stones were found to be pure [26], but the macroscopic methods used for analysis in that series were unlikely to have detected the presence of calcium salts with volume <1% of the total [35]. The content of calcium salts in uric acid stones may have clinical consequences, as this is a likely cause for failure of dissolution therapy [36].
4.6. Struvite by micro CT
Recognition of struvite in urinary stones is relied upon as a clinical indicator of infection [37], but analysis of struvite by commercial laboratories has been shown to be the most problematic of all the major stone minerals [38]. Similarly, our recognition of struvite solely by micro CT has not been without error; in our series of stones shown in Table 1, there were 49 specimens with majority struvite and 3 of these were missed (along with another 3 specimens falsely identified as struvite). Failure to identify struvite as a minority mineral has been even more common in our specimen series, as infection stones commonly present with alternating layers of apatite and struvite [2]. When the apatite dominates by volume and the struvite layers are relatively thin, it is quite easy to miss the minor content of struvite by micro CT. When the struvite layers are thicker, one can more easily recognize the middle-level of X-ray attenuation of the struvite (Figure 3) and identify that mineral properly.
Struvite stones. Infection stones are commonly of large size, and thus usually appear for analysis as multiple fragments retrieved from a suction reservoir following endoscopy. (A) Multiple fragments from a large stone, scanned en masse in a plastic container. Note that the X-ray attenuation of struvite is rather low, but struvite stones commonly also contain apatite. (B) Higher resolution of a struvite stone fragment to show the typical microstructure of this type of stone.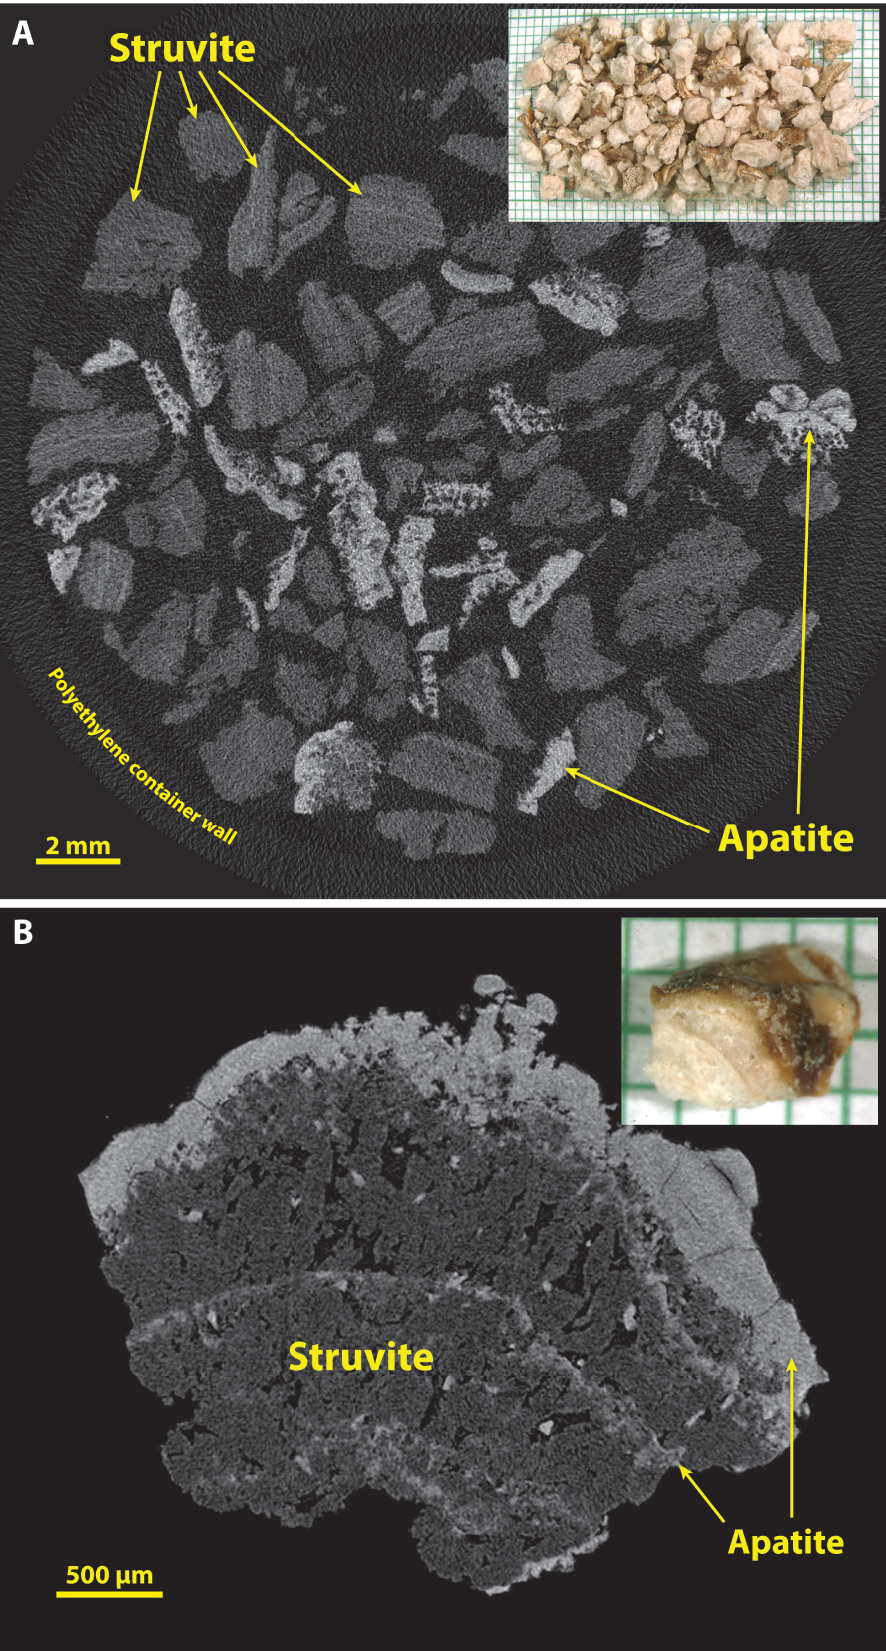
In our experience, struvite is most commonly encountered in large stones, which for analysis often consist merely of fragments that have been recovered from the saline suction reservoir, as shown in Figure 8A. In this setting, it is generally easy to recognize struvite fragments by their mid-range values for X-ray attenuation (Figure 3), invariably accompanied by fragments containing apatite. Figure 8A also illustrates the ability of micro CT to scan a large specimen of stone fragments at once. It should be noted, though, that the scanning of such a large specimen generally can be done only at lower values for image resolution, and usually with increased noise in the image. Some micro CT systems have the ability to scan such large specimens at high resolution, but the scan times are correspondingly long and the image files excessively large. An alternative is to scan collections of fragments at lower resolution and then select single fragments for scanning at higher resolution, as shown in Figure 8B, which shows coarse crystals of struvite sandwiched by apatite.
4.7. 3D surface renderings using micro CT
Because the micro CT image stack is typically composed of cubic voxels, it is a straightforward process to carry out a surface rendering to reveal 3D structure. This method is especially powerful for small stones, which can be scanned at high resolution. Figure 9 shows such an example of very early growth of a COM stone onto a piece of Randall’s plaque that was pulled from the tip of the renal papilla. The surface renderings (shown in panels A and C) show collecting duct lumens with great clarity. However, the mineralized tubules at the edge of the Randall’s plaque (such as that indicated by the left arrowhead in the slice image shown in panel B) were not visualized by the surface rendering method, presumably because of unevenness in the X-ray attenuation of the apatite in Randall’s plaque. Note that the photograph in Figure 9A does not show the collecting ducts so easily seen in the micro CT surface rendering. This is probably because the surface of the stone was covered with X-ray-lucent organic material (including epithelium covering the plaque and lining the lumens of the collecting ducts) that obscured the view in the photograph.
Using micro CT to visualize structures in three dimensions (3D). Shown are images of a small calculus that had been adherent to the renal papilla. The bulk of the “stone” was actually well-developed Randall’s plaque, with a small region of COM overgrowth from the urine. (A) 3D surface rendering showing the side of the calculus that faced the urine. Lumens of collecting ducts (about 100–150 μm in diameter) through the mineralized plaque are obvious. (B) Micro CT slice through part of the calculus showing COM overgrowth and the lumens of thin limbs and vessels within the plaque region (arrowheads). (C) Surface rendering of the underside of the calculus. Micro CT scan of this calculus was high resolution (2.08 μm voxel size).
Comparison of the ability of micro CT to show surface features with the superior ability of scanning electron microscopy (SEM). Inset upper right shows stone with apparent Randall’s plaque umbilication (arrowhead). Inset upper left shows micro CT surface rendering from an image stack (with 5.9 μm cubic voxels). The plaque region is recognizable in the micro CT surface rendering but is unable to show the detail apparent by SEM (background and inset lower right).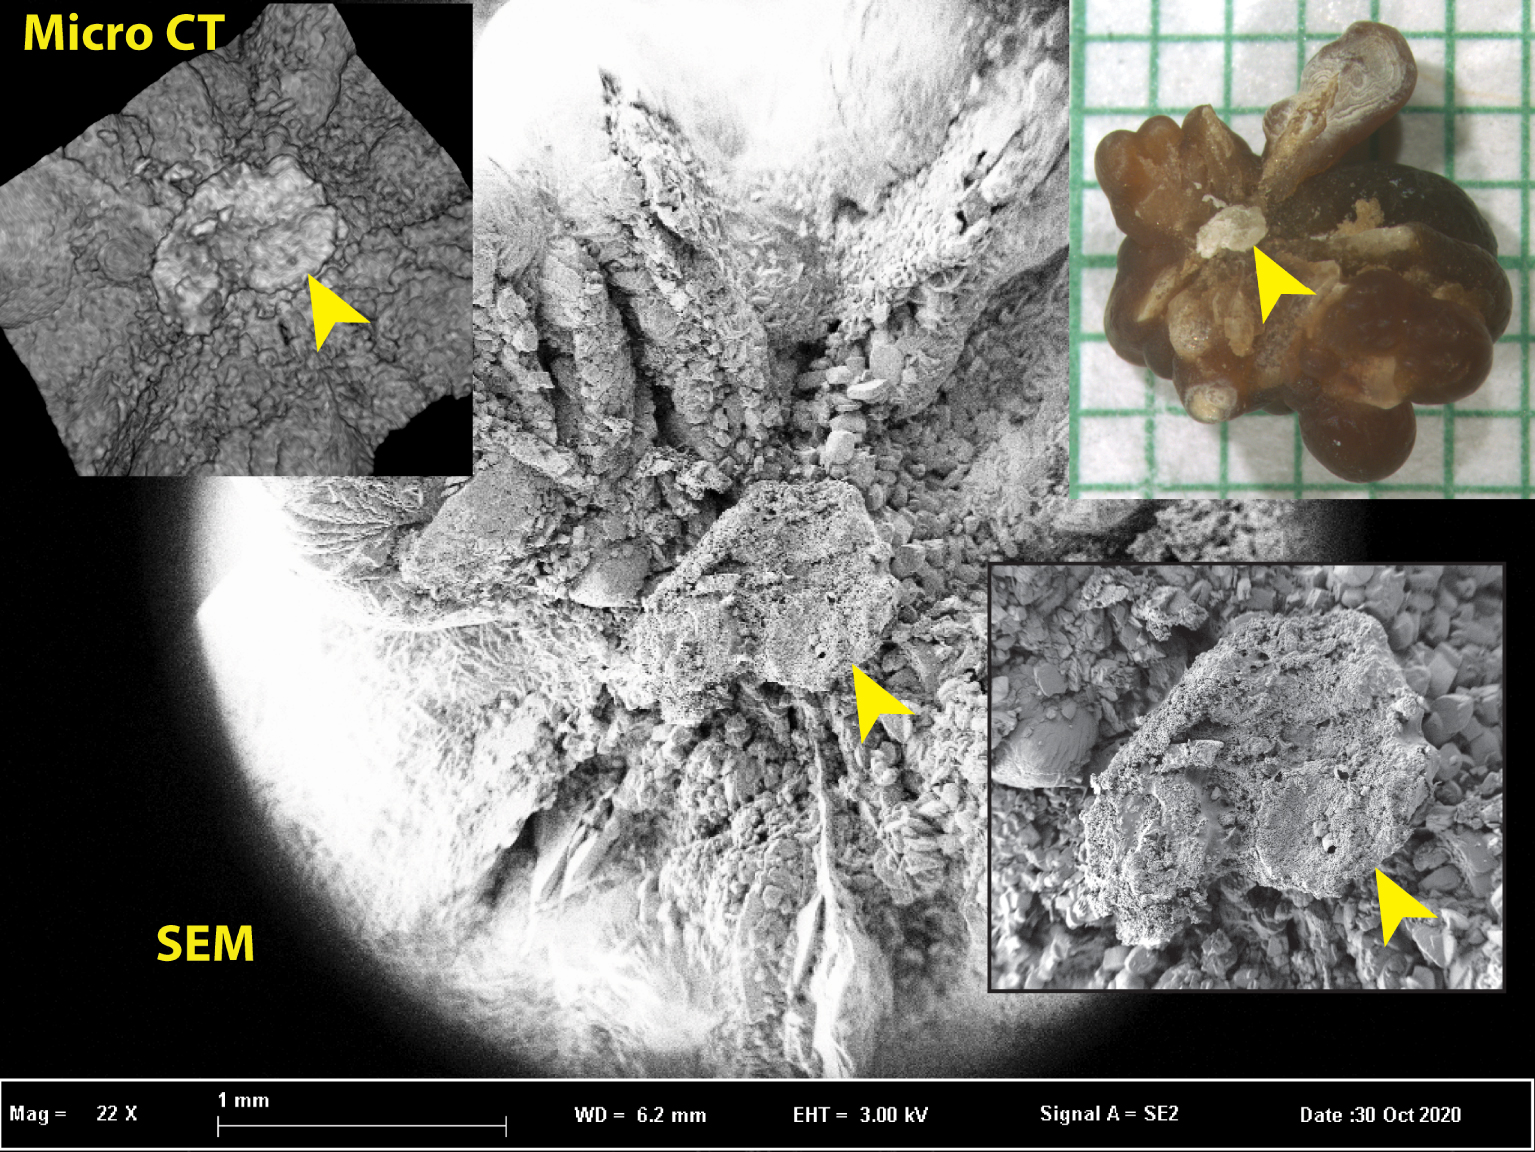
Surface rendering with micro CT cannot provide the surface detail visible using SEM, as shown in Figure 10. The surface rendering easily shows the region of Randall’s plaque—which is also easily seen in the photograph—but with very little detail on the plaque. Because this stone was much larger than the calculus shown in Figure 9, it could not be scanned with as high a resolution, and so the quality of the 3D rendering is correspondingly lower. Surface details are seen much more clearly with SEM.
5. Conclusion
Micro CT is a powerful tool for visualizing urinary stones. The X-ray attenuation values of common stone minerals allow easy visualization of stone structure and mineral identification, especially if an attenuation standard is included with a specimen. However, micro CT alone cannot identify many rarer stone types, which still require spectroscopic analysis. The 3D rendering capabilities of micro CT provide insight into the structure of nascent stones, and thus this method has great value in the study of pathophysiological mechanisms of stone disease.