


 CC-BY 4.0
1. Introduction
Biorefining is a sustainable approach requiring the conversion of biomass with objectives of minimum energy consumption, maximizing the total value of production and considering the concept of zero waste [1]. Biorefinery could easily bring social and economic benefits through the integrated production of fine chemicals and biobased products. Full recovery technology is achieved in several stages depending on the chemical composition of the feedstock and market demand for final products.
A suitable feedstock for biorefining is spruce bark resulted as waste in large amounts from forestry and wood processing. In Europe, the quantity of wastes from wood processing activities is around 2.6 million tons per year which means 237.210 tons of reusable residues per year [2]. The spruce bark represents a waste difficult to handle due to the high content of extractibles, as well as to the resistance to pulping. Therefore, it is commonly used to produce electricity and heat [3]. The literature reported topics on the primary biorefinery of spruce bark focused main on the separation and recovery of polyphenols [4, 5, 6]. An alternative to this limited use and in order to valorise the chemical potential of the spruce bark, a two stage biorefining flowsheet was proposed [1]. In the primary biorefining step the goal was the separation of polyphenols and low molecular polysaccharides, while in the secondary stage, a thermochemical process (slow pyrolysis) was proposed, in order to obtain a solid fraction (biochar) and a liquid phase (bio-oil).
Generally, the applications of biochars are multiple being used as fertilizer, carbon sequestration agent, amendment for soil, as adsorbent or support material, to produce power and heat [7]. As well, pollutants removal can be successfully achieved by biochars, substituting commercial activated carbons which are more expensive [8]. Biochars obtained from various feedstock such as agricultural residual biomass [9], pine sawdust [10], rape straw [11], peanut shell [12] have been tested to remove lead from contaminated water. The retentions capacities of these sorbents vary in wide range, depending on the properties and structure of each material.
Lead is a heavy metal with a wide range of industrial applications such as the manufacture of batteries, laminates and extruded, alloys, cable sheathing, etc. [13, 14, 15], and therefore large amounts of industrial effluents containing this pollutant are discharged. Water containing high concentrations of lead (II) ions can cause serious human health problems due to its toxic and carcinogenic effect [16], as well as the degradation of environmental quality [17]. Therefore, the removal of lead (II) from industrial wastewater has become a major issue. Numerous methods have been developed for the treatment of Pb-contaminated waste water streams including ion exchange [18], precipitation [19] or membrane filtration [20].
These methods have a number of advantages, as well as some drawbacks. Ion-exchange method has a very good removal rate, rapid kinetics and high treatment capacity, however produce an important secondary pollution by the regeneration of the ion-exchange resins and also is an expensive process. Precipitation is relatively simple to operate, with good removal results and low costs in the first phase, but is a slow process, requires great quantities of chemicals, creates large amounts of sludge that induce costs for disposal. Membrane filtration has a high efficiency for lead removal, required small equipment space and it is easy to operate. However, it is based on a complex process with high cost of application and require low wastewater streams [21].
In this regard, the development of a cost-effective remediation method is necessary. Adsorption is a preferred method for removing and/or recovery of harmful pollutants from wastewater either cations [22] or anions [23, 24]. Moreover, the use of a waste-based sorbent is environmentally friendly and cost-effective, since the sorbent could be available in large quantities.
The goal of this study is (i) to investigate the performance of a bio-based sorbent resulted from spruce bark (PBc) conversion through slow pyrolysis for the adsorptive removal of a highly toxic contaminant like Pb (II). As well, (ii) the adsorption kinetics assays for Pb(II) were performed considering pseudo-first and pseudo-second order kinetic models. To the best of our knowledge, spruce bark biochar is study for the first time as a waste-based sorbent with application in effective remediation of environmental hazardous.
2. Experimental
2.1. Bio-based sorbent preparation
The spruce bark tested in this experimental research was obtained as waste from a wood processing plant. Before use, the spruce bark was dried at room temperature (22 ± 2.5 °C) under normal aeration conditions and grounded in a GrindoMix GM 2000 mill, until a particle size distribution of 0.25 to 1.25 mm. The lead adsorption is a solid–liquid process which occurs over the surface of the adsorbent, so smaller particles induce a larger specific surface and improve the process.
However, very small particles (⩽0.25) are very hard to handle especially considering the possible scale up of the process. Moreover, the particle size from 0.25 to 1.25 mm is the larger fraction in the particles size distribution of spruce bark wastes and for this reason we considered the best choice for study [25].
In order to obtain the bio-based sorbent, several processes were applied to the feedstock. Extractibles separation was done using an ultrasound-assisted extraction with EtOH 70%. This method was chosen based on data reported in literature, which recommends it as a fast, economical and efficient method for separating various bioactive compounds applicable to a remarkable variety of biomass [26, 27, 28, 4, 5, 6]. The studies show that this technique is simple to operate and the process can be optimized. An ultrasonic thermostatic bath Sonorex RK 100H (Bandeline Electronic GmbH & Co.KG, Berlin, Germany), with a frequency of 35 kHz, power of 80–320 W and possibility of adjusting the temperature from 30 to 80 °C, was used to extract the polyphenols. The ultrasound-assisted extraction followed the protocol described by Lazar et al. [27]. Spruce bark (5 g) was placed in an Erlenmeyer flask and 50 mL of 70% ethyl alcohol solution was added. The extraction was performed at 50 °C and 45 min extraction time. The residual biomass, remained after centrifugation at 4000 rpm for 4 min using a Hettich Rotofix 32 centrifuge, washed with distilled water and dried at 45 °C in the oven, was further subjected to pyrolysis.
Pyrolysis was performed in a glass reactor with inside diameter of 30 mm and a total length of 350 mm. 10 g of sample were used in each pyrolysis experiment. Gradually, the temperature in the reactor was increased with 10 °C/min, so that in 55 min the slow pyrolysis temperature of 550 °C was achieved. The temperature of 550 °C was maintained for 15 min. Following the pyrolysis process, three fractions are obtained: a solid fraction represented by biochar (PBc) tested further for biosorption applications, a liquid fraction and a gaseous one.
2.2. Characterization of sorbent
2.2.1. Proximate and ultimate analysis
PBc followed a proximate and ultimate analyses in order to point out the chemical profile. The Laboratory Analytical Procedures for standard biomass analysis (NREL) were applied for biochar characterisation [29]. The moisture content was assessed after samples were dried in a BINDER oven at 105 ± 3 °C while the ash content was carried out in a Nabertherm oven at 600 °C.
Micropores volume of PBc was determined by BET method. Degassing of the sample was done by vacuum heating at 300 °C while nitrogen absorption was performed using an Autosorb-1MP (Quantachrome) plant at 77 K. The total volume represents the amount of nitrogen adsorbed at P∕P0 = 0.99 and transformed into liquid. The t method was used to calculate the volume of micropores, and the amount of mesopores was determined by difference between the total volume and the volume of micropores.
2.2.2. Infrared spectroscopy
Fourier transform infrared spectroscopy (FTIR) was applied for the qualitative assessment of functional groups on the surface of (PBc). A PerkinElmer Spectrum 100 Series FT-IR spectrometer was used to obtain the infrared spectra in a range of 400 to 4000 cm−1.
2.3. Analytical procedures and chemicals
Adsorption experiments were performed in batch mode using synthetic aqueous solutions containing Pb (II). A stock solution of 1000 mg/L was prepared by dissolving an appropriate amount of Pb(NO3)2 (Merck, analytical grade) in distilled water. Subsequently, lower concentration solutions were prepared. The sorption experiments were performed in Erlenmeyer flasks, containing 25 mL of Pb ion solution and 0.25 g/L adsorbent mass (excepting the adsorbent dosage test), accurately weighed. Stirring was assured by a GFL 3031 orbital stirrer in continuous mode (150 rpm) at constant temperature (22 ± 1 °C). The samples were filtered through a cellulose acetate membrane (porosity 0.45 μm). The metal ion concentration in the filtrate was performed using a GBC atomic absorption spectrophotometer, at 283.3 nm wavelength, in air/acetylene flame, with deuterium background correction, 0.5 nm slit, calibrations curves in a scale of 1–25 mg/L Pb and R2 > 0.995, with triplicate readings. When necessary, the pH was adjusted with a NaOH aqueous solutions (prepared from NaOH pellets 99% purity, Merck) or using HNO3 (prepared from HNO3 65% PA, Sigma Aldrich). All tests were performed in duplicate. All the plastic and glassware used was soaked for 24 h in HNO3 20% solution and dried in the oven after washed with distilled water.
2.4. Adsorption studies
2.4.1. Effect of pH
Preliminary tests were conducted to estimate the optimal pH for lead adsorption capacity. In this study, the experiments were performed in an acid pH range, as these are common conditions expected to be observed in most waste waters. Adsorption tests were performed with 20 mg Pb/L solution, at different pH (2, 3.5 and 5), using 0.25 g/L biochar, accurately weighed. pH was monitored regularly and readjusted, if necessary, to maintain a constant value (±0.5). The amount of lead adsorbed on equilibrium (q, mg/g) was calculated by a mass balance equation (1):
| (1) |
2.4.2. Effect of adsorbent dosage
The adsorbent dosage is an important parameter for the evaluation of the waste-based sorbent efficiency. Therefore, the effect of adsorbent dosage on lead sorption was studied. The experiment was performed for 20 mg/L Pb (II) initial concentration (C0), 4 h as experiment time, pH 5 ± 0.5 and adsorbent dosage values of 0.25, 0.5, 1.0, 2.0, 4.0 and 8.0 g/L. After 4 h, samples were filtered and concentrations of lead in liquid phase were measured. Equation (1) was applied to calculate the amount of lead removed.
2.4.3. Adsorption kinetic study
Kinetic studies were performed at pH 5 ± 0.5. The suspensions were stirred for different pre-set times (5, 15, 30, 60, 120, 240, 480 min) in order to achieve the Pb concentration decay. To evaluate the effect of the initial waste-based sorbent dose on the kinetic parameters, two initial concentrations (C0) of Pb (II) were tested, 20 mg/L and 50 mg/L, while a dose of sorbent (Cs) of 0.25 g/L was applied. The lead concentration in the liquid phase was recorded as a function of interaction time, also using (1).
2.4.4. Equilibrium study
Equilibrium study provides information about the affinity of the biochar to the metal and indicates the maximum adsorption capacity that can be expected. Sorption isotherm was determined at pH 5 ± 0.5, using a biochar dose of 0.25 g/L (accurately weighed for each sample). The lead concentration ranged between 7.5 and 100 mg/L. Equilibrium studies were performed in Erlenmeyer flasks and the volume of lead solution in each flask was 25 mL. After the equilibrium point was achieved (about 4 h), the residual lead concentration (C) was determined and the amount of Pb adsorbed per biochar mass unity (q) was calculated following (1). Although, in this case, C corresponds to the equilibrium lead concentration (Ce) and q to the equilibrium absorbed quantity (qe).
3. Results and discussions
3.1. Sorbent characterization
The chemical characterisation of PBc started with an assay of the moisture and ash content and was completed by ultimate analysis that point out the main elements present in biochar samples. As expected, the tests performed to determine the chemical profile of the biochar confirmed its high carbon content (Table 1).
Main spruce bark biochar chemical characteristics
| Property value | Unit | Value |
|---|---|---|
| Proximate analysis | ||
| Moisture content | wt% (dry) | 2.6 ± 0.7 |
| Ash content | wt% (dry) | 22.5 ± 0.9 |
| Ultimate analysis | ||
| Carbon | wt% (dry) | 70.2 ± 0.6 |
| Hydrogen | wt% (dry) | 1.9 ± 0.1 |
| Nitrogen | wt% (dry) | 0.4 ± 0.1 |
| Sulphur | wt% (dry) | 0.05 ± 0.10 |
The porosity and specific area are important properties of an adsorbent material and together with the functional groups on the surface contribute to the removal capacity of pollutants. Literature reports that the biochars surface area ranges between 8–132 m2/g, while the total pore volume has values between 0.016–0.083 cm3/g. Micropores and mesopores are the most important parts of the pore volume for biochars. The volume of the micropores can vary significantly and in some cases could reach values of over 50% of the total pore volume [30].
FTIR spectra of pyrolyzed biochar.
For spruce bark biochar resulted through slow pyrolysis, the BET analyses revealed a specific surface area of 62.3 m2/g and an adsorption volume of 0.09 cm3/g. However, the modest presence of micropores (0.008 cm3/g) indicates only a weak activation of biochar. This relatively low activation can be explained by the moderate temperature use to achieve the biochar (550 °C), the objective being to obtain a bio-based material with good retention characteristics using soft and cost-efficient operational parameters.
Most probable, the increase of pyrolysis temperature would lead to a better activation of biochar, with a higher volume of micropores and consequently with a higher capacity to remove pollutants but also with noticeable higher costs.
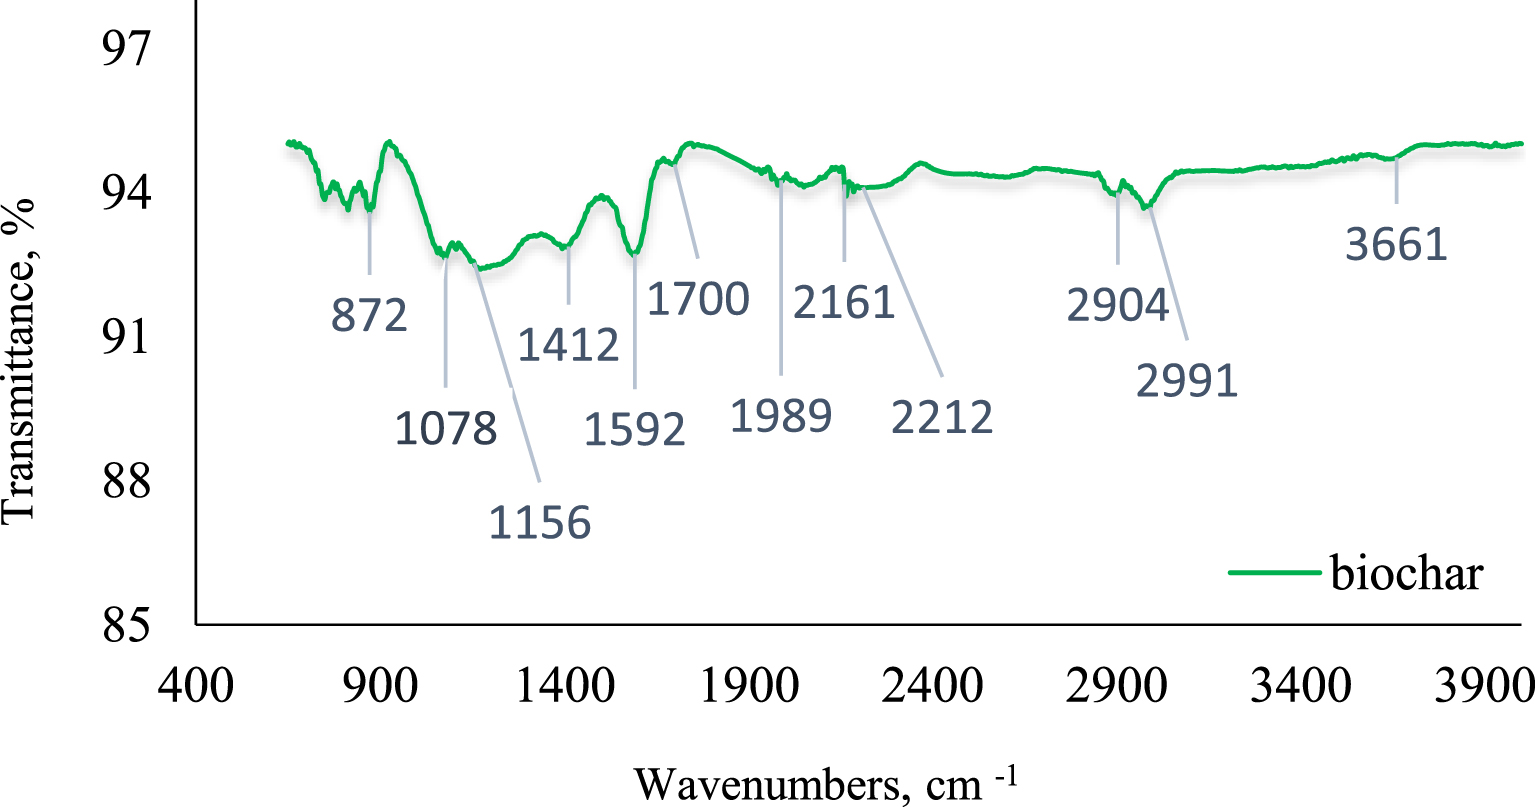
The identification of the functional groups present on the surface of the bio-based material is extremely important in order to evaluate the possible binding sites and to explain the biosorption mechanism. FTIR analysis highlights a complex compositional structure of the biochar, the recorded spectra showing many absorption bands corresponding to different functional groups (Figure 1).
The identification of functional groups in biochar and the classification of FTIR spectra bands are based on the assignments reported in literature [31, 32, 33, 34, 35].
According to Chupin [33] the broad bands between 3700–3300 cm−1 could be attributed to the hydroxyl (OH) groups, present in aliphatic and phenolic structures. Absorption at 3300 cm−1 and 2920 cm−1 corresponds to the aliphatic fragments of the cellulose [34]. The peaks with a lower intensity, located between 2930 and 2850 cm−1, correspond to the vibrations of the existing C–H bonds in the aromatic methoxy, methyl and methylene groups of the side chain [36]. The band at 1690–1740 cm−1 is assigned to C=O [36] stretching of carbonyl group typical of xylan and hemicelluloses [37]. The lignin is found at peak 1592 cm−1 for C=C stretching of the aromatic ring [36] and [37]. The pick detected at 1412 cm−1 is assimilated with –CH deformation combined with aromatic ring vibration. Bands from 1400 cm−1 to 2000 cm−1 are assigned to the aromatic nature of the structure. The pick at 1156 cm−1 is assigned for C–O–C asymmetric valence vibrations [38, 39]. Dirckx et al. [36] and Schwanninger et al. [39] described this signal to C–O–C vibration of cellulose. The wavenumber 1078 cm−1 is determined by aliphatic C–O stretching which reflect the cyclic nature of the ether. All signals located below 900 cm−1 correspond to aromatic C–H stretch vibration.
3.2. Effect of pH variation
The electronic loading of biochar surface and the speciation of the metal are influenced by the pH of the aqueous solution. At pH < 6, the predominant form of lead is the divalent cationic one (Pb2+). Hydrolysed lead species, such as Pb(OH)+, Pb(OH)2− and Pb(OH)3−, begin to form at a basic pH [40]. To avoid the retention of other lead species and the precipitation of Pb(OH)2, an initial pH (pHi) between 2 and 5 was studied. As the pH increases, deprotonation of functional groups occurs, the repulsive forces between H3O+ and Pb2+ ions decrease, while the access of the pollutant to the active centres becomes easier. Carbonaceous materials typically show pKa values of weak acidic sites assigned to carboxylic functional groups (pKa < 5) [41].
Veiga et al. [42] reported values of pKa for carboxylic groups between 3.3–4.7, and also at around 5.8 (less acidic carboxylic sites). This means that deprotonation of carboxylic sites at the biochar surface could start to prevail at pH 3–5, generating a negative surface charge on the solid which favours lead ions adsorption.
The capacity of sorbents to retain heavy metals generally increases with pH increasing without a linear dependence. However, too much pH favours the metal precipitation reaction. Hossain [43] and Ramteke [44] indicated that under alkaline conditions, heavy metals are deposited, and the amount of heavy metal removal is reduced. At a low pH, the negative charge density occurs on the sorbent due to the carboxyl, phosphate and amino groups; this negative charge density creates attractive centres for electrophilic metal cations [44], but the surface charge densities are also lower than the optimal acidity which means that the surface tends to be positively charged, thus preventing the surface from interacting with metal cations. Also, another explanation of the fact that the adsorption capacity increases with the increase of pH, is that the solubility of metal ions, and therefore of lead ions, at high pH values, is low [45].
In this study, a significant influence of pH on the amount of adsorbed lead was observed. In the pH range of 2–5 ± 0.5 there was an increase in the amount of adsorbed Pb (II) from 0.83 ± 0.12 to 23.36 ± 0.61 mg/g (Figure 2).
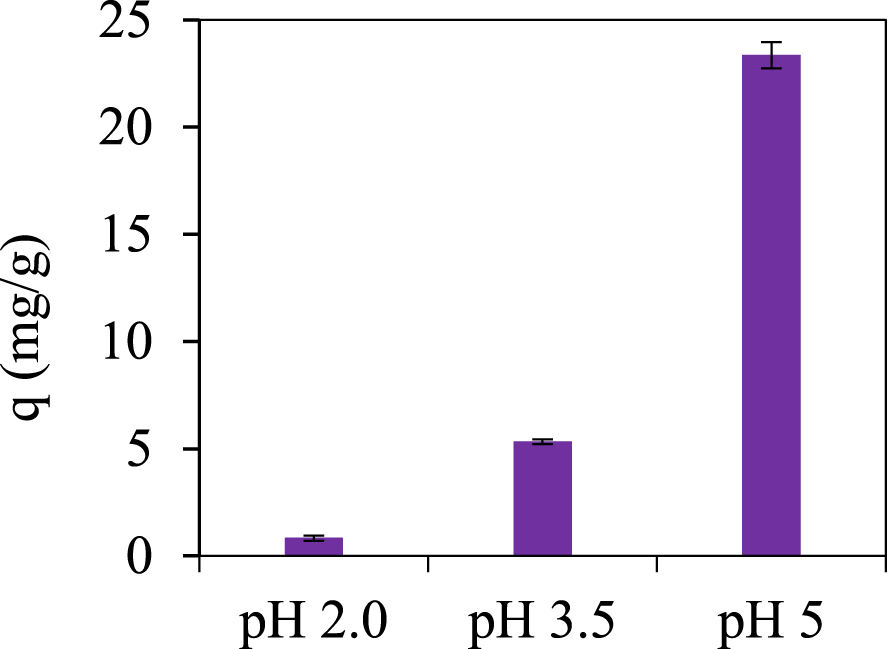
Adsorbed amount (± global uncertainty) of Pb(II), C0 = 20 mg∕L, Cs = 0.25 g∕L, different pH.
At the native pH of lead solution (5–5.5), biosorption due to electrostatic attraction and/or chelation may be responsible for removing large amounts of pollutant ions. Together with the deprotonation caused by pH value, the carboxylic groups present on the surface of the biochar remain negatively charged, which lead to an electrostatic attraction between these negative groups and the positive charge of the lead ions. As well, the other various functional groups revealed by FTIR analysis on the adsorbent surface (related to the aromatic structure) could induce the removal of lead ions by chelation [46]. Consequently, the pH of Pb(II) solutions will not be altered by the following experimentally biosorption tests. This avoids the introduction of foreign ions into the solution, as well as the costs of controlling the pH before and after the process.
3.3. Effect of adsorbent dosage
The influence of the initial sorbent dose in the biosorption of lead on PBc are shown in (Figure 3), Lead concentration in solid phase, q (mg/g), evaluates the capacity of spruce bark biochar to adsorb lead from aqueous effluents. The maximum adsorbed amount of 38.17 ± 1.14 mg/g corresponds to a PBc dose of 0.25 g/L, progressively decreasing to 1.755 ± 0.002 mg/g recorded at a solid/liquid ratio of 8.0 g/L.
At the same time, at 0.25 g/L of biochar used, the removal efficiency has the lowest value, but still high, almost 70%, increasing progressively with the increase of the biosorbent dose up to more than 95% for a solid/liquid ratio of 4 or 8 g/L.
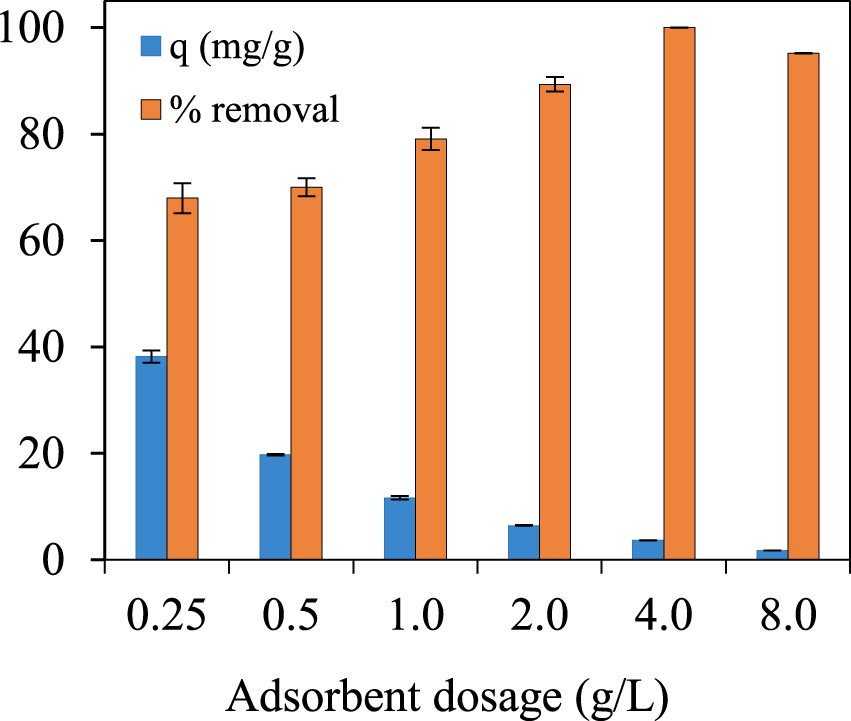
Adsorbed amount (± global uncertainty) of Pb(II), C0 = 20 mg∕L, pH 5 ± 0.5, different initial PBc dosage.
Based on these data, the experiments were conducted considering a waste-based sorbent dose of 0.25 g/L.
3.4. Adsorption kinetic
The adsorption kinetic study establishes a predictive model for sorption behaviour. Is an important step to define an interdependence between equilibrium phenomenon and mass transfer.
The (Figure 4) shows the effect of time (t) on the removal capacity of the PBc for lead ions.
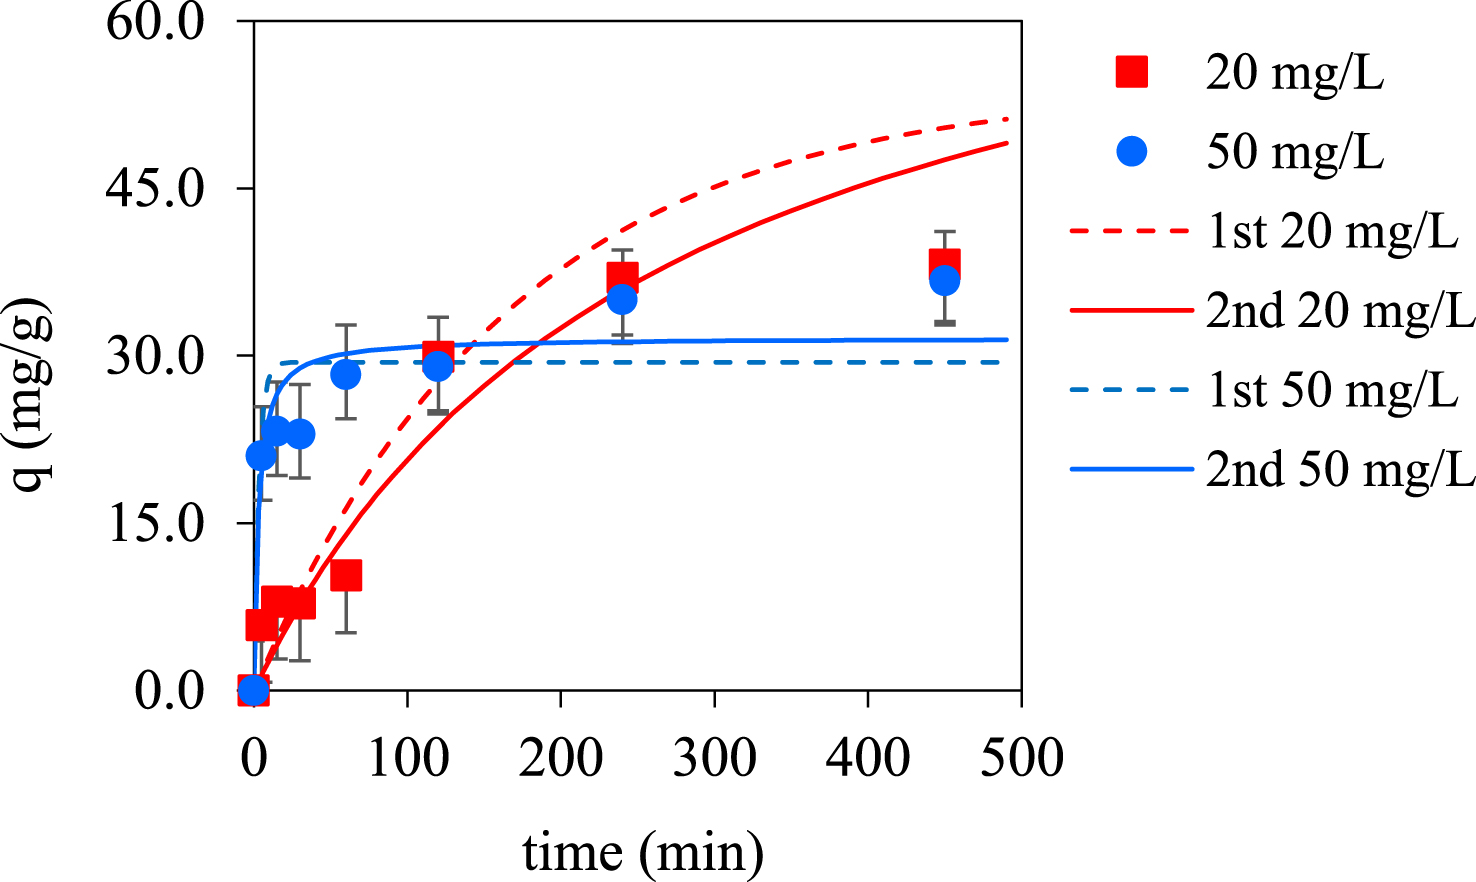
Kinetics for Pb(II) biosorption on spruce bark biochar (values ± global uncertainty) at different initial concentration of 20 and 50 mg/L Pb, biochar dosage 0.25 g/L at 22 ± 1 °C: experimental data and pseudo-first (1st) and pseudo-second (2nd) order model.
Lead adsorption is a quite fast process. The time required to get very close to reaching equilibrium was about 120 min. After approximately 4 h of contact, no significant changes in the amount of lead adsorbed by the sorbent occurs. This short equilibrium time is very important for practical application and mean the use of short columns for continuous operation, which is further reflected in the efficiency and economy of the system [47].
Parameters (value ± standard error of the coefficient) for pseudo-1st order and pseudo-2nd order modelling for the biosorption of Pb(II) by PBc at different initial adsorbate concentrations (pH 5 ± 0.5, 0.25 g/L biochar, 22 °C)
| C0 (mg/L) | Pseudo-1st order model | Pseudo-2nd order model | ||||||
|---|---|---|---|---|---|---|---|---|
| k1 (min−1) | qeq (mg/g) | R2 | SE | k2 103 (g⋅mg−1⋅min−1) | qeq (mg/g) | R2 | SE | |
| 20 | 0.009 ± 0.002 | 40.5 ± 3.9 | 0.95 | 3.74 | 0.14 ± 0.08 | 52.5 ± 8.4 | 0.94 | 4.13 |
| 50 | 0.19 ± 0.09 | 29.8 ± 2.2 | 0.83 | 5.06 | 6.8 ± 3.3 | 32.46 ± 2.09 | 0.91 | 3.77 |
Lagergren pseudo-first-order (2) and pseudo-second-order models [48], Equation (3), were adjusted to the experimental data, by nonlinear regression using CurveExpert Professional software and results are presented in Table 2. The pseudo-first order model considers that the sorbent surface is homogeneous, the active centres having the same affinity for the metal ion. Consequently, the occupancy rate of the active centres and the number of available centres is correlative.
| (2) |
Pseudo second order model, represented by the (3), is based on the sorption ability of the solid phase assuming a homogeneous surface and metal binds to two active centres.
| (3) |
In both (2) and (3), q (mg/g) is the adsorbed amount for a certain interaction time, t (min), qe (mg/g) is the adsorbed amount at equilibrium, k1 (min−1) and k2 (g⋅mg−1⋅min−1) are the kinetic constants of the models.
For an initial Pb concentration of 20 ppm, the pseudo 1st order model provided a slightly better fitting, with a higher correlation coefficient, lower standard error (SE) and predicted values for the adsorbed amounts at equilibrium (qe) closer to the experimental data. However, for an initial concentration of the 50 ppm lead solution, the pseudo 2nd order model better describes the experimental data, with a lower standard error (SE), better correlation coefficient and an adsorption capacity closer to de experimental one.
It seems that with the increasing of the initial concentration of the lead solution, the biosorption mechanism changes, passing from diffusion through the interface to a chemisorption where the adsorbed amount is dependent on adsorption capacity not on concentration of adsorbate [49].
3.5. Equilibrium study
The adsorbent selectivity and efficiency as well as the maximum biosorption capacity of the adsorbent are studied by biosorption equilibrium which provides important information on these issues. The biosorption isotherm for Pb(II) removal by spruce bark biochar is presented in Figure 5. Results were obtained at 22 ± 1 °C, using an adsorbent dosage of 0.25 g/L and varying the initial concentration of lead from 7.5 to 100 mg/L.
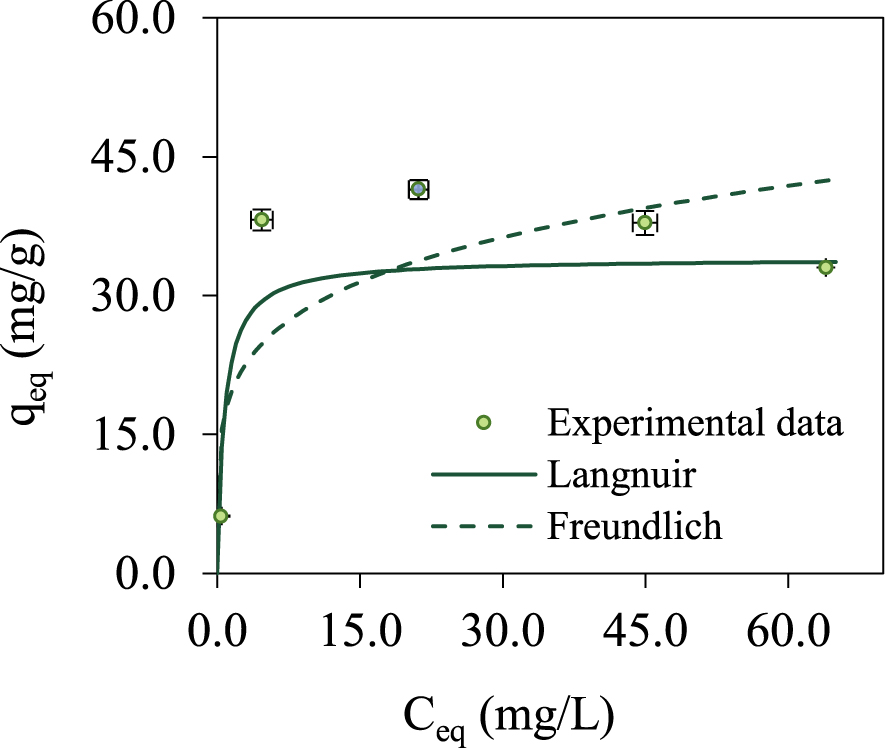
Equilibrium isotherm for Pb biosorption on spruce bark biochar (values ± global uncertainty) at pH 5, 0.25 g/L adsorbent and 22 ± 1 °C: experimental data and modelling.
Parameters obtained from equilibrium models fittings (value ± standard error of the coefficient) for Langmuir and Freundlich models for the biosorption of Pb(II) by spruce bark biochar at different initial lead concentrations (pH 5 ± 0.5, 0.25 g/L biochar, 22 ± 1 °C)
| Langmuir | Qmax (mg/g) | 34.364 ± 0.001 |
| KL (L/mg) | 1.2819 ± 0.0003 | |
| SE (mg/g) | 1.79 | |
| R2 | 0.99 | |
| r | 1.00 | |
| Freundlich | nF | 5.2 ± 0.4 |
| KF (mg⋅g−1 (mg⋅L−1)−1∕nF) | 24.4 ± 1.2 | |
| SE (mg/g) | 1.61 | |
| R2 | 0.99 | |
| r | 0.99 |
The most frequently used equilibrium models, Langmuir (1918) and Freundlich (1906), were fitted to the experimental data by non-linear regression using the CurveExpert software.
The Langmuir model assumes a monolayer coverage of adsorbed species with a uniform distribution of the active centres on biosorbent surface, with a constant adsorption energy and the same affinity. The Langmuir model is expressed by (4), where Qmax indicates the maximum biosorption capacity and KL is Langmuir constant.
| (4) |
Langmuir isotherm can be expressed in terms of a dimensionless constant, separation factor (RL) [50] defined by the (5).
| (5) |
This constant predicts if biosorption system is favourable (0 < RL < 1), unfavourable (RL > 1), linear (RL = 1) or irreversible (RL = 0).
The Freundlich model is expressed by (6), where KF is a constant associated to the adsorption capacity and nF a constant indicating the adsorption intensity (nF > 1, favourable isotherm; nF⩽1, unfavourable isotherm). This is an empirical model that defines that the biosorbent surface has different energy active centres, so a heterogeneous surface.
| (6) |
Table 3 presents the parameters calculated for both models. Standard regression errors of the model (SE) and the correlation coefficient (r) are presented as statistical parameters to evaluate the adaptation of the model to experimental data. Both models fit very well on experimental data, for both models the determination coefficient R2 is 0.99. Even so, the Langmuir model best describes equilibrium data, with a correlation coefficient of 1.00, and predicted a maximum biosorption capacity close to value obtained by tests, more exactly 34.364 ± 0.001 mg/g. Also, the separation factor RL calculated by (5), using the highest initial Pb concentration, is 0.01, a value between 0 and 1, which indicates a favourable process.
Some research studies have been published recently related to the removal of lead from aqueous solutions on biochars. In Table 4 are highlighted different types of biochars, obtained by pyrolysis from various feedstock to which additional treatments have been applied or not in order to increase the uptake capacity.
Adsorption capacities for various types of pyrolytic biochars for Pb
| Type of adsorbent | Additional treatments | Pyrolysis temperature | Adsorption capacity, mg/g | References |
|---|---|---|---|---|
| Picea abies | - | 550 °C | 34.36 | Present study |
| Larch biochar | Amended with wood ash | 485–530 °C | 61.5 | [51] |
| Maple wood | - | 500 °C | 43.3 | [52] |
| Corncob | HCl washed, dried, milled/ZnO impregnated | 600 °C | 25.8 | [9] |
| Cow manure | - | 350–700 °C | 230 | [53] |
| Wheat straw | Dried wheat straw and hematite | 800 °C | 196.91 | [54] |
| Cigarette factory waste | Bentonite and calcite mix | 700 °C | 500 | [55] |
| Dairy manure | Alkaline treatment | 300 °C | 175.53 | [56] |
| Banana peels | - | 600 °C | 247.1 | [57] |
| Cauliflower leaves | - | 600 °C | 177.82 | [57] |
| Piggery sludge | Thiourea treatment | 300 °C | 145 | [58] |
Table 4 highlighted that there are biochars with a considerably high Pb removal capacity as well as some with a lower one. Higher uptake capacity is due to the treatments applied prior adsorption or to the chemical composition of feedstock that consequently influent the structure of biochars. The literature mentioned that feedstocks containing large amount of cellulose and lignin will generate biochars with a lower adsorption capacity [59].
Integrating the data generated in this study in the context of findings reported in the field and taking into account the low initial Pb concentration (very difficult to remove), the small PBc dosage used, the medium temperature used for PBc obtaining and the fact that no additional treatment was applied for a possible enhancement of the removal capacity, it can be considered that spruce bark biochar is a cost effective adsorbent with a high lead removal capacity and high potential for efficient remediation of hazardous pollutants.
4. Conclusions
Adsorption is an important technique for wastewater remediation due to its high selectivity, particularly of highly toxic species given its efficacy in low concentrations.
The biochar used here as a bio-based sorbent for lead uptake was prepared through a biorefinery process from a readily locally available resource, a forest/industrial waste (spruce bark).
The waste-based sorbent is a carbon rich material with many carboxylic and hydroxyl groups on the surface which could be involved in Pb(II) removal by electrostatic attraction forces and/or chelation.
For spruce bark biochar resulted through slow pyrolysis, the BET analyses revealed a specific surface area of 62.3 m2/g and an adsorption volume of 0.09 cm3/g. However, the modest presence of micropores (0.008 cm3/g) indicates only a weak activation of biochar. This relatively low activation can be explained by the moderate temperature use to achieve the biochar (550 °C), the objective being to obtain a bio-based material with good retention characteristics using soft and cost-efficient operational parameters.
Pb(II) biosorption kinetic on spruce bark biochar was pretty fast and well described by pseudo-second-order model. A significant influence of pH was noted for Pb(II) biosorption and the adsorbent dosage was evaluated. Maximum adsorption capacity predicted by the Langmuir model was 34.364 ± 0.001 mg/g (pH 5 ± 0.5, 0.25 g/L biochar, 22 ± 1 °C).
This study is an important starting point and further developments are open considering activation and functionalization of biochar as well as other hazardous pollutants and competitors’ uptake.
Conflicts of interest
Authors have no conflict of interest to declare.