


 CC-BY 4.0
1. Introduction
In industrial countries, cancer alongside circulatory system disorders (cerebrovascular and heart diseases) are the two most common causes of death [1, 2]. In particular, breast cancer constitutes a major public health concern, as it is the most frequent cancer in women [3, 4, 5, 6, 7]: with more than two million new cases reported worldwide in 2020 and a mortality rate accounting for 16% of all female related deaths [8]. As of now, mammography is considered the gold standard for breast cancer preventive screening [9, 10, 11]. This medical examination enables the observation of a broad range of breast tissue abnormalities, including abnormal mass and microcalcifications. However, mammography is an X-ray based imaging technique of the breast and does not provide histological or chemical information of these abnormalities.
Breast microcalcifications (BMCs) refer to up to one-millimeter diameter calcium-based mineral deposits within the breast tissue, that appear as white spots or blemishes on mammograms [12]. Despite being an indicator of breast lesions and routinely used for the diagnosis of non-palpable cancer [13], a lack of knowledge remains regarding the correlation between BMCs physical and chemical properties and the pathology. A BMC chemical classification exists and discriminates BMCs based on the basis of their chemical composition [14]. Two types of BMCs are distinguished: type I made of calcium oxalate dihydrate (COD), also called weddellite [15, 16, 17, 18, 19, 20], and type II composed of carbonated calcium phosphate apatite (CA) [21, 22, 23, 24, 25, 26, 27, 28]. Microcalcifications of type I are acknowledged to be associated with benign lesions, whereas type II with either benign or malignant lesions. However, this chemical classification is incomplete. Other chemical phases, such as whitlockite (Wk) and amorphous carbonated calcium phosphate (ACCP) have been observed in breast [13, 29, 30, 31, 32]. Recent studies suggested that physicochemical characteristics of BMCs may be related to the nature of the cancer and its severity [33, 34, 35]. Hence, BMCs physico-chemical speciation has potential to be relevant for clinicians.
This article draws an overview of the current information provided by BMCs, as well as the gaps that remain regarding their pathological role and aims to emphasize the need for further research to understand BMCs properties in regards to breast pathology. As shown in Figure 1, the article is divided into two main parts. First, Section 2 describes the existing clinical examination used in routine at the hospital for breast cancer diagnosis, and successively addresses mammography examination (Section 2.1) and histological analysis (Section 2.2). The role of BMCs in these processes will be emphasized. Then, Section 3 proposes an extensive description of the techniques for BMCs characterization. First, we will discuss field emission scanning electron microscopy (FE-SEM) analysis for the morphological description of BMCs (Section 3.1), then we will address vibrational spectroscopy techniques for the chemical speciation from the micrometric to the sub-micrometric scales (Section 3.2). The end of this section is dedicated to the thorough characterization of BMCs and describes methods that are mostly implemented in research laboratories like super-resolution vibrational technique. During this study, a multiscale approach was developed and tested on one specific clinical example to demonstrate its medical relevance and its suitability with standard sample preparation protocols routinely used in hospital anatomopathological departments.
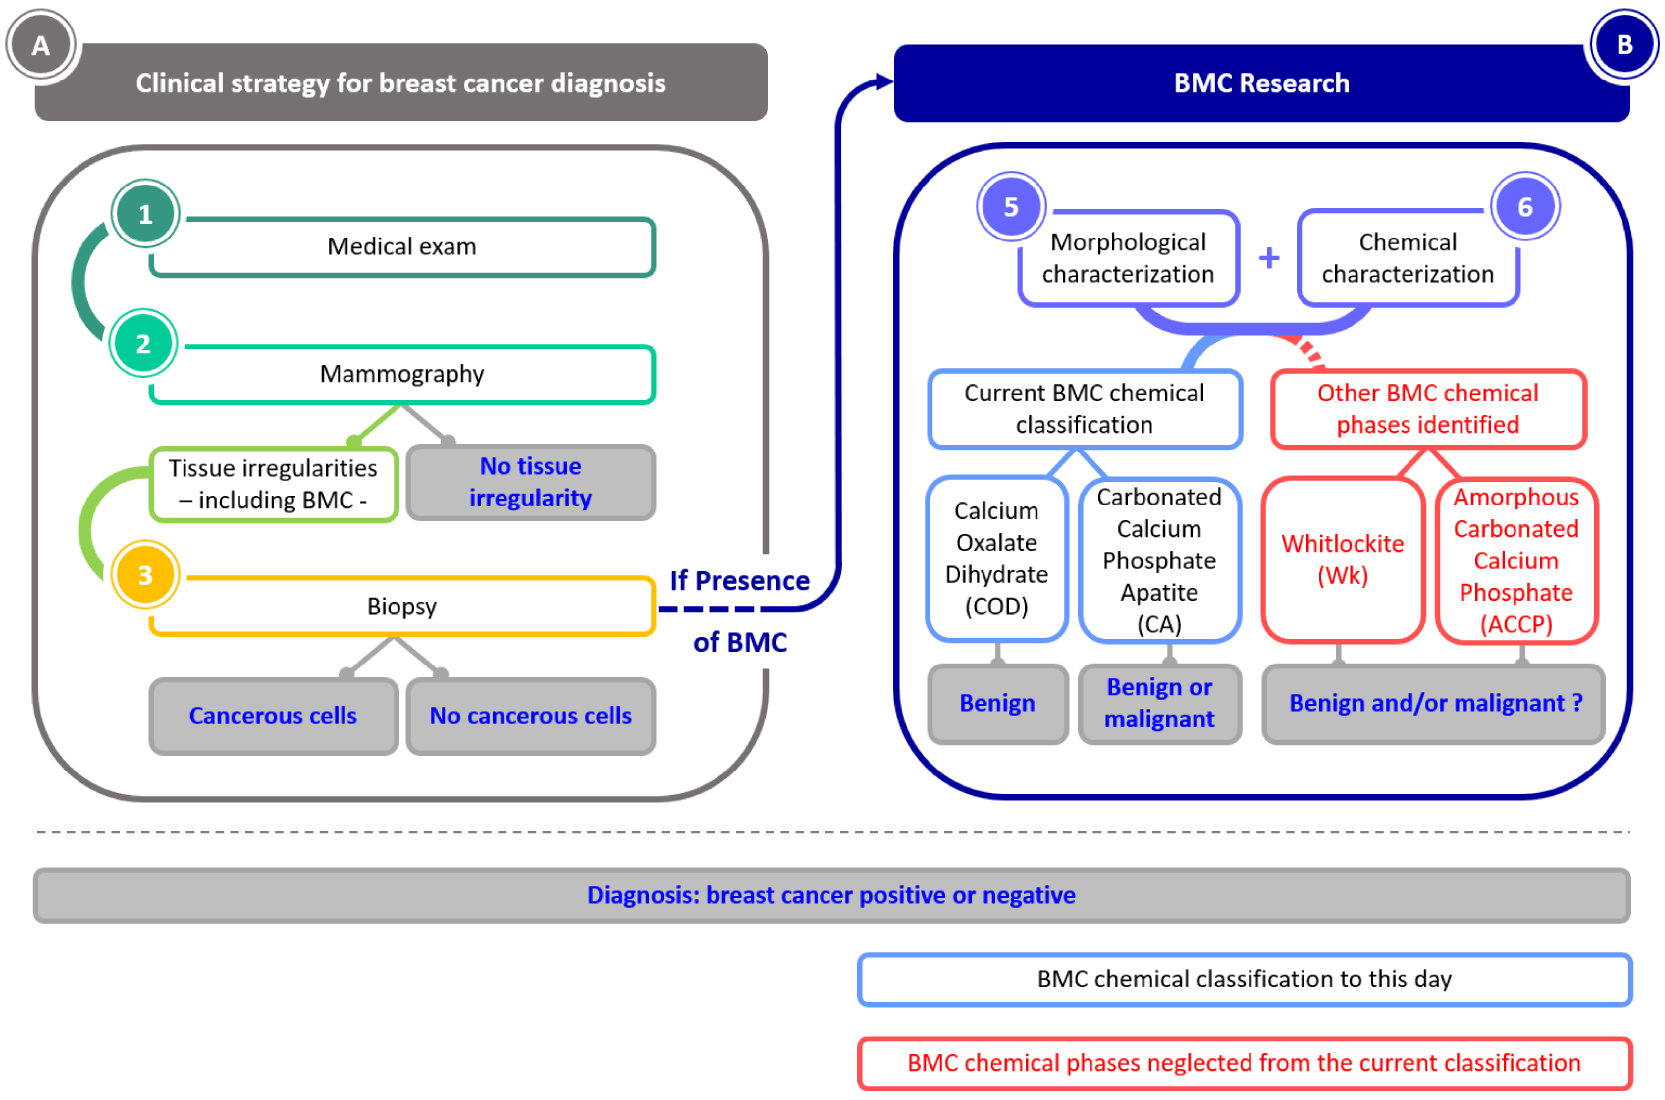
Schematic organization of the article. First the clinical strategy for breast cancer diagnosis, and then the ongoing research on BMCs that aims to understand their role in breast cancer.
2. BMCs as a contingent marker of breast cancer: clinical considerations
2.1. Mammography as the diagnosis starting point
Mammography is a procedure that consists of radiography of the breast. This technique, first described by the surgeon A. Salomon in 1913 in Berlin, is the medical examination of reference for breast cancer screening and constitutes the main strategy for early diagnosis. Standard medical systems have a spatial resolution of between a few dozen and a hundred microns [36, 37]. The presence of BMCs on mammograms is very valuable information as they are considered a benchmark of breast cancer early signs [38]. Some specific BMC features discernible on mammograms can be indicative of malignancy and raise concerns about the presence of cancerous cells. Several studies focused on fostering an understanding of the link between BMCs and breast cancer [13, 41, 42, 43, 44, 45, 46, 47, 48, 39, 40, 29] to clarify those concerning characteristics. They are five main BMC distributions: grouped (or clustered), linear, segmental, regional, and diffuse (Figure 2). In particular, grouped, regional and segmental distributions are considered as suspect BMC distributions and are associated with high risks of ductal carcinoma [11, 39, 49, 50, 51].
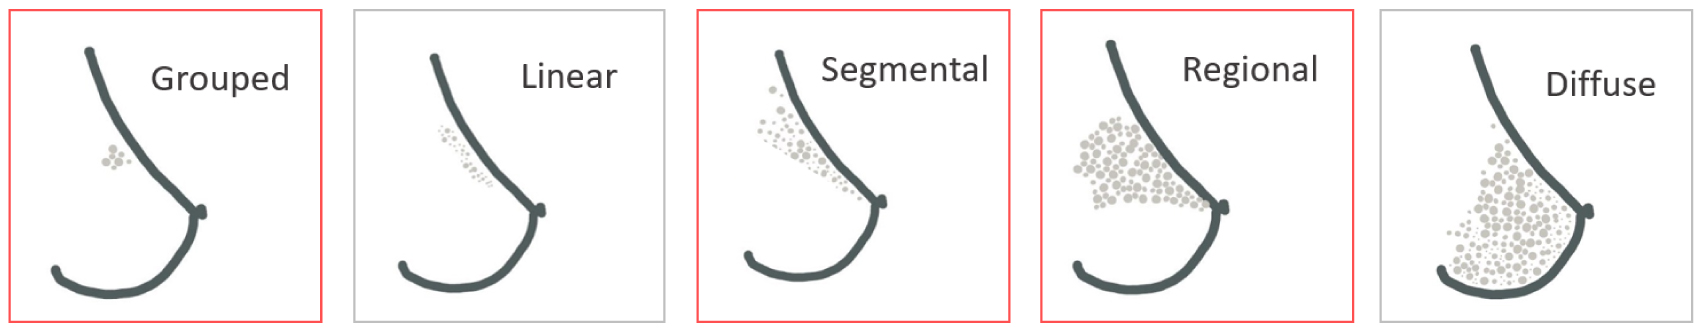
Main distributions of microcalcifications in the breast. Distributions highlighted in red are distribution associated with higher risks of breast cancer.
In addition to BMCs distribution, their morphological aspects are also used to suspect malignancies. Many BMCs morphologies have been described in the literature. Studies investigating the link between microcalcifications and cancer, have emphasized that fine pleomorphic and fine linear microcalcifications have a greater risk to be associated with malignancies (Figure 3), as reported in BI-RADS [49] (the acronym for Breast Imaging-Reporting and Data System: a classification system used worldwide by radiologists to evaluate breast lesions and the associated pathology).

(A) BMCs suspect morphological features. Digital zoom mammographic projection images show calcifications with increasing risk for malignancy, Rao et al. [52]. From left to right: coarse heterogeneous, amorphous, fine pleomorphic, and fine linear. Red arrows were added to highlight BMCs on the images. (B) Their relative risk for malignancy.
Those criteria—BMCs morphologies and distribution—help evaluate the risk of malignancies but do not allow to diagnose malignancy through the presence of BMCs.
2.2. Histological analysis: the utmost assessment for cancer diagnosis
Since mammograms do not enable to distinguish calcifications associated with benign from malignant pathologies, if any anomalies and suspect BMCs are observed on mammograms, histological analyses [53] will be performed to confirm or rule out the presence of cancerous cells (Figure 4). To this end, a fraction of suspect tissue has to be collected. Samples, for which the risk of cancer cells’ presence lies, can be harvested either through needle biopsy (fine needle aspiration biopsy or core needle biopsy) or surgical excision (lumpectomy or mastectomy) [54]. Thereupon, BMCs are used to make sure the sample was collected in the suspicious area of the breast but are not further used for the diagnosis. Thereafter resection (Figure 4A), samples are usually fixed using formalin and embedded in paraffin (Figure 4B, C). To this end, a 4 to 6 μm thick slice of the sample is cut from the paraffin block using a microtome and deposited on a glass microscope slide. Hematoxylin and Eosin (H&E) staining is performed after paraffin removal using xylene. H&E staining is the most largely used method for histopathological analysis. Hematoxylin complex with nucleic acids which takes a purple color, whereas eosin stains non-specifically proteins in pink [55] (Figure 4C). Thus, based on the morphology of the cell nucleus and cytoplasm, cancerous cells can be distinguished from healthy ones. If cancerous cells are observed, the stage of the cancer is accordingly evaluated on three criteria: nuclear polymorphism, glandular differentiation and mitotic count [56, 57, 58].
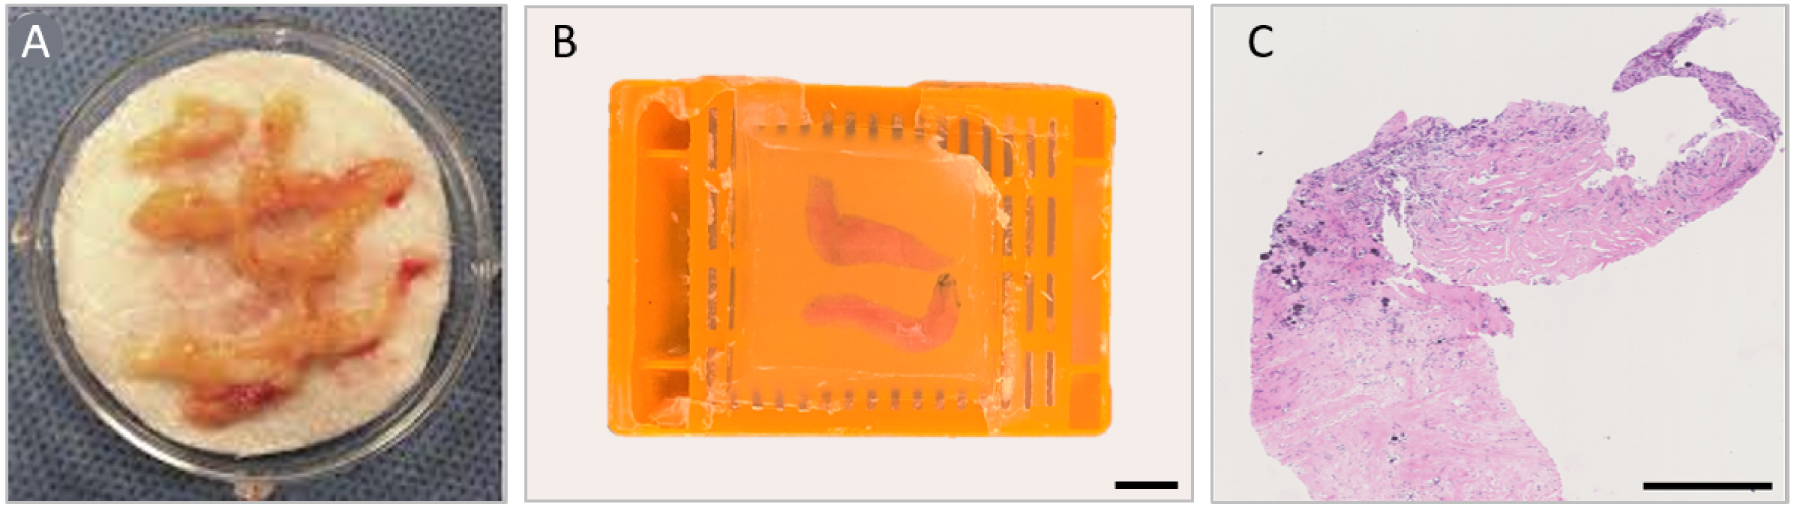
Breast tissue preparation for histopathological analyses. (A) Breast biopsy, (B) paraffin embedded breast tissue, 5 mm scale bar, and (C) H&E stained breast biopsy, ×10 optical image, 500 μm scale bar.
If BMCs are observed on the histopathological slide, it confirms that the biopsy was harvested within the region with suspect lesions and gives indications where cancerous cells may be present; but BMCs are not further investigated clinically. Yet studies investigating the correlation between BMCs [33, 34, 35] and cancer suggest that BMCs physicochemical properties can be correlated to the pathology and its severity. The following section focuses on analytical strategy for physical and chemical characterization of BMCs, that could provide a better understanding of the possible relationship between BMCs physicochemical properties and the pathology.
Figure 5 displays a mammogram of a 75-years old woman right breast with lesions suspicious of malignancy. A biopsy was performed on the breast lesions, and histopathological analyses (Figure 5B, C), conclude to an infiltrating low-grade ductal carcinoma diagnosis. This patient (75-IDC patient) presented BMCs as shown in Figure 5C, and was used to illustrate the capabilities of BMCs characterization techniques not classically used for breast cancer investigation: FE-SEM (Section 3.1) and vibrational spectromicroscopy (Section 3.2), including Fourier transform infrared spectroscopy (FT-IR), Fourier transform infrared spectromicroscopy (μFT-IR) and atomic force microscopy coupled with infrared spectroscopy (AFM-IR), and to evaluate their relevance.
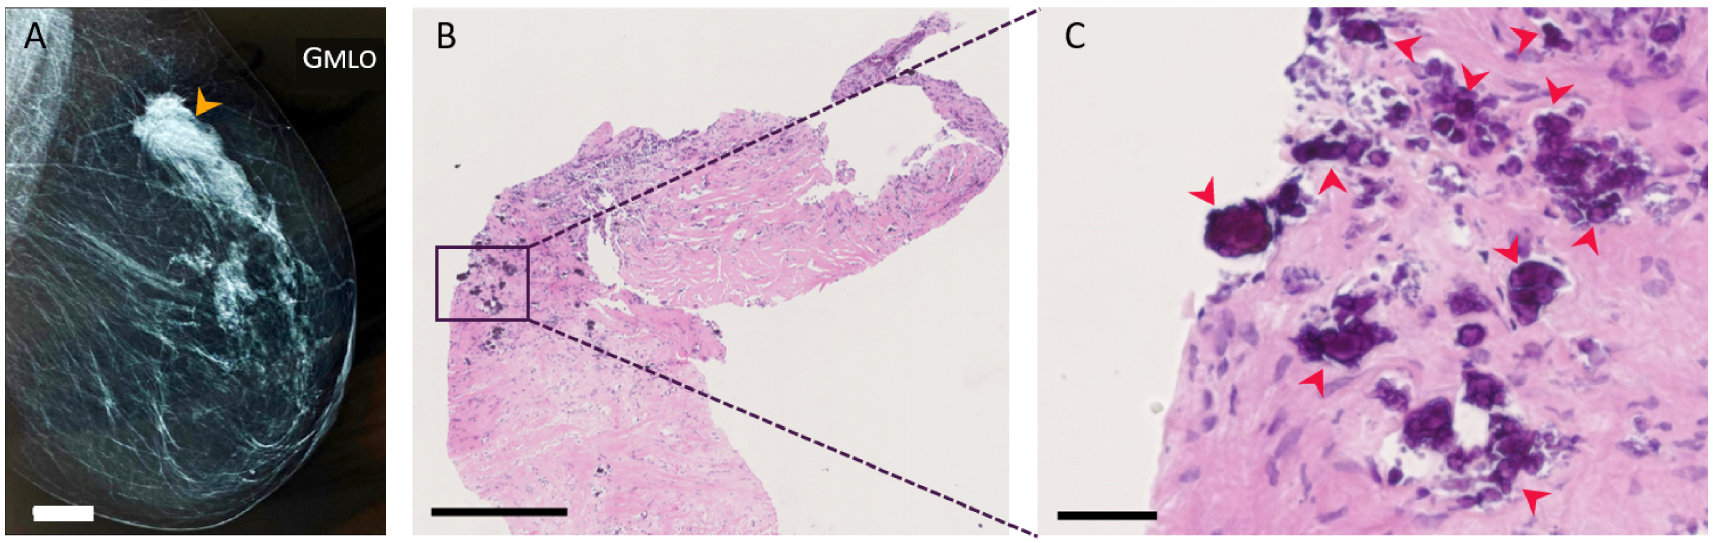
BMCs observation during the histopathological analyses of an abnormal mass in a 75 years old woman diagnosed with infiltrating low-grade ductal carcinoma (75-IDC patient) in the upper-outer quadrant of her right breast. (A) Mammogram of the patient’s right breast. The orange arrow indicates the estimated position where tissue resection was performed, 20 mm white scale bar. (B,C) Histopathological analyses of the patient’s biopsy at two different magnifications. H&E slide with 500 μm and 50 μm black scale bar respectively. Red arrows indicate the presence of BMCs. Masquer
BMCs observation during the histopathological analyses of an abnormal mass in a 75 years old woman diagnosed with infiltrating low-grade ductal carcinoma (75-IDC patient) in the upper-outer quadrant of her right breast. (A) Mammogram of the patient’s right breast. The orange ... Lire la suite
3. Characterization of BMCs to uncover the relationship between mineralization processes and breast cancer
3.1. SEM: sub-micrometer scale morphological description
Mammography and histology examinations are the agreed clinical protocol for breast cancer diagnosis, but techniques enabling morphological description and chemical speciation of BMCs at the micrometric and sub-micrometric scale are necessary to understand their role and implication with breast cancer. Investigating the correlations between BMCs morphological and chemical features with the pathology could provide valuable information to apprehend the molecular changes occurring in breast tissues.
In this context, SEM is a relevant tool to study BMCs morphology at the sub-micrometer scale [59, 60, 61] without any specific sample preparation except those already implemented in most anatomopathological laboratories and used for medical diagnosis [62, 63].
From tissue resection embedded in paraffin, FE-SEM analysis can be performed by depositing a few micrometer thick slice of tissue on a classical glass microscope slide or on specific Infrared-Raman compatible substrate (such as low-e microscope slides [64, 65, 66]) in case of correlative measurements using vibrational microspectroscopies. Then, paraffin is removed with xylene without any further treatment. Since tissue block radiography is a valuable adjunctive method to ensure that SEM analyzed samples contain BMCs and are interpreted within their histopathological context, an H&E serial section is prepared. Usually, for samples with low conductivity properties, such as biological samples, SEM analyses are performed on carbon-coated samples. However, using FE-SEM that enables less electrostatic distortion of images compared to SEM, and if low tension is used during the experiment (between 0.5 and 3 keV), analyses can be performed directly on the sample without carbon coating [67] allowing complementary spectroscopical analysis on the same sample. Resulting FE-SEM images provide structural descriptions of both BMC and their surrounding native environment (Figure 6).
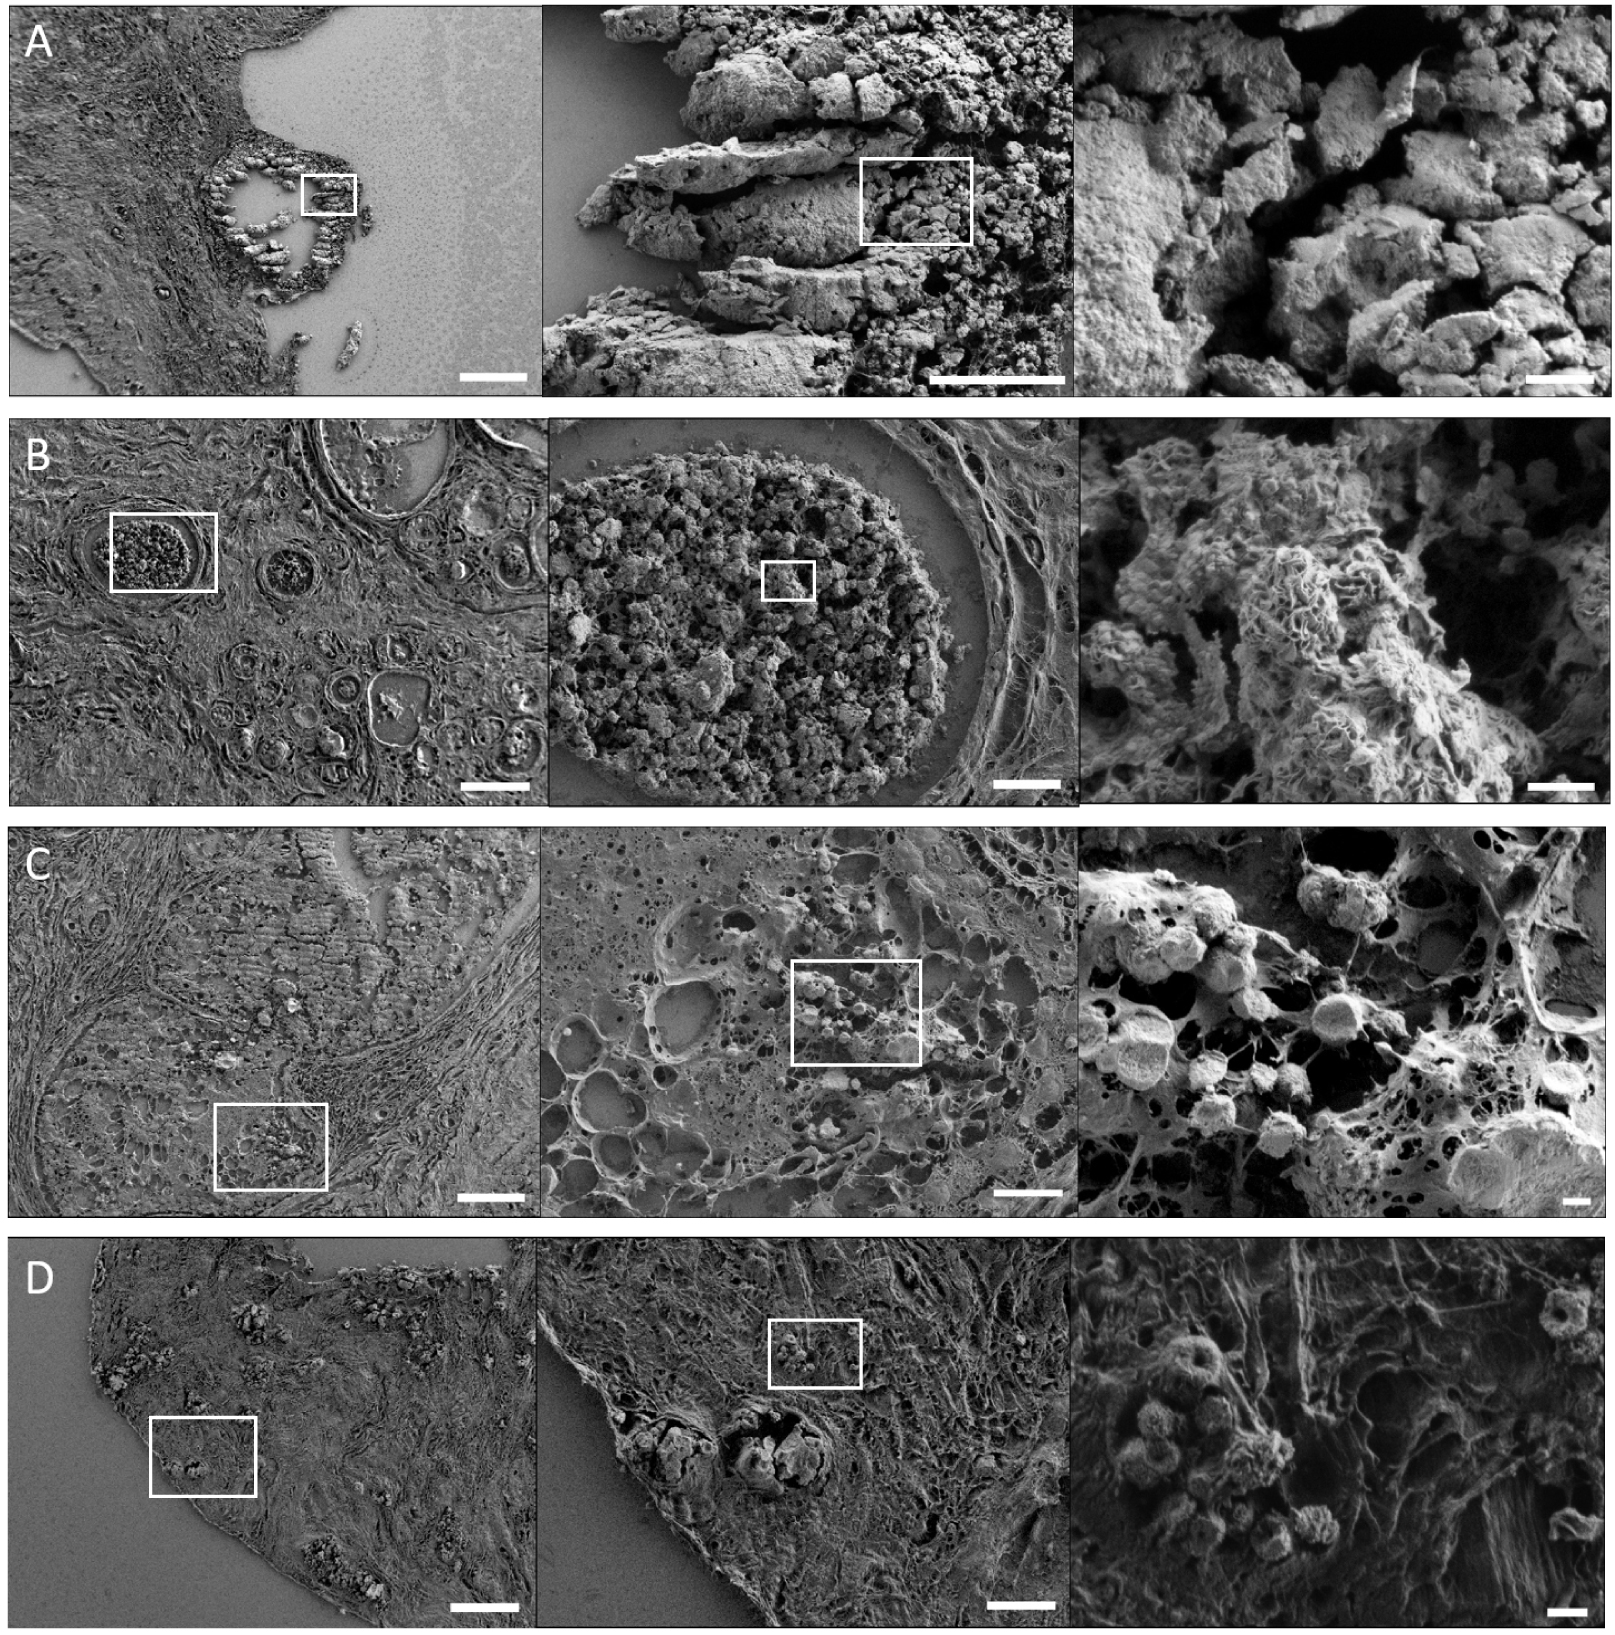
FE-SEM images of breast microcalcifications. BMCs in the breast of patients diagnosed with (A) infiltrating ductal carcinoma, (B) mastopathy, (C) in-situ ductal carcinoma, and (D) infiltrating ductal carcinoma. (A–D) From left to right, increasing magnification of the area indicated with a white square. The left, middle and right images have a 100 μm, 20 μm and 2 μm scale bar respectively. Breast biopsy slices were deposited on MirrIR low-e microscope slides (MirrIR, Kevley Technologies, Tienta Sciences, Indianapolis), and FE-SEM (field emission scanning electron microscopy) images were acquired using a Zeiss SUPRA 55-VP at low-voltage (1–2 kV), and an Everhart–Thornley SE detector. Masquer
FE-SEM images of breast microcalcifications. BMCs in the breast of patients diagnosed with (A) infiltrating ductal carcinoma, (B) mastopathy, (C) in-situ ductal carcinoma, and (D) infiltrating ductal carcinoma. (A–D) From left to right, increasing magnification of the area indicated with a white square. The left, ... Lire la suite
In tissue biopsy, BMCs can have diversified shapes and forms (Figure 6). In breast tissue sections, four chemical phases were observed: COD (BMCs of type I), CA (BMCs of type II), and more recently BMCs containing Wk and ACCP were reported [32, 69, 70]. Noteworthy, ACCP is an amorphous mineral without characteristic morphology, in contrast with COD, CA and Wk that can have highly specific shapes.
First, COD (CaC2O4⋅2,2H2O) BMCs: they have been identified in pathologies affecting various organs like the thyroid [71, 72], kidney [73, 74, 75], and prostate [76, 77]. Nevertheless, in the breast, the type of BMC is always associated with benign lesions. They can be easily identified by FE-SEM due to their characteristic bipyramidal or dodecahedral shapes (Figure 7A–C) that depends on the calcification calcium rate [75].
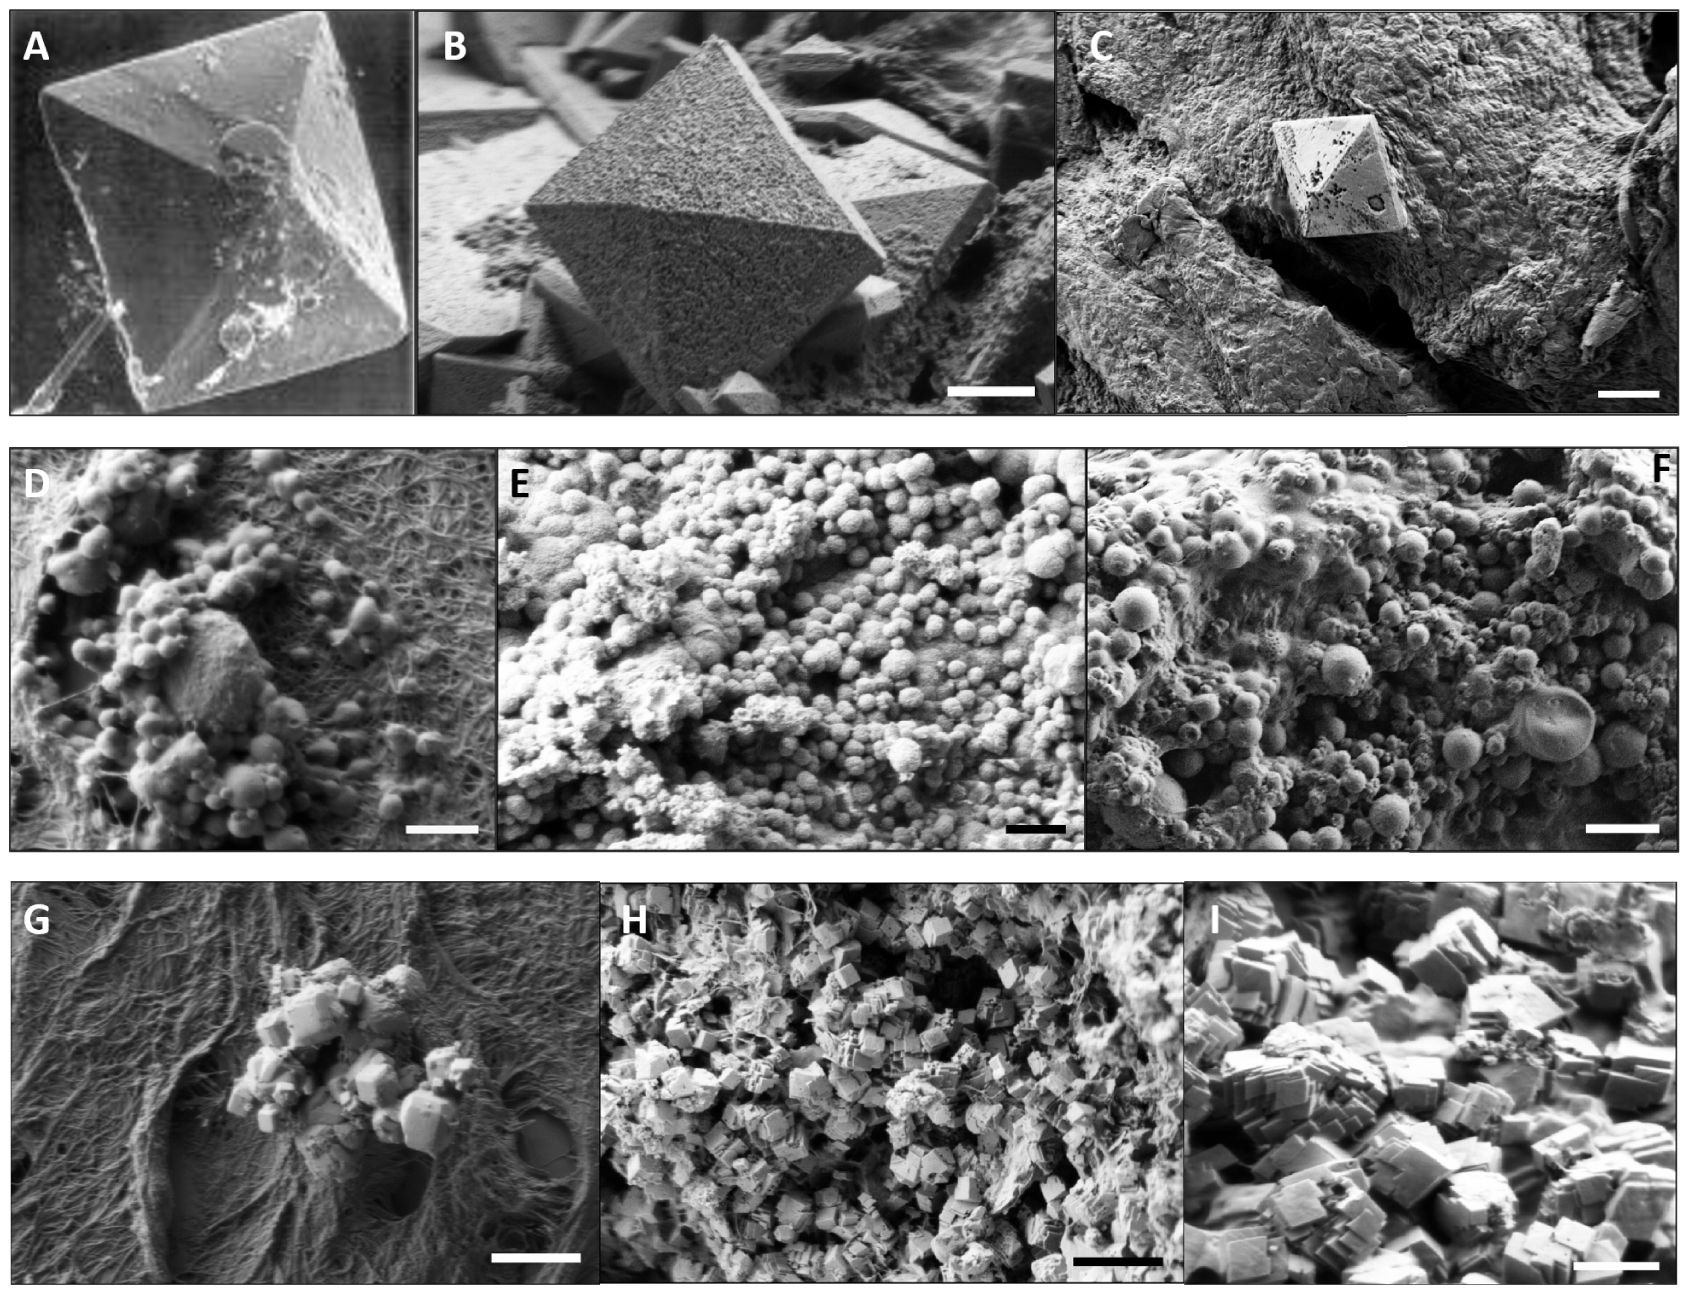
SEM images of BMCs composed of COD (A–C), CA (D–F), and Wk (G–I). (A–C) COD in (A) breast, magnification ×980, from Frappart et al. [68], (B) kidney—5 μm scale bar, and (C) thyroid—2 μm scale bar. (D–F) CA observed in (D) breast—2 μm scale bar, (E) kidney—5 μm scale bar and (F) thyroid—5 μm scale bar. (G–I) Wk in (G) breast—5 μm scale bar, (H) and (I) in kidney—5 μm and 2 μm scale bar respectively.
Secondly, CA BMCs (Ca10−x□x(PO4)6−x(CO3)x (OH)2−x, where □ corresponds to vacancy, and 0⩽x⩽2 [78, 79, 80, 69]) were observed in breast, kidney and thyroids. In the breast tissue, CA BMCs have been observed for both benign or malignant lesions. They can be recognized thanks to their spherical shapes (Figure 7D–F). Furthermore, it was highlighted that those spherical BMCs can have diversified internal structures, from radial to concentric internal organizations (Figure 8) [81]. These observations are consistent with Frappart et al. study [68], which distinguishes three subtypes of spherical calcifications using transmission electron microscopy. These three subtypes are characterized by respectively, a succession of concentric layers, randomly arranged feltings of fibers, and finally granular materials linked by organic matter. In addition, CA BMCs can present as porous surfaces [81].
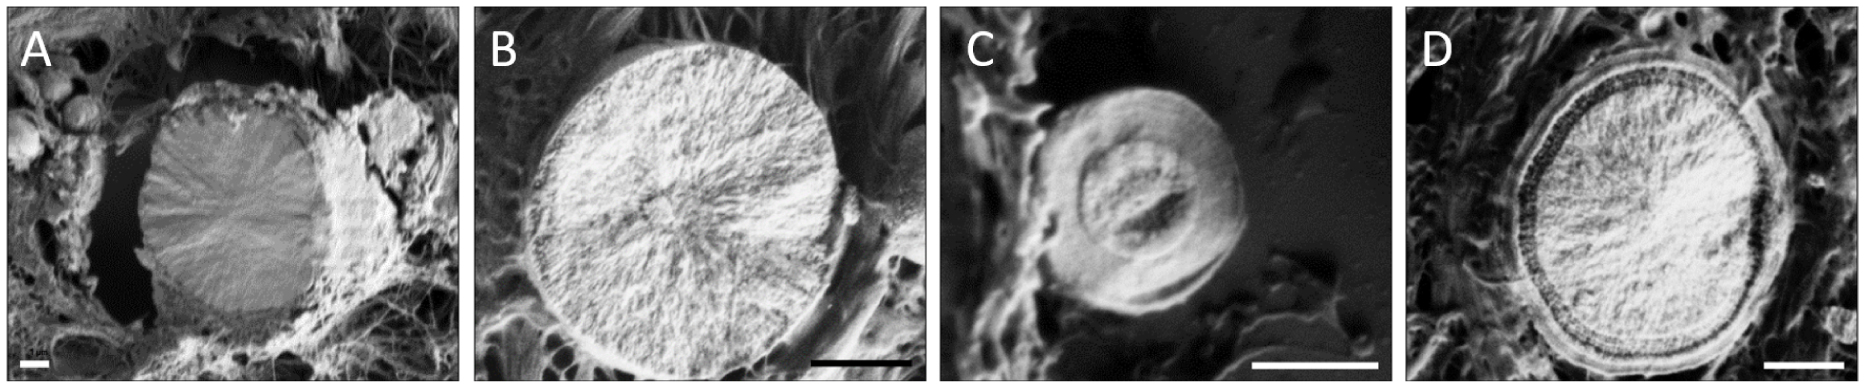
FE-SEM images of the internal structure of spherical CA calcifications, 1 μm scale bar. (A,B) Radial structure and (C,D) concentric layer. Adapted from Bazin et al. [62].
Eventually, another mineral phase observed in breast and with specific morphology is Wk. Wk (Ca18Mg2(HPO4)2(PO4)12) is a mineral close to synthetic CA. The difference lies in the presence of
Since BMCs chemical composition can be associated with specific morphology, SEM is a valuable tool for an initial characterization of BMCs. Indeed, without further preparation than those routinely used for anatomopathological analysis, it’s easier to evaluate their size and morphology (their shapes as well as the porosity of the surface) using SEM images than mammography.
To illustrate the relevance of SEM, a thin section of the 75-IDC patient resection, whose mammography section is presented in Figure 5, was investigated. Both mammography and histological analyses highlighted the presence of microcalcifications. On the exact same region given in Figures 5B and C, we performed FE-SEM analysis (Figure 9). Many BMCs can be observed on those images at low magnification (Figure 9A). They appear as white materials on the darker breast tissue. At higher magnification (Figure 9B, C), we can notice that some BMCs display spherical structures with porous surfaces. This may indicate that, in this area, a few BMCs are like type II calcification composed of CA. CA BMCs need particular attention as they have been observed in both benign and malignant pathologies, and might suggest the presence of cancerous cells, as it was the case for this patient.

Observation of BMCs, using FE-SEM at different magnifications in the 75-IDC patient biopsy. The same region has shown in Figures 5B and C was investigated. FE-SEM images were acquired with a Zeiss SUPRA55-VP scanning electron microscope, using an Everhart–Thornley SE detector and the electron beam energy set to 1 keV. (A) 100 μm, (B) 20 μm, and (C) 2 μm scale bar. Red arrows indicate the presence of BMCs.
Even if SEM does not allow direct chemical speciation of a BMC, it can provide information regarding their elemental constitution through energy dispersive X-ray (EDX) analysis. EDX measurements consist of the analysis of photons emitted by materials when exposed to a primary electron beam. Indeed, the energy of the emitted photons will depend on the elements present in the sample. Hence, by looking at the energy of those photons one can evaluate which elements constitute the sample. This technique is widely used for the elemental analysis of biological calcifications [89, 90, 91]. EDX analysis was also performed on the 75-IDC patient section (Figure 10), in the same region of interest (see Figure 9). Calcium, phosphorus, and oxygen were observed in major amounts, which is consistent with CA-based BMCs.
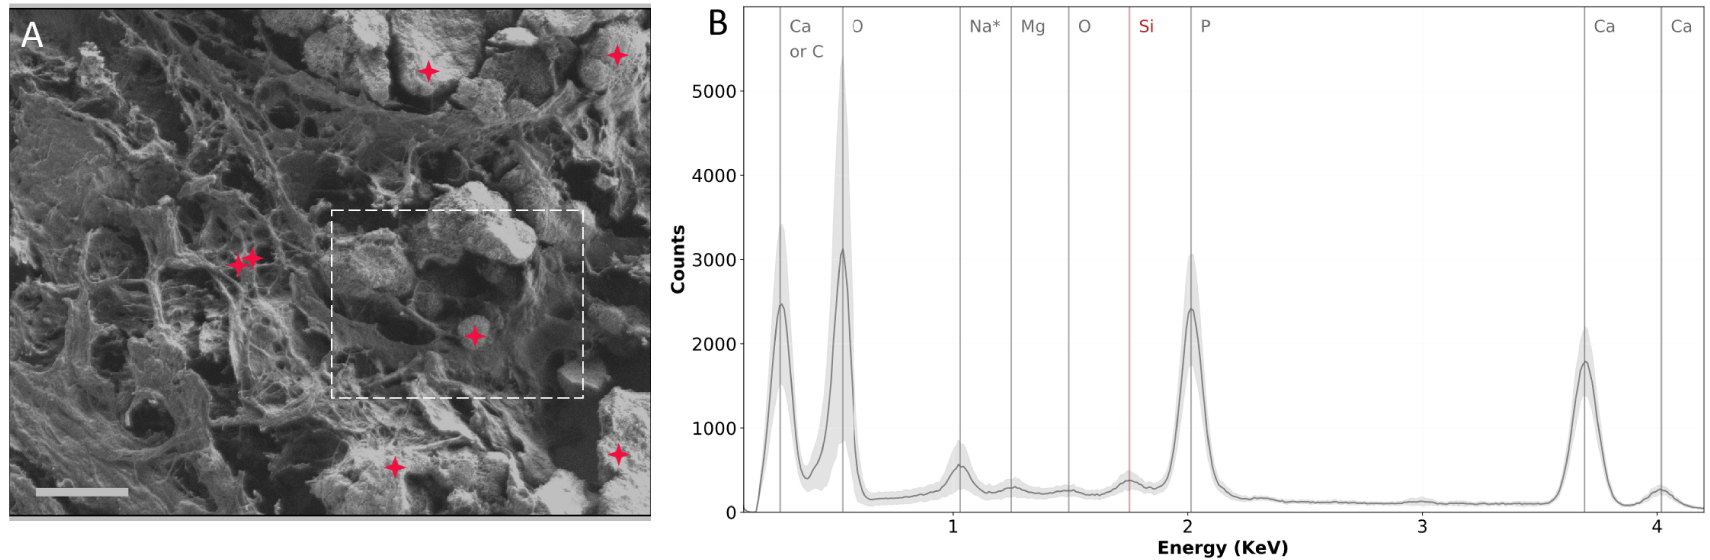
SEM and EDX experiments performed on the biopsy of the 75-IDC patient. (A) SEM image of the region analyzed. Red crosses indicate locations at which EDX spectra were recorded. The dashed white line delimits the region shown in Figure 9C. (B) EDX spectra. The gray curve represents the mean spectrum of all 7 spectra recorded in the region analyzed. The light gray contour indicates the standard deviation. Silicon observed on the EDX spectra (red vertical line) comes from the substrate (Low-e microscope slide). * The attribution of the 1 keV peak should be carefully done: it could be due to Na or O as its concentration is high in tissue sections. Masquer
SEM and EDX experiments performed on the biopsy of the 75-IDC patient. (A) SEM image of the region analyzed. Red crosses indicate locations at which EDX spectra were recorded. The dashed white line delimits the region shown in Figure 9C. (B) EDX ... Lire la suite
EDX allows access to the elemental composition of BMCs but does not provide any information about the chemical bonds. To this end, additional characterization techniques, such as IR spectroscopy, have to be used to accurately characterize BMC chemical composition. It is important to note that EDX measurements may be destructive for the proteins constitutive of the tissue since it needs to be performed at higher voltage (at least 13 kV for Ca identification), and is very likely to locally deteriorate the sample. Therefore, if other characterization techniques are required on the same region, EDX analysis has to be performed last.
3.2. Vibrational spectroscopy
3.2.1. IR spectroscopy and BMC chemical speciation
IR absorption spectroscopy (including FT-IR and μFT-IR) is an advantageous, non-destructive and label-free technique for chemical speciation. IR spectroscopy directly probes vibrational energy levels of materials, providing chemical composition of organic and inorganic matter. The IR absorption spectrum of species depends on the chemical bonds present. As a consequence, each chemical compound possesses its specific response in the mid-IR region (4000–400 cm−1). Calcification, based on its chemical composition will thus exhibit a specific and characteristic IR absorption spectrum. For unknown complex samples, the chemical composition can be deduced by comparison with reference spectra data bank. In the medical field, IR microscopy, when combined with morphological description, has already demonstrated that it is possible to obtain significant clinical information regarding microcrystalline pathologies through the analysis of concretions as well as of ectopic calcifications in different human tissues [92, 93].
Figure 11 displays IR spectra of the four calcium-based mineral phases reported in the breast, e.g., CA, COD, Wk and ACCP. All these four compounds have specific and characteristic IR signatures as shown in Figure 11B. The 1100–950 cm−1 spectral range is mainly associated with absorption bands of phosphate groups (
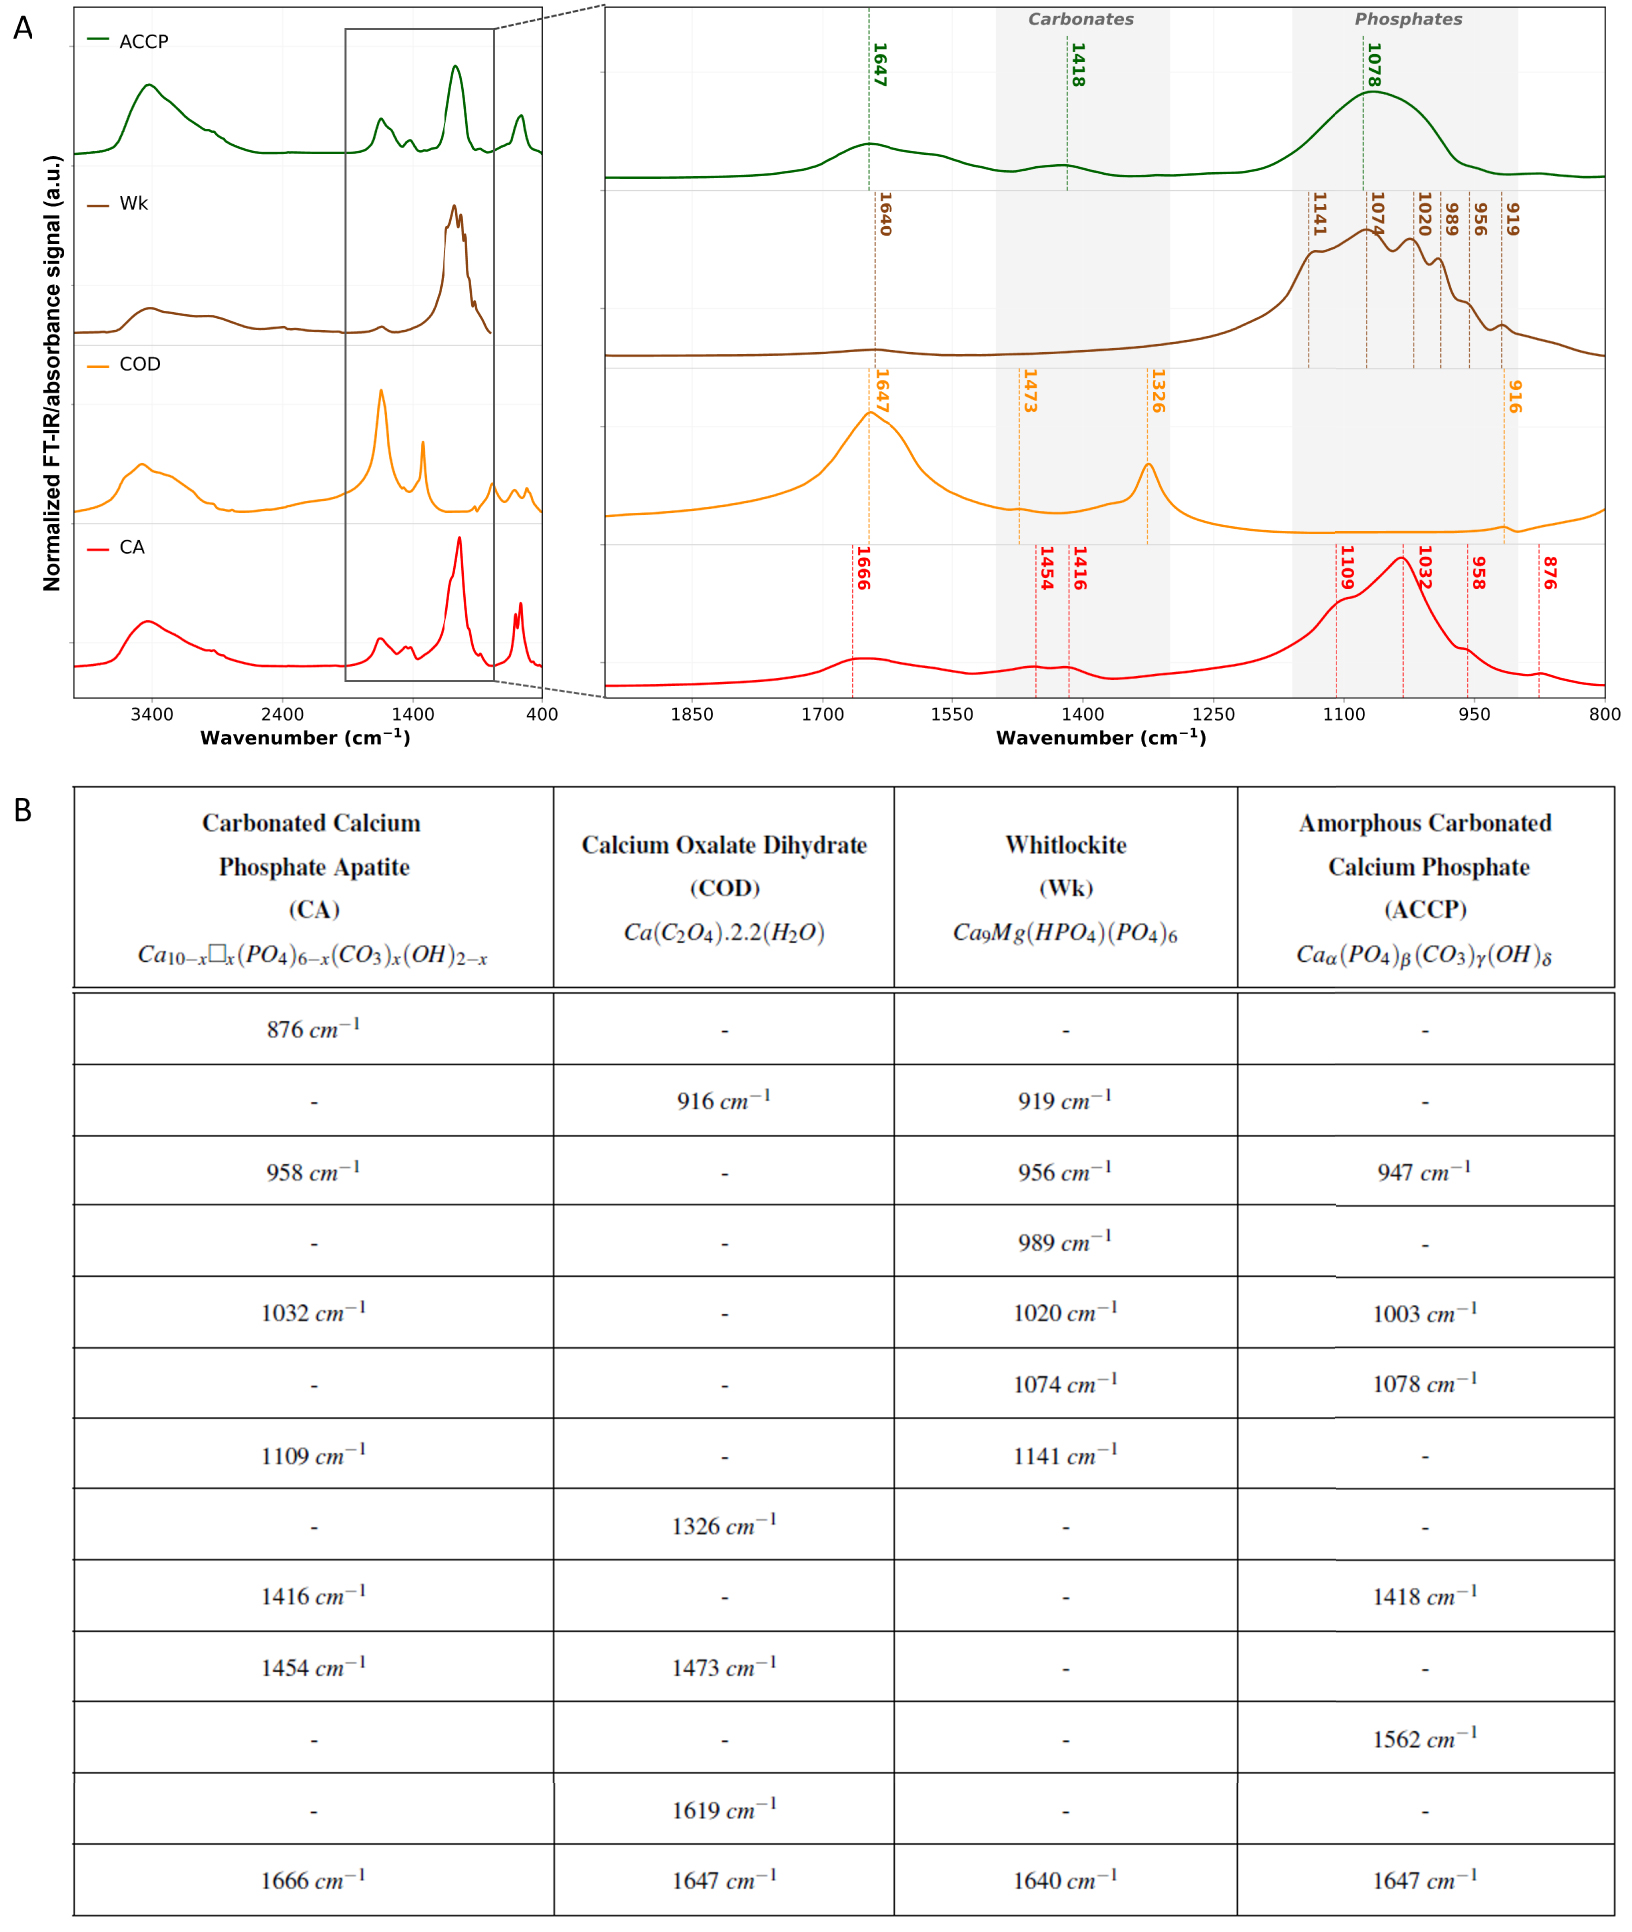
FT-IR analyses of the standard calcification chemical phases reported in the breast. (A) Normalized FT-IR spectra of carbonated calcium phosphate apatite (CA) in red, calcium oxalate dihydrate (COD) in orange, whitlockite (Wk) in brown and amorphous carbonated calcium phosphate (ACCP) in green. Main absorption bands and shoulders are outlined with dashed vertical lines with the associated wavenumber as caption. KBr pellets were prepared from chemically high purity (at least 95%) kidney stones, and spectra were acquired in transmission mode using a Vector 22 spectrometer from Bruker Spectrospin (Wissembourg, France), collected between 4000 cm−1 and 400 cm−1 with a spectral resolution of 4 cm−1. (B) Summary of CA, COD, Wk, and ACCP main absorption bands and shoulders on the 1900–800 cm−1 spectral range. Absorption bands and shoulders wavenumbers were determined using spectra second derivative. For the chemical formula of CA: 0⩽x⩽2, and □ represents vacancy. Masquer
FT-IR analyses of the standard calcification chemical phases reported in the breast. (A) Normalized FT-IR spectra of carbonated calcium phosphate apatite (CA) in red, calcium oxalate dihydrate (COD) in orange, whitlockite (Wk) in brown and amorphous carbonated calcium phosphate (ACCP) in ... Lire la suite
In addition to phosphate groups absorption bands, other absorption bands can be observed (spectra Figure 11) between 1600 and 1400 cm−1 corresponding to carbonates (
For hydrated materials, such as COD (Figure 11 orange curve), the presence on the IR spectrum of an absorption band at 1647 cm−1 can be associated to the absorption of oxalate group, as well as the deformation vibration mode of water molecules. Finally, we can notice on CA, COD, Wk and ACCP, the presence of a broad absorption band centered near 3400 cm−1. This can be associated to residual water molecules, and more specifically H–O–H stretching modes.
ACCP and Wk BMCs aren’t very well described in the breast yet. Nevertheless, they both can be identified and investigated through FT-IR spectroscopy. ACCP was recently, reported in breast calcifications [98] and is observed alongside CA, as it is considered as its precursor. This association of ACCP and CA in BMCs is revealed by the presence of a shoulder at 1032 cm−1 in the phosphate absorption band [99]. The link between the presence of ACCP in BMCs and breast cancer is yet to be discovered, but in other pathologies, its implication has been demonstrated. In kidney tissues, Carpentier et al. [100] showed that ACCP can be considered as a precursor of Randall’s Plaque: an ectopic calcification present at the tip of the kidney papilla responsible for a significant increase of the prevalence of urolithiasis in the last decades. Regarding Wk, only a few publications mentioned its presence in the breast [29, 34]. Scimeca et al. [101] may have been the first to report Wk in the breast through FT-IR spectrum and the observation of an absorption band at 990 cm−1. Besides, Scott et al. [89] discovered that the proportion of Wk seemed to increase from benign to invasive cancer. However, this correlation between Wk with cancer malignancy needs further investigation as contradictory observation have been made and no consensus has been reached yet [34, 89]. Noteworthy, like ACCP, Wk is known to be associated with pathological calcification in other organs. For example, the weight fraction of Wk, estimated by FT-IR, in kidney stones is highly related to infection if greater than 20% (80% of statistical significance) [64]. On the other hand, Tsolaki et al. [102] recently reported the presence of nano to micrometer sized spherical particles made of highly crystalline Wk in malignant breast tumors.
Nanometric Wk crystallites are challenging to detect using IR techniques, especially if they are present in low quantity. The spatial resolution of FT-IR spectromicroscopy is wavelength dependent, limited by the diffraction limit and is, at the best, around 5 to 10 μm. Although the resolution is limited, μFT-IR is a powerful tool for clinician as it can easily give insight on BMCs chemical composition without additional sample preparation. To highlight that, we performed hyperspectral analyses of a BMC-rich region of the 75-IDC patient previously introduced (Figure 12). FT-IR hyperspectral imaging [103] consists in segmenting an area into pixels and measure, for each one of them, an IR absorption spectrum on the whole spectral range. A multidimensional data block is then obtained: two dimensions for the spatial coordinates and one dimension for each wavelength of the spectral range of interest (Figure 12B). μFT-IR spectrum depends among others on the concentration of molecule that absorbs and the thickness of the sample (Beer–Lambert’s law). That is why to compare spectrum between one another, spectra must be normalized to remove any scaling effect that can be observed on chemically and structurally heterogeneous samples. Thereafter, the data can be easily interpreted by creating IR mapping (here called heatmap): representing the absorption intensity at a fixed wavenumber for each pixel, which enables to study the distribution of chemical compounds over the whole region of interest (Figure 13).

μFT-IR analysis of the 75-IDC patient. (A) FE-SEM image of the whole region analyzed, 50 μm scale bar. (B) Schematic representation of the multidimensional data block resulting from the hyperspectral analysis. The heatmap represents the total absorption intensity for each point over the 1900–900 cm−1 spectral. A baseline correction was applied to the spectra and a Savitzky–Golay filter (order 1, 13 points), without normalization, 50 μm scale bar. (D) Spectra measured at position indicated by the color-coded crosses on (A) and (C), and presenting low (orange), medium (green), and high (blue) total absorption intensity over the spectral range of interest. Spectra were recorded every 15 μm with a diaphragm of 30 μm × 30 μm and a 4 cm−1 spectral resolution, using Lumos infrared microscope from Bruker. 24 spectra were measured per point and averaged. Masquer
μFT-IR analysis of the 75-IDC patient. (A) FE-SEM image of the whole region analyzed, 50 μm scale bar. (B) Schematic representation of the multidimensional data block resulting from the hyperspectral analysis. The heatmap represents the total absorption intensity for each point over the ... Lire la suite
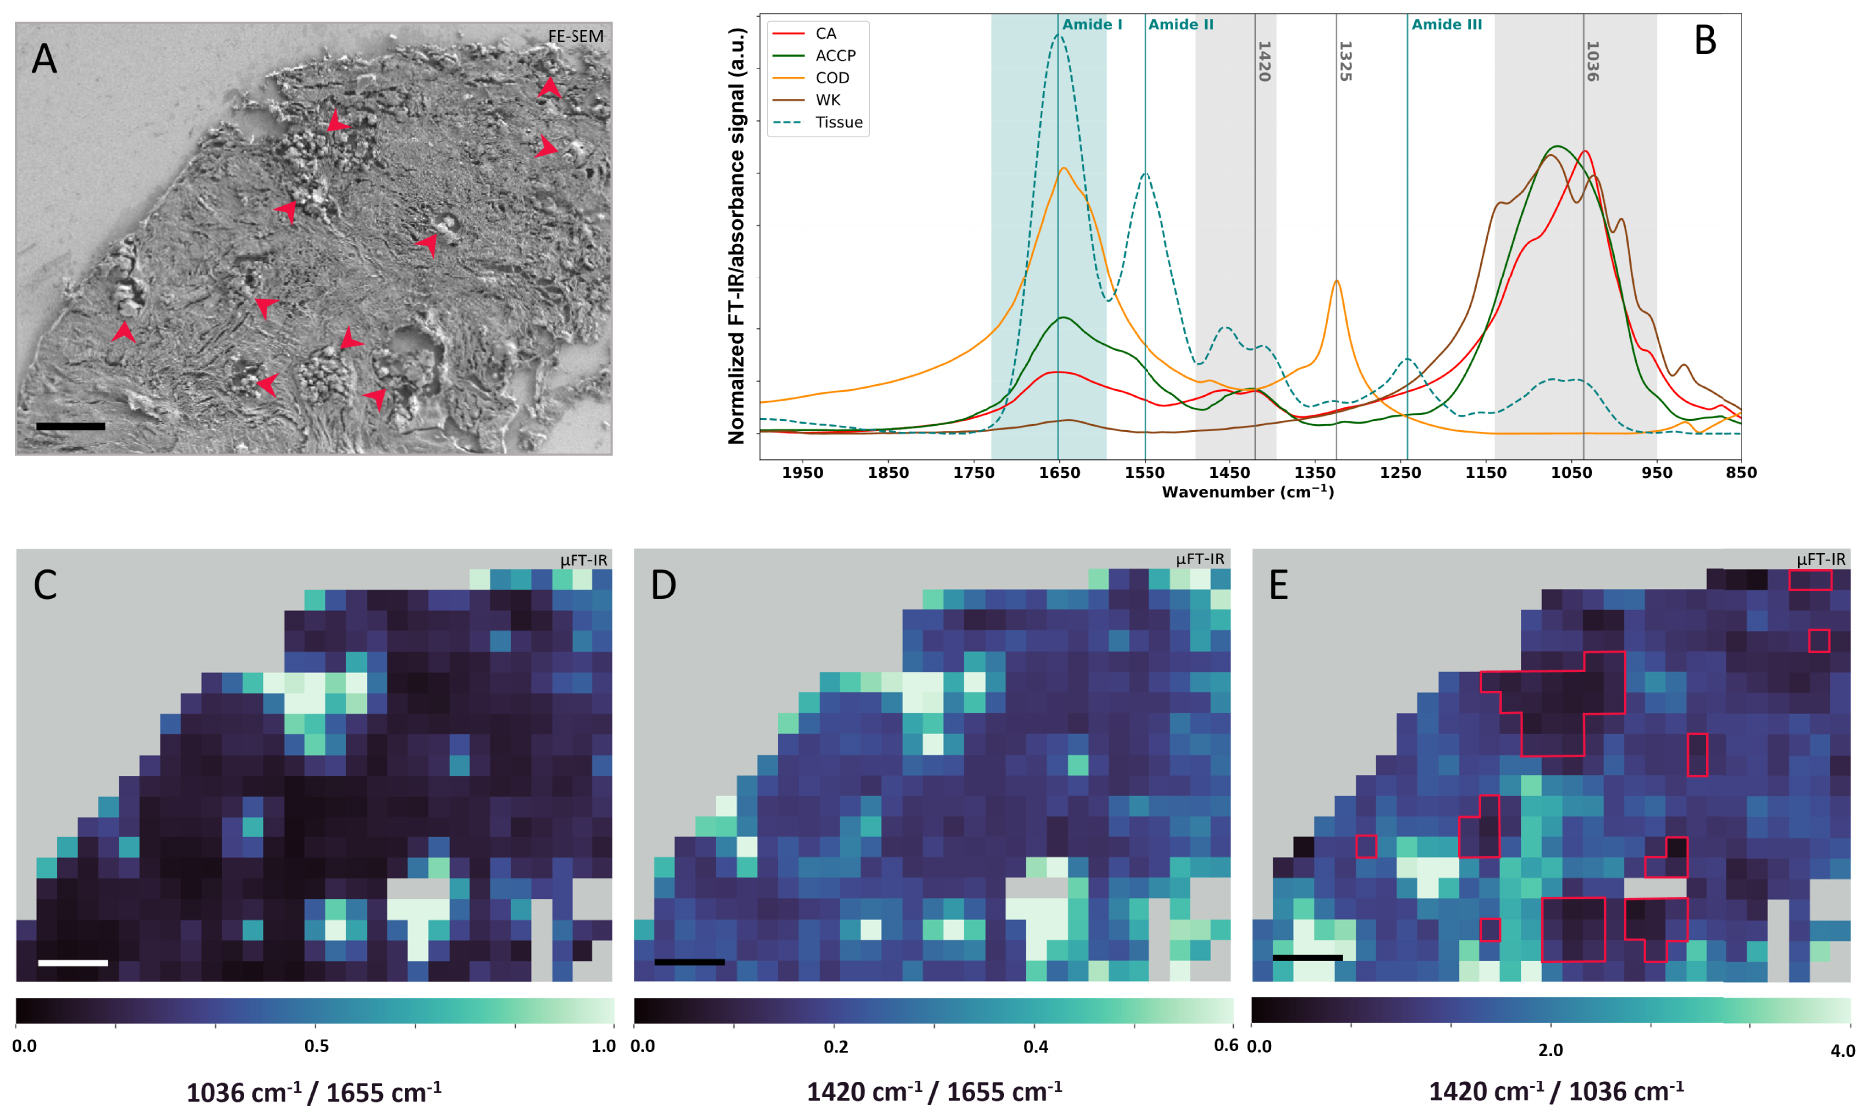
μFT-IR analyses of the 75-IDC patient biopsy. (A) FE-SEM image of the biopsy region analyzed through μFT-IR. Red arrows indicate the presence of BMCs. (B) Calcification normalized reference FT-IR spectra: CA (red), COD (orange), Wk (brown), and ACCP (dark green), as well as tissue μFT-IR reference spectrum (blue–green curve) measured on areas without BMC, based on FE-SEM images. Spectral range highlighted in light blue is the IR region associated with absorption contribution of the tissue Amide I and spectral range highlighted in light grey are regions associated with absorption contribution of BMCs carbonate and phosphate absorption bands. (C–E) μFT-IR heatmaps of absorption intensity ratio calculated using normalized spectra. (C) 1036 cm−1∕1655 cm−1 heatmap, (D) 1420 cm−1∕1655 cm−1 heatmap, and (E) 1420 cm−1∕1036 cm−1 heatmap with red solid lines indicating BMC identified through μFT-IR analyses on (C) and (D). (A, C, D, and E): 50 μm scale bar. Masquer
μFT-IR analyses of the 75-IDC patient biopsy. (A) FE-SEM image of the biopsy region analyzed through μFT-IR. Red arrows indicate the presence of BMCs. (B) Calcification normalized reference FT-IR spectra: CA (red), COD (orange), Wk (brown), and ACCP (dark green), as well ... Lire la suite
To locate BMCs within the tissue matrix of the 75-IDC patient’s biopsy, two heatmaps were generated using normalized spectra by dividing the absorbance at 1036 cm−1 by the absorbance at 1655 cm−1 (Figure 13C), and the absorbance at 1420 cm−1 by the absorbance at 1655 cm−1 (Figure 13D). 1036 cm−1 and 1420 cm−1 being respectively associated to the absorption of phosphates and carbonates in BMCs and 1655 cm−1 corresponding to the Amide I band (the stretching mode of amide C=O bonds) [104, 105] characteristic of the total protein content of the tissue. These ratios provide information about regions rich in BMCs (higher ratio value in light green on the maps in Figure 13) compared to region mainly composed of tissue (lower ratio value in dark blue on the maps). Pixels with high ratio in Figures 13C and D, correlate with the presence of BMCs on the associated FE-SEM image of the region (Figure 13A, red arrows). Finally, a third heatmap was generating by dividing the absorption intensity at 1420 cm−1 by the absorption at 1036 cm−1 (Figure 13E), to evaluate if all BMCs are chemically homogenous in terms of carbonate contents. On this representation, location at which BMCs were detected on FE-SEM and other IR heatmaps (Figure 13C, D) are associated with low and medium 1420 cm−1∕1036 cm−1 ratio value, suggesting different levels of carbonate substitution in BMCs. Besides, strong signal was also observed at location without BMC, at least as far as we can observe on the FE-SEM images. Indeed, other molecular species in the breast tissue absorb in the 1450–1400 cm−1 region, as well as in the 1200–1000 cm−1 region, including carbohydrates, glycoproteins, residues of paraffin, lipids, sugar, or DNA, as can be seen on the IR absorption spectrum of pure tissue (Figure 13B, blue dashed line). Hence, the overlapping absorption bands may lead to misinterpretation of the data.
μFT-IR can enable localizing BMCs in a sample (Figure 13) but is first and foremost a technique of choice to elucidate their chemical speciation (Figure 14). Figure 14C displays local spectra measured at location showing strong calcification signal (Figure 14, grey square) on the heatmap of the 1036 cm−1∕1655 cm−1 ratio (Figures 13C and 14A). These spectra present intense absorption bands at 1650 cm−1, 1550 cm−1 and a weaker band at 1260 cm−1, corresponding respectively to the Amide I, II and III vibration band of proteins, e.g., the tissue [106, 97]. Besides, these spectra present a broad absorption band between 1100 cm−1 and 1030 cm−1, suggesting the presence of BMCs made of CA and a small proportion of ACCP as highlighted by the shoulder of the band. The shape of the phosphate bands varies from a spectrum to another (Figure 14C). To further investigate the structure of this absorption band, the second derivative of the experimental spectra, as well as CA and ACCP reference spectra were calculated. A shoulder at 1114 cm−1 is present for all four spectra acquired on BMC rich area of the 75-IDC patient biopsy and also observed in ACCP second derivative. On the other hand, we can notice a shift of the maximum of the phosphate absorption band between 1032 cm−1 and 1003 cm−1. A similar observation can be made for the shoulder near 950 cm−1. These results might suggest that BMCs in this sample might be composed of mixture of CA and ACCP, with chemical heterogeneities between and/or within BMCs.
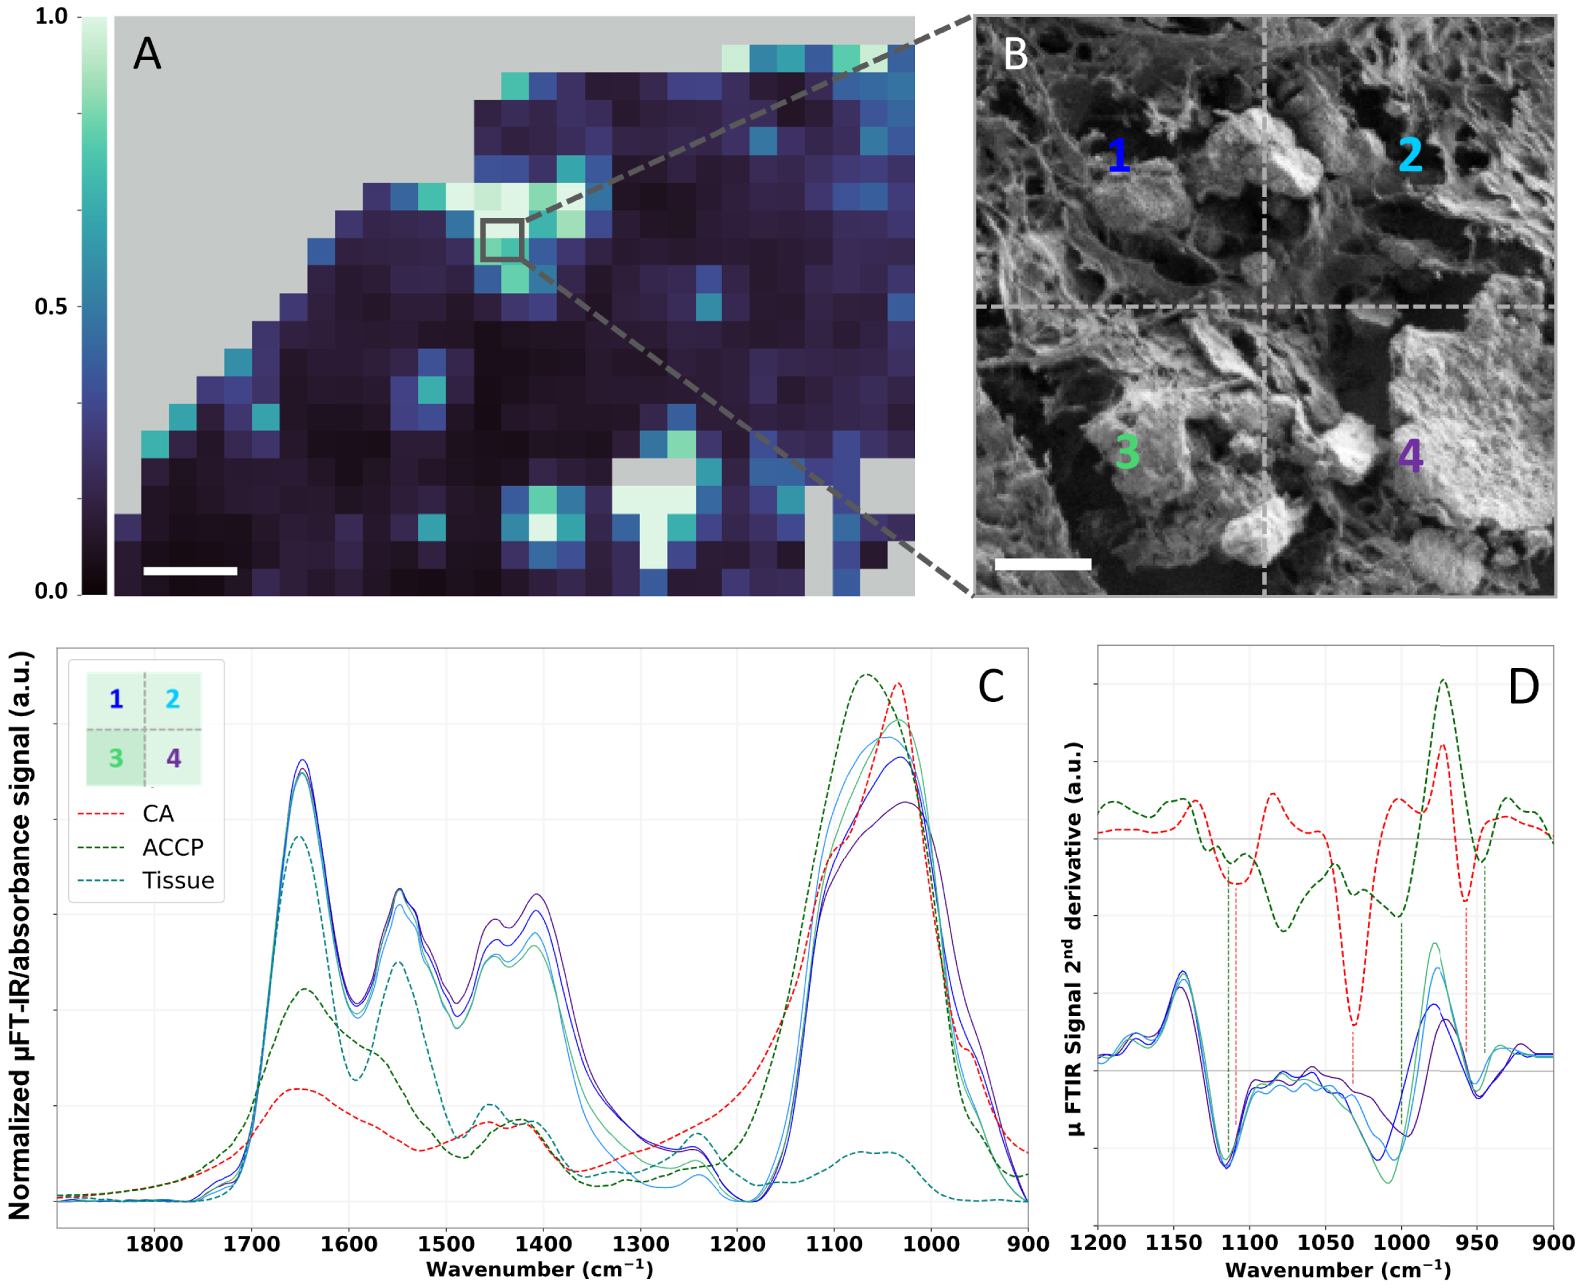
μFT-IR analyses of BMC in the 75-IDC patient. (A) Heatmap of the absorption intensity ratio: 1036 cm−1∕1655 cm−1 (as shown Figure 13C), 50 μm scale bar. (B) FE-SEM image of a small region of the biopsy presenting multiple BMCs with different sizes and shapes, 5 μm scale bar. (C) Associated normalized μFT-IR spectra recorded in this area and FT-IR reference spectra of CA (red curve) and ACCP (dark green curve). Positions, at which spectra were recorded, are indicated by the color-coded numeration (B and C). (D) Second derivatives spectra of reference CA and ACCP over the 1200–900 cm−1 spectral range. Second derivatives were calculated using Savitzky–Golay algorithm (order 2, 11 points). For better visualization, an offset was applied to CA and ACCP second derivatives spectra. Masquer
μFT-IR analyses of BMC in the 75-IDC patient. (A) Heatmap of the absorption intensity ratio: 1036 cm−1∕1655 cm−1 (as shown Figure 13C), 50 μm scale bar. (B) FE-SEM image of a small region of the biopsy presenting multiple BMCs with different sizes and shapes, 5 μm ... Lire la suite
In the literature, a few hypotheses have been raised regarding the correlation between BMCs chemical composition, the pathology and its degree of malignancy. These hypotheses rely on vibrational spectroscopic studies, either FT-IR or Raman spectroscopy. For example, through Raman spectroscopy, Haka et al. [105] found that the proportion of carbonates in BMCs was greater in benign breast tissue compared to malignant breast tumors. Likewise, Baker et al. [33], investigated the relationship between the carbonate content of BMCs in regards to the pathology through FT-IR analyses. They collected FT-IR spectra of synthetic apatite containing 0, 0.5, 1.4, 2.3, and 3.5% of carbonates (Figure 15A), creating a calibration data base to establish a link between BMCs carbonate content and the grade of the pathology (Figure 15B). Similarly, to Haka et al. [105], they observe a decreasing carbonate percentage with increasing grade of the breast lesion. Based on equivalent data, Gosling et al. [35] have proposed a model that rationalizes mineralization in the breast and the proportion of carbonate in BMCs with the severity of the pathology (Figure 15C).
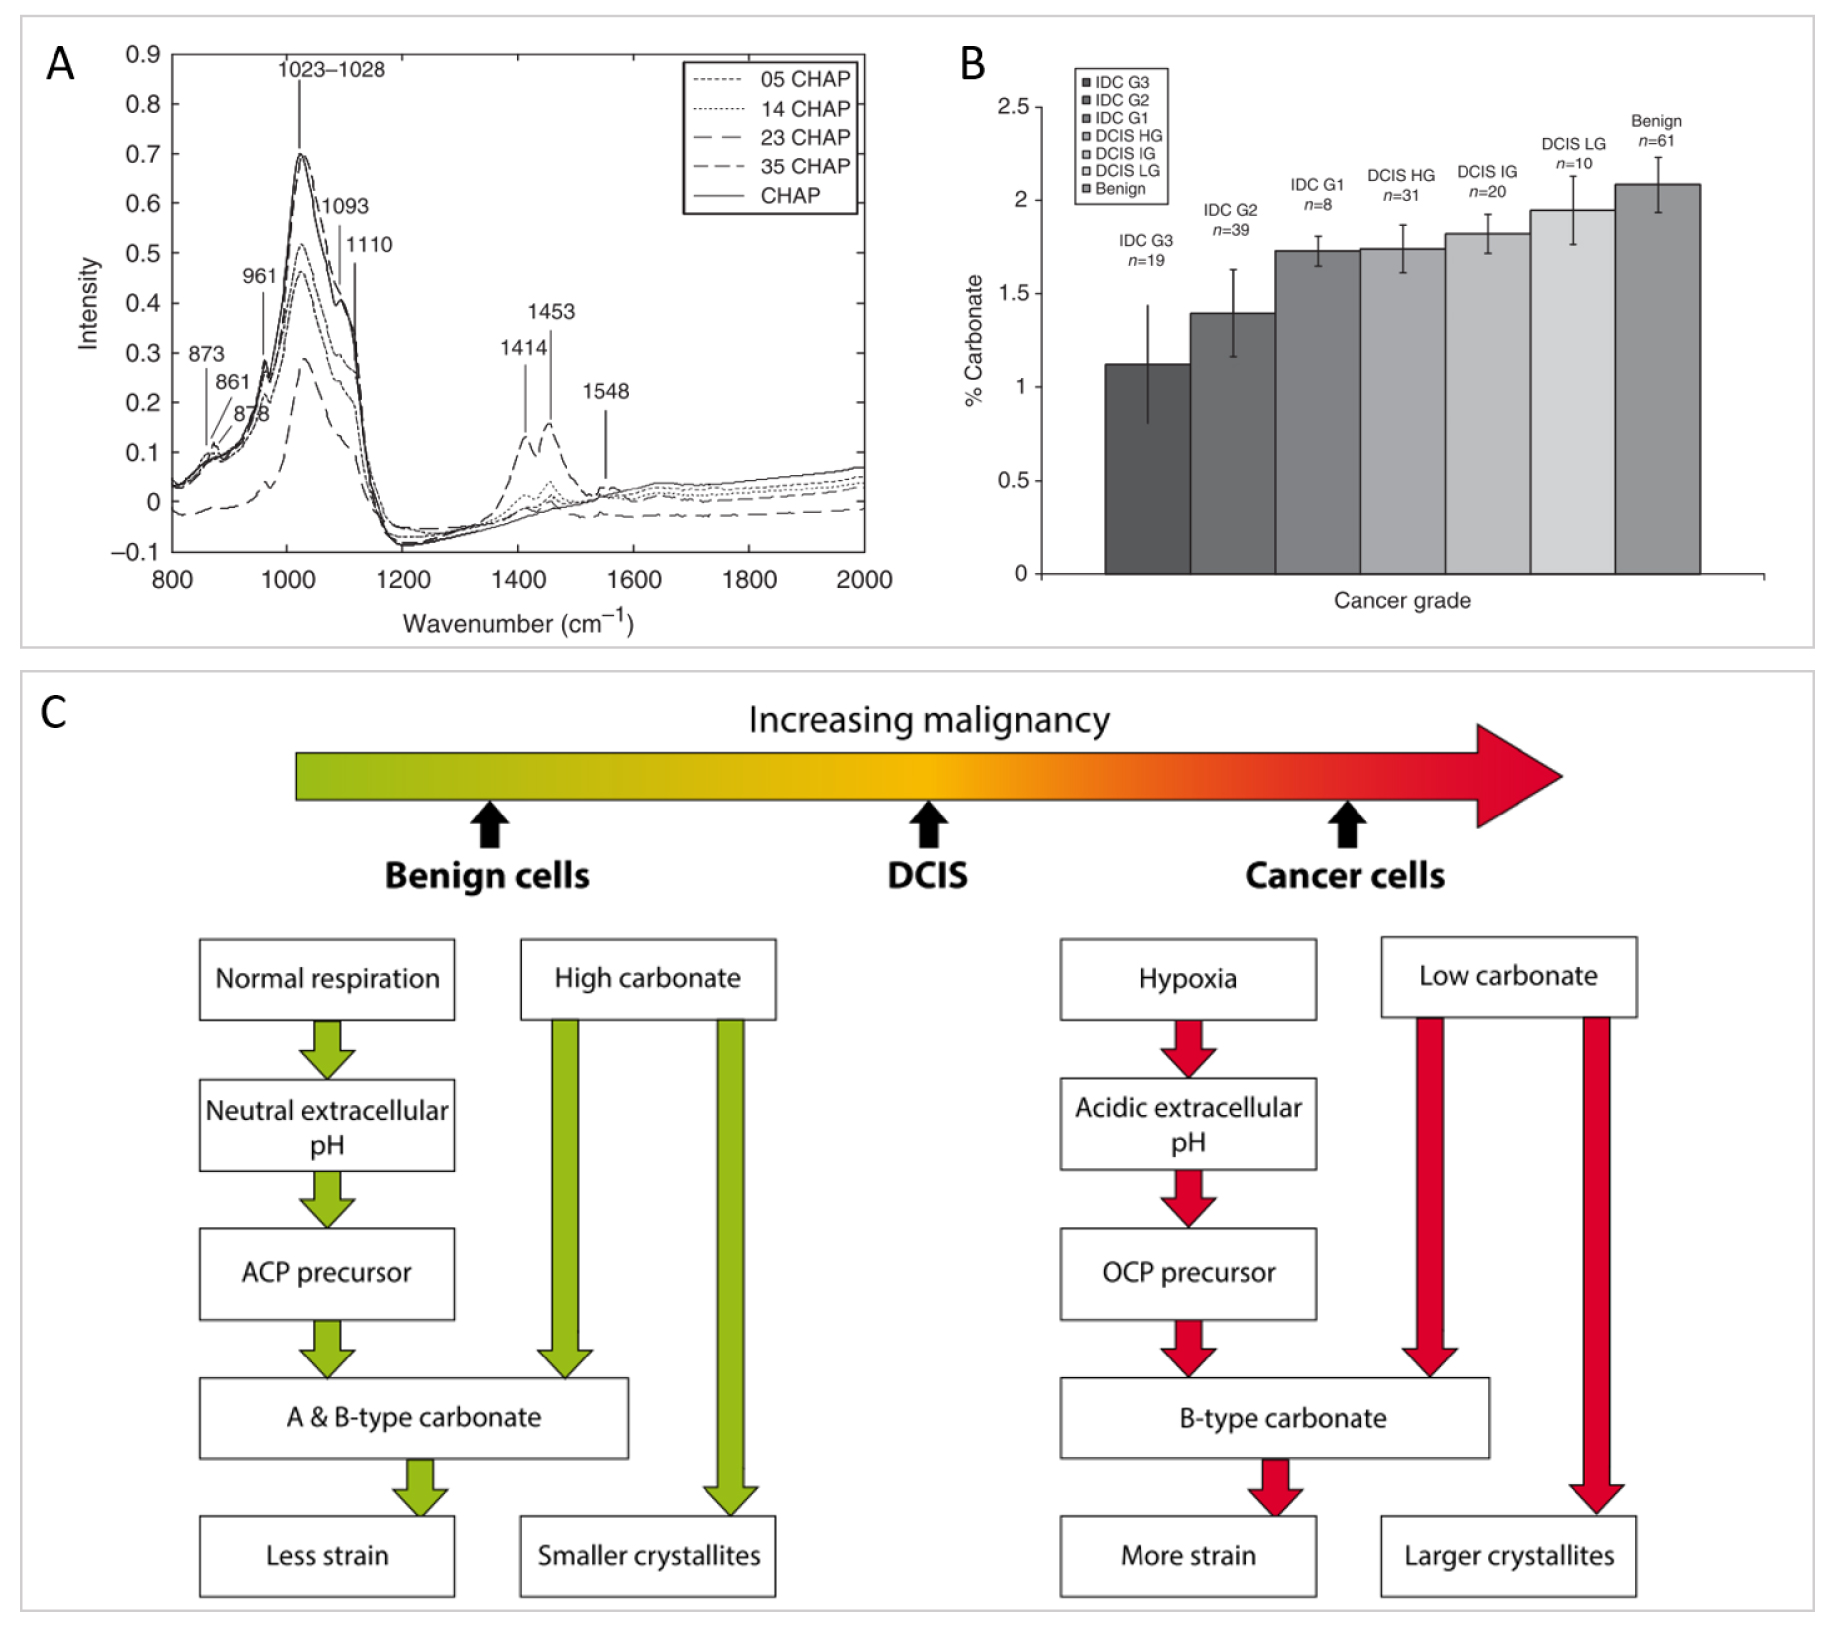
Investigation of the carbonated content of BMCs with breast pathology severity. (A) IR spectra of synthetic calcium phosphate hydroxyapatite (CHAP) with different proportion of carbonate substitution (0%, 0.5%, 1.4%, 2.3%, and 3.5%) use as calibration curves to quantify carbonate content in biological BMCs. (B) Mean carbonate content in calcifications from all invasive, in-situ, and benign breast tissue, quantified using (A). (A, B) from Baker et al. [33]. (C) Summary of the microenvironmental factors affecting the carbonate substitution in calcium phosphate hydroxyapatite in BMCs associated with benign, ductal carcinoma in-situ and invasive breast tissue cells. From Gosling et al. [35]. Masquer
Investigation of the carbonated content of BMCs with breast pathology severity. (A) IR spectra of synthetic calcium phosphate hydroxyapatite (CHAP) with different proportion of carbonate substitution (0%, 0.5%, 1.4%, 2.3%, and 3.5%) use as calibration curves to quantify carbonate content in ... Lire la suite
Besides, Ben Lakhdar et al. [69] have shown that the carbonate percentage is inhomogeneous within BMC themselves. This work, investigating BMCs through μFT-IR spectroscopy emphasized that, in the case of ductal carcinoma in situ, the carbonates content is greater in the core of the BMC compared to its surface, as the
Those different studies illustrate the complex organization of BMCs and raise the following question: is global analysis sufficient to characterize BMCs and reach a final diagnosis that links their chemical composition to malignancy level? Or, is the submicrometric scale exploration crucial to precise eventual local gradient for the diagnosis?
Unfortunately, μFT-IR system has a wavenumber-dependent spatial resolution that varies roughly from a few microns to dozens of microns [106], and close to a micron for Raman microscope, which could be a limitation to individually characterize sub-micrometric objects. Figure 14 presents IR spectrum of a few BMCs identified in the 75-IDC patient. On the FE-SEM image of this region (Figure 14B), several BMCs can be observed: BMCs of different shapes and sizes, including BMCs of a few hundred nanometers only. Due to the spatial resolution of classical IR characterization system, the resulting signal is a superposition of both contribution of BMCs and the surrounding tissue. Hence, weak signal, originating from nanometric BMCs or BMCs with chemical properties in very little proportion may be missed. Therefore, due to the complexity of BMCs organization within the tissue μFT-IR fails to characterize BMCs individually, and nanometric calcifications can’t be properly described by classical vibrational techniques. This might be overcome by the use of super-resolved IR techniques, also called IR nanospectroscopy techniques.
3.2.2. IR nanospectroscopy to characterize BMCs at the nanoscale
AFM-IR is an AFM based technique that provides IR analysis at nanometer scale. It combines the high spatial resolution of the AFM and the chemical identification capability of the IR spectroscopy [107]. This system assesses topographic images as well as chemical speciation through its nanometric tip apex. To that end, the sample surface is highlighted with a tunable IR laser which will produce—if the sample absorbs at the laser’s wavenumber—rapid picometer expansion [108] of the surface due to conversion of the absorbed light into heat (photothermal process [109]). This expansion is probed by the AFM tip in contact (contact mode) or intermittent-contact (tapping mode) with the surface: the energy collected is transferred to the cantilever that will oscillate on its eigenmode. The oscillation amplitude is directly proportional to the absorption of the sample, which enables direct comparison with conventional absorption IR spectra. Unlike μFT-IR, AFM-IR technique does not acquire systematically a spectral data cube, but can record local IR spectra by fixing the tip position and scanning the laser spectral range, or IR chemical maps by fixing the wavenumber of the laser and scanning the surface. The resulting chemical information has a lateral spatial resolution close to 20 nm, limited by the AFM tip radius [110, 111, 112]. AFM-IR is, therefore, a promising technique to precise BMCs topography and their composition at the nanoscale. However, since the IR source is a laser, AFM-IR spectral range (1900–900 cm−1) is usually less extended than μFT-IRsystems that possess globar sources with working range from 4000 cm−1 to 400 cm−1.
Figure 16 compares AFM-IR analyses performed on the 75-IDC patient breast biopsy with reference FT-IR spectra. A calcification structure surrounded by tissue can be identified in the upper left corner of both the FE-SEM image and the AFM topography of the studied region (Figure 16B, C). The AFM topography represents the morphology of the surface in false color. The color scale outlines the height of the surface: zero being the deepest point probed on the surface and the light-yellow the highest point of the surface analyzed. Based on the AFM topography, this rounded-shape calcification has a diameter of about 2.5 μm, lower than the spatial resolution of μFT-IR. Using AFM-IR four local spectra were acquired at different points on top of the BMC (spectra 1 to 4 in Figure 16D), and shape and sub-structure variations of the phosphate bands (1150 and 960 cm−1—Figure 16D) can be observed. This band was not observed in the spectrum acquired within the tissue which only presents a strong protein signal at 1655 cm−1 (Amide I), 1535 cm−1 (Amide II), and 1260 cm−1 (Amide III) (spectrum 5 in Figure 16C). Spectrum 1 acquired near the upper edge of the BMC (Figure 16C) presents maxima of absorption at 1109 cm−1, 1032 cm−1, and 958 cm−1 characteristics of CA, as well as two shoulders at 1074 and 991 cm−1 also observed on reference Wk spectrum; while spectrum 2 measured on the opposite side of the BMC presents an absorption band that might be associated to CA. On the other hand, spectrum 3 and 4 present less structured absorption bands that might be explained by the coexistence of either Wk and ACCP or CA and ACCP, respectively. These results highlight a possible chemical and/or physico-chemical heterogeneity at the nanometric scale. Thus, we suppose that BMCs might not be composed of a single chemical phase but rather a mix of different chemical phases. Due to spatial resolution limitation, these heterogeneities would not be observed with μFT-IR analyses (Figure 14C), thus AFM-IR opens new opportunities for characterizing BMC at the nanometer scale, thus enabling to investigate early-stage BMCs formation during mineralization processes in the breast.
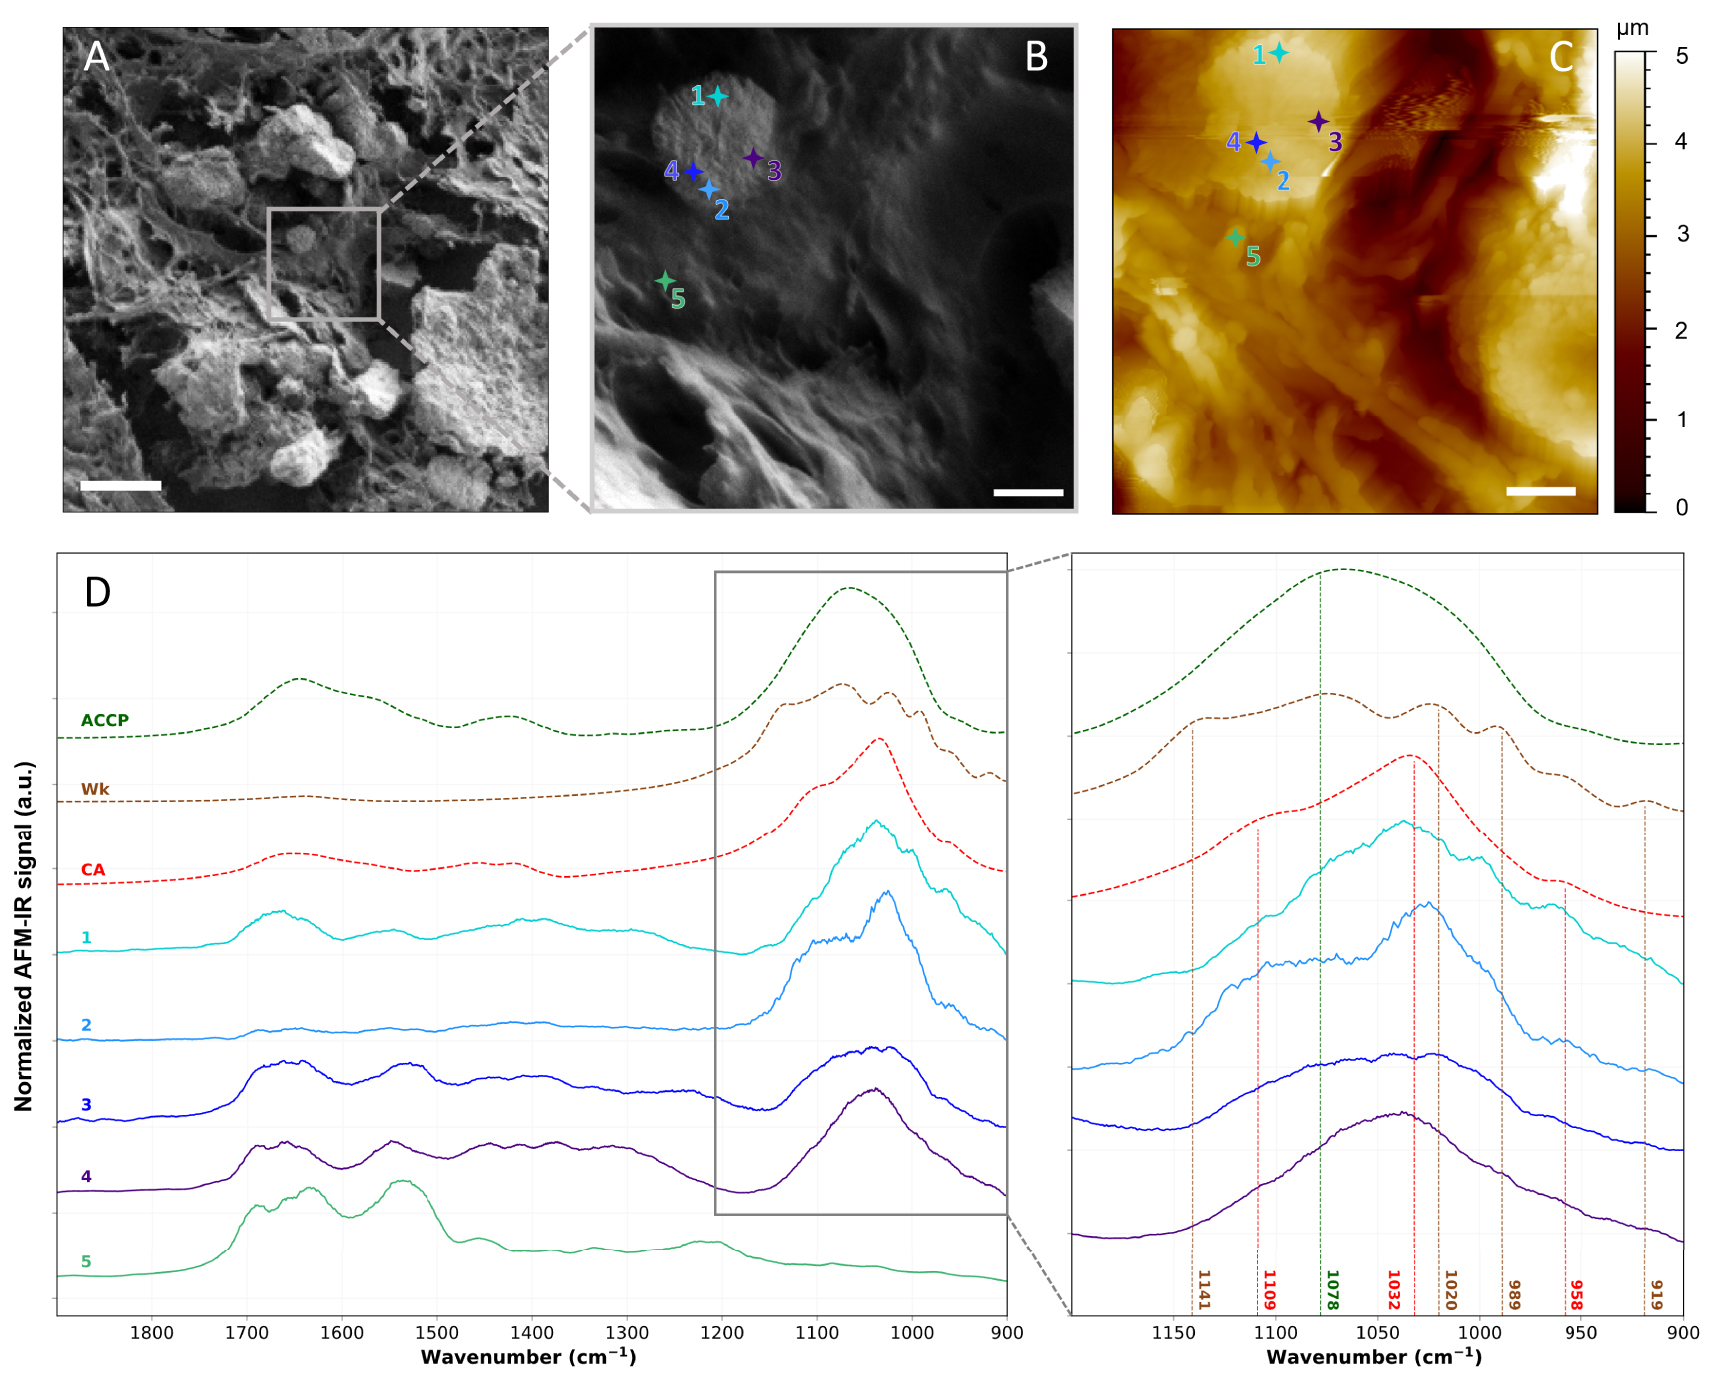
AFM-IR analyses of the 75-IDC patient. (A, B), FE-SEM images of the analyzed region. 5 μm and 1 μm scale bar respectively. (C) AFM topography of the same region shown in (B). 1 μm scale bar. (D) Local AFM-IR spectra measured at location indicated by the crosses on (B, C), and FT-IR reference spectra of CA, Wk, and ACCP (dashed lines). Baseline correction, Savitzky–Golay smoothing (order 1, 15 points) and vector normalization were applied to AFM-IR spectra presented in (D). AFM-IR measurements were performed using NanoIR2 from Bruker Nano coupled with a QCL laser covering the 1900–900 cm−1 spectral range. Imaging was performed in tapping mode and spectra were recorded in contact mode using gold coated cantilever (Budget Sensors, Multi75GB-G, 3 N/m) from 1900 to 900 cm−1 with a 1 cm−1 spectral resolution, at 335 kHz and with 160 ns laser pulse width. Masquer
AFM-IR analyses of the 75-IDC patient. (A, B), FE-SEM images of the analyzed region. 5 μm and 1 μm scale bar respectively. (C) AFM topography of the same region shown in (B). 1 μm scale bar. (D) Local AFM-IR spectra measured at location indicated by the ... Lire la suite
In a recent study, Bouzy et al. [113] proposed monitoring by Raman microspectroscopy the early stages of the mineralization processes in breast cancer cell lines. They investigated two different pathways of cell mineralization to demonstrate that cells’ microenvironments affect the mineralization, as well as BMC physicochemical features. They evaluated the cellular proliferation and adhesion to the surface (i.e. cancer progression) as well as the location of mineral deposits within the cell culture but they did not observe significant chemical changes in the extracellular matrix, i.e. the collagen. In their conclusion, they pointed out that Raman microscopy lacks resolution to be really precise about the location of the deposits and probably to investigate subtle chemical changes within the extracellular matrix.
Using AFM-IR, these changes could be monitored throughout the mineralization maturation and help decipher the link between BMC and breast pathologies.
Our study is the first step to reach a better understanding of the mineralization process at the nanometer scale. One of the next steps could be to perform in parallel with studies done on biopsies, an in-vitro study using a model cancer cell line like the one proposed by Bouzy et al.
4. Conclusion and perspectives
Compared to other pathologies, breast cancer, in routine diagnosis and preventive procedure, mostly relies on classical medical examination like mammography as well as anatomopathological analysis. Unfortunately, it doesn’t really benefit from the advances of more specific techniques like electron microscopy or vibrational spectroscopy commonly used in medical research or for the diagnosis of pathological calcifications, even though, breast medical examination is partially based on the spatial repartition and morphological aspects of microcalcifications. The goal of our study was to evaluate the relevance of FE-SEM, μFT-IR, advanced IR super-resolution technique, such as AFM-IR, to study BMCs in breast biopsy and to propose a multiscale approach, in order to investigate the link between microcalcifications and malignancy.
As a result, FE-SEM confirmed its efficiency to provide accurate morphological diagnosis of BMCs. Four different types of BMCs can be easily distinguished thanks to their typical 3D shape: bipyramidal or dodecahedral for COD (recognized as BMCs of type I), spherical for CA (recognized as BMCs of type II), pseudo cubical for Wk and amorphous mineral for ACCP. COD seems to be linked to benign lesions whereas CA and Wk might be related to malignant lesions. As an example, tissue section from a 75-years old woman suffering with an infiltrating low-grade ductal carcinoma was explored and exhibited BMCs with a characteristic spherical shape of CA. Then a question was raised: were we able to measure the exact chemical composition of such BMCs and its micro-environment? To go deeper into the chemical characterization of tissue section, we proposed to use μFT-IR as it is a widely used, non-destructive and label-free technique, and which is routinely used in hospitals in cases of kidney stones. Like FE-SEM analysis, it is possible to perform IR measurements on tissue sections obtained from embedded paraffin biopsy without any further treatment, except the removal of paraffin just after micro-sectioning. It provides information on the chemical bonds present within a sample by probing molecular vibrations. It might precisely describe the environment and even the crystallinity of a probed species. In the case of BMCs, each type presents a specific IR absorption signature, which is easily recognizable. Their IR absorption spectra present some similarities: an intense absorption band in the 1100–950 cm−1 spectral range mainly associated to phosphate groups (
Moreover, it will be of great interest to go beyond chemical speciation and investigate further the microenvironment of BMCs through trace elements analysis to obtain a more complete picture of the entanglement between pathology, presence of microcalcification and immune response of the body. Indeed, trace elements are essential for the equilibrium of cell metabolism by taking part, among other, to the activation/inhibition of enzymes [119]. In addition, to being essential to the regulation of the cellular activity, trace elements have been highlighted to play a role with carcinogenesis [120, 121, 122]. Physiological elementary composition changes may dysregulate cell activities, resulting in immunological breakdown [123] and accelerate tumor growth [124]. Several studies have already reported and highlighted that trace elements are tightly linked with breast cancer and cancer in general. For example, using in-vitro neutron activation analysis (NAA), Ng et al. [125] showed that many trace elements were significantly higher in cancerous breast tissues compared to the adjacent normal tissues (e.g., within the same sample), this includes: Al, Br, Ca, Cl, Co, Cs, Fe, K, Mn, Na, Rb, and Zn. Especially, as Zn is involved, among other, in carcinogenesis processes and tumor growth [126, 127, 128], some studies have investigated the relationship between Zn and cancer, showing the dysregulation of Zn seems to be organ dependent [129, 130]. In this context, some of them highlight an increase of Zn content in breast cancerous tissues compared to healthy breast tissue [131, 132]. But, the correlation between Zn concentration, the cancer malignancy and the presence of microcalcification, is poorly documented. To explore this relation, one can propose to use X-ray fluorescence (XRF) and X-ray absorption spectroscopy (XAS). Those techniques can determine the distribution of Zn within the tissue depending on the pathology and the presence/absence of BMC. Compared to other trace element characterization techniques, XRF presents the advantage to be compatible with classical fixed tissue section or paraffin embedded biopsies [133, 134] (Figure 17). As a consequence, no additional preparation than those already performed for biopsies analyses and storage in hospital anatomopathological departments, is required.
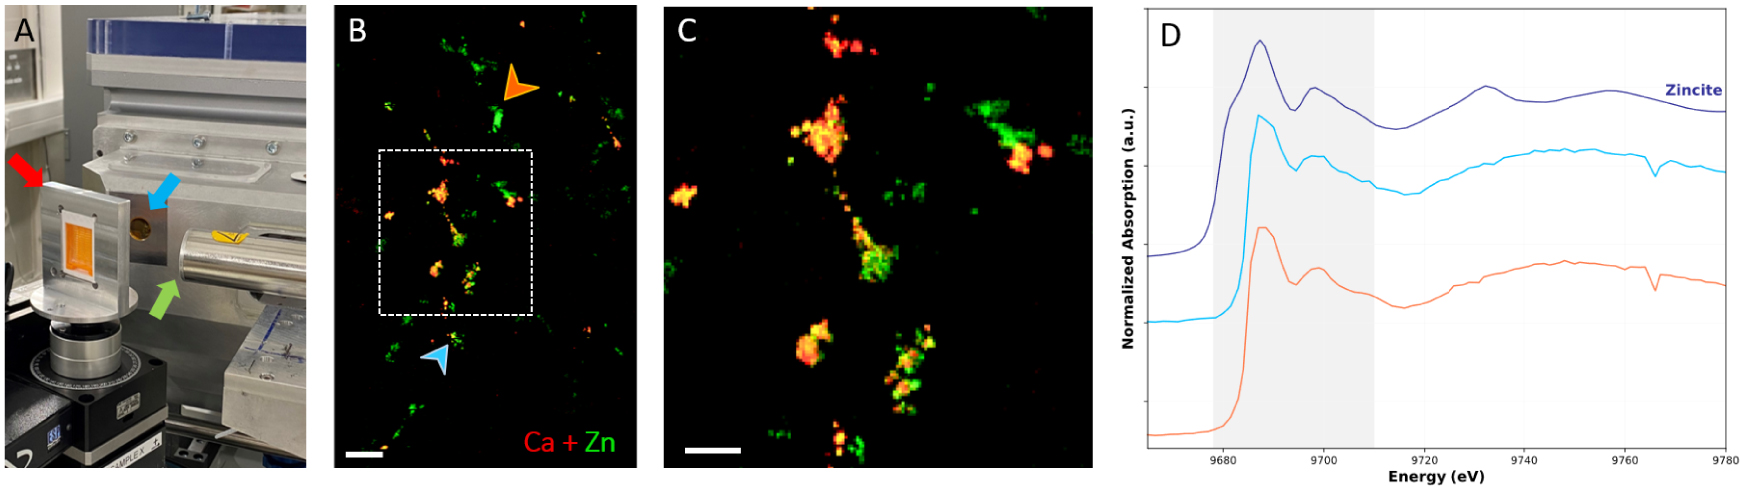
X-ray spectroscopy analyses on paraffin-embedded breast resection using synchrotron radiation. (A) DiffAbs beamline setup at Soleil Synchrotron (Saint-Aubin, France). The arrows indicate: the sample older (red arrow), the beam output (blue arrow) and the detector (green arrow). (B) Composite images of XRF maps of Zn (in green) and Ca (in red); 500 μm scale bar. (C) Zoom of the overlay XRF maps (white rectangle on B composite image) showing partial Ca and Zn colocalization; 200 μm scale bar, and (D) XAS spectra at position indicated by the color-coded arrows on (B). The spectral region highlighted in grey corresponds to the spectral region where differences are observed between experimental spectra. Blue spectra measured at a position with both Ca and Zn signal while the orange spectrum was acquired at a position with only Zn XRF signal. The dark blue spectrum is the Zincite (ZnO): reference spectrum of tetra-coordinated Zn. Masquer
X-ray spectroscopy analyses on paraffin-embedded breast resection using synchrotron radiation. (A) DiffAbs beamline setup at Soleil Synchrotron (Saint-Aubin, France). The arrows indicate: the sample older (red arrow), the beam output (blue arrow) and the detector (green arrow). (B) Composite images of XRF ... Lire la suite
Furthermore, XRF has proven to be clinically relevant, providing trace elements analyses without heavy complex and time-consuming protocol. In particular, using synchrotron radiation trace elements can be detected and described, in biological samples, at the micrometer scale, thanks to the high brightness of synchrotron radiation compared to XRF lab benchtop setup [135]. Therefore, Ca (mainly link to BMC) and Zn XRF maps (distribution within the tissue resection) of the breast biopsy can be obtained to study the presence/absence of Zn with the presence/absence of BMCs (e.g., Ca). Figure 17B and C, present XRF maps acquired on a patient diagnosed with in infiltrating ductal carcinoma. Ca and Zn distribution in the region of the resection are very localized and a partial colocalization of Ca and Zn can be observed (Figure 17C), suggesting Zn with different physical–chemical environment and thus biological role. To confirm that hypothesis, Zn can be further analyzed through Zn K-edge X-ray absorption near edge structure (XANES) spectroscopy to identify Zn electronic and coordination state (Figure 17D). This kind of spectroscopical analysis has already been reported on calcifications [134, 133, 100]. X-ray fluorescence and X-ray spectroscopy are promising techniques to highlight the role of Zn in breast cancer and obtain a better description of the BMC micro-environment. Moreover, this technique allows to follow other trace elements like Mg. As a study suggested that the percentage of Mg, associated with Wk BMC, increases with the cancer malignancy, it could be interesting to precise this kind of hypothesis and investigate by XRF and XANES measurements the possible correlation between Mg and cancer severity. In the future, we propose to perform a systematic multiscale analysis of BMCs, using electron, vibrational and X-ray spectroscopy techniques on benign, non-invasive, and invasive breast samples. It would provide better insight into the relationship between Zn and BMC, as well as the local environment modifications that occur in malignant cancer. We hope that in the future, women will benefit from a better physicochemical characterization of their BMCs for lesion diagnosis purposes.
Conflicts of interest
Authors have no conflict of interest to declare.
Acknowledgments
The authors acknowledge the Synchrotron SOLEIL for provision of synchrotron radiation facilities and XRF-XANES equipment. The authors also acknowledge the department of pathological anatomy and cytology of René Dubos Hospital, and in particular L. Moumi and L. Durupt for the sample preparation.
Author contributions
Margaux Petay performed infrared microspectroscopy, XRF-XANES, SEM and AFM-IR measurements, implemented data treatment, prepared figures and wrote the manuscript.
Maguy Cherfan provided human sample, their anatomopathological study, designed the research and corrected the manuscript.
Elise Bouderlique corrected the manuscript.
Solenn Reguer performed XRF and XANES measurements.
Jérémie Mathurin corrected the manuscript.
Alexandre Dazzi corrected the manuscript.
Maëva l’Heronde performed part of SEM measurements.
Michel Daudon performed FT-IR study, initiated the study, participated in the study design.
Emmanuel Letavernier initiated the study, participated in the study design and corrected the manuscript.
Ariane Deniset-Besseau participated in the study design, participated in the writing and in the correction of the manuscript.
Dominique Bazin performed SEM measurements, initiated the study, participated in the study design, prepared figures and participated in the writing of the manuscript.