


 CC-BY 4.0
1. Introduction
Consumption of fossil fuels is confirmed as the main cause of global warming through the release of green gases. During the last decades of the twentieth century, the problem of climate change has driven choices to alternative sources of energy.
Therefore, the development of renewable energy is becoming a major challenge [1, 2]. Among renewable energy resources, biomass is a promising one for energy production. Biomass represents a significant part of renewable energy and will remain the world’s largest source in the future. In order to achieve efficient use of biomass, strategies are increasingly considering the concept of biorefinery [3, 4]. This concept aligns with the principles of a circular and sustainable economy, aiming to maximize the value obtained from biomass resources while minimizing waste generation. By integrating multiple conversion processes and producing a range of valuable products (value-added chemicals, bioenergy, and bio-based products), biorefineries offer a promising pathway towards a more sustainable and resource-efficient future [5, 6, 7, 8].
Various processes are available for biomass conversion into a variety of products. The most developed processes at a commercial scale are first-generation biofuels production and the heat/electricity co-generation through combustion technique. However, the other thermochemical conversion techniques, namely pyrolysis and gasification are experiencing a great development with various applications offering direct production of heat and/or electricity, biofuels and high value-added chemicals [1, 9, 10, 11, 12, 13, 14]. The pyrolysis process is a thermochemical conversion technique leading to the formation of three fractions: bio-oil (liquid), bio-char (solid) and syngas. These three fractions can be used as biofuels and converted into different forms: electricity and/or heat, fuel for transport and bio-products. However, the yields of pyrolysis products depend on operating conditions such as temperature and heating rate, but also on the biomass nature. Thus, depending on the severity of the process (based on the heating rate and residence time), three pyrolysis types are classified as: slow pyrolysis, moderate pyrolysis and fast pyrolysis [15, 16].
Temperature and residence time (through heating rate) are the main two factors influencing the pyrolysis, thus affecting the pyrolysis products composition [17, 18, 19]. Slow pyrolysis is a very old technique used for charcoal production [20]. It is characterized by a low heating rate of particles (long residence time) and promotes the production of low proportions of liquid and gaseous products and more char residue at low temperatures. Fast pyrolysis is characterized by a high heating rate and temperature. It is carried out under conditions of intense external heat transfer (short vapor residence times), produces low char fraction, and promotes the production of high-quality bio-oil [21].
Intermediate pyrolysis has recently appeared to be an opportunity for the combined generation of bio-char and bio-oil. The advantage of intermediate pyrolysis is to prevent the formation of high molecular tar with dry and broken char suitable for other applications such as soil amendment, activated carbon production, and gasification. Yang et al. [22] have performed intermediate pyrolysis of sewage sludge and deinking sludge in order to produce bio-oil usable as biofuels in a diesel engine. Experiments were carried out at 450 °C at residence times of 7–10 min. The yields of bio-oil, bio-char and syngas were 40 wt%, 48 wt% and 12 wt%, respectively. The bio-oils obtained have very interesting physical and chemical properties (higher heating value, high carbon and hydrogen contents, low cetane index …) comparable to diesel and biodiesel fuels. The authors have shown that these bio-oils blended with biodiesel can be used as diesel engines. The intermediate pyrolysis of wood and barley straw was carried out at 450 °C at a residence time of 1.5 min [23]. After separation of organic and aqueous phases, the organic phase yield is 34.1 wt% for wood, and 12.0 wt% for barley straw. The bio-oil had a heating value of 24 MJ⋅kg−1 and was composed mainly of heterocyclic and phenolic compounds. Torri et al. [24] have studied the intermediate pyrolysis of softwood and hardwood in a bench-scale fixed bed at 400, 550, and 700 °C, and a heating rate of 100 °C⋅min−1. They found that a pyrolysis temperature of 500 °C is optimal for higher bio-oil yield for both wood species. Using GC/MS analysis, it was shown that the bio-oil from Eucalyptus was rich in ketonic and phenolic compounds. Kim et al. [25] investigated the effects of temperature on intermediate pyrolysis of pine wood in an auger reactor. The pyrolysis temperature varies between 500 °C, 525 °C and 550 °C. The obtained yields were 59.8%, 22.6% and 17.6% for bio-oil, bio-char and syngas, respectively at the optimal temperature of 500 °C. Ahmed et al. [26] studied intermediate pyrolysis of four trees grown in a fixed-bed tubular reactor at a temperature of 500 °C and a heating rate of 25 °C⋅min−1. At 500 °C, the pyrolysis experiments gave a bio-oil, bio-char and bio-gas yields of 41.24–52.95 wt%, 31.6–38.78 wt%, and 14.64–21.92 wt%, respectively. The generated bio-oils had calorific values in the range of 23.46–30.65 MJ/kg and were mainly composed of heterocyclic and phenolic compounds. The characteristics of bio-chars showed their possible applications in energy production, pollutants removal and soil remediation. The effect of temperature and residence time on intermediate pyrolysis of agricultural waste were also examined by Morgano et al. [27]. The agricultural waste was thermally treated in an auger reactor at 350–500 °C for different residence times (2.5–40) min.
Morocco has a strong potential for renewable agricultural sources since its economy is based on agriculture activities. One of these sources is woody biomass which is used for different purposes (lumber, fuelwood, production of charcoal, production of pulp, etc.) [28, 29, 30]. In recent years, the Ficus nitida trees have grown wildly in many areas. They can be grown under harsh conditions where there is a little water and effort. This tree can be used for the environmental considerations and can be used as a dedicated energy culture. Ficus trees, like many other trees, absorb carbon dioxide from the atmosphere through photosynthesis. They store the carbon and release oxygen, helping to mitigate climate change by reducing greenhouse gases.
Despite several investigations on the intermediate pyrolysis of various biomass feedstocks, no data on the intermediate pyrolysis of Ficus wood are currently available. The main goal of this study is to examine the intermediate pyrolysis of Ficus wood as dedicated energy culture in order to produce energy-rich bio-oil and value-added bio-char. In particular, the effect of the operating conditions on the bio-oil and biochar yields and properties are examined.
2. Experimental study
2.1. Raw material
Ficus wood was collected from the green zones in the region of Beni Mellal-Khenifra, Morocco. The sample was first dried and then crushed into powder form. The sample was sieved to obtain particles ranging from 0.1 to 0.2 mm. Moisture, ash content and volatile matter contents were determined using thermogravimetric analysis. Fixed carbon was calculated by difference according to:
| (1) |
The composition of Ficus nitida wood based on proximate and ultimate analyses are presented in Table 1.
Proximate, ultimate, biochemical analyses, and HHV of Ficus nitida wood
| Characteristics | Ficus wood | |
|---|---|---|
| Proximate analysis (wt%) | Moisture content | 5.38 |
| Volatile matter | 68.75 | |
| Ash | 14.4 | |
| Fixed carbon | 16.85 | |
| Ultimate analysis (wt%) | Carbon | 43.55 |
| Hydrogen | 5.76 | |
| Nitrogen | 0.68 | |
| Sulfur | – | |
| Oxygen | 50.01 | |
| Fiber analysis (wt%) | Extractive | 5.33 |
| Hemicellulose | 31.78 | |
| Cellulose | 41.09 | |
| Lignin | 21.80 | |
| H/C molar ratio | 1.587 | |
| O/C molar ratio | 0.861 | |
| Empirical formula | CH1.587O0.861N0.013 | |
| Higher heating value (MJ⋅kg−1) | 16.82 | |
2.2. Experimental procedure
The pyrolysis experiments were carried out in a fixed-bed reactor. The fixed-bed reactor system is shown in Figure 1. These experiments were carried out to determine the effect of temperature, heating rate and N2 gas flow on the products yields. The experiments were conducted in two series. In the first one, the objective was to determine both the influence of temperature and heating rate on product yields. During this experiment, 10 g of dried Ficus wood were pyrolyzed in the reactor at different temperatures (350, 400, 450, 500, 550, and 600 °C) with four heating rates (20, 50, 80, and 100 °C⋅min−1) under a N2 gas flow of 200 ml⋅min−1 and for 10 min. The liquid products collected in bottles (aqueous and oil phase) were washed with dichloromethane and separated from each other by decantation. The oil was recovered and its yield was calculated. The bio-chars were also collected and weighed. During the first set of experiments, the maximum oil yield was found at 500 °C for a heating rate of 100 °C⋅min−1.
The fixed-bed tubular reactor system.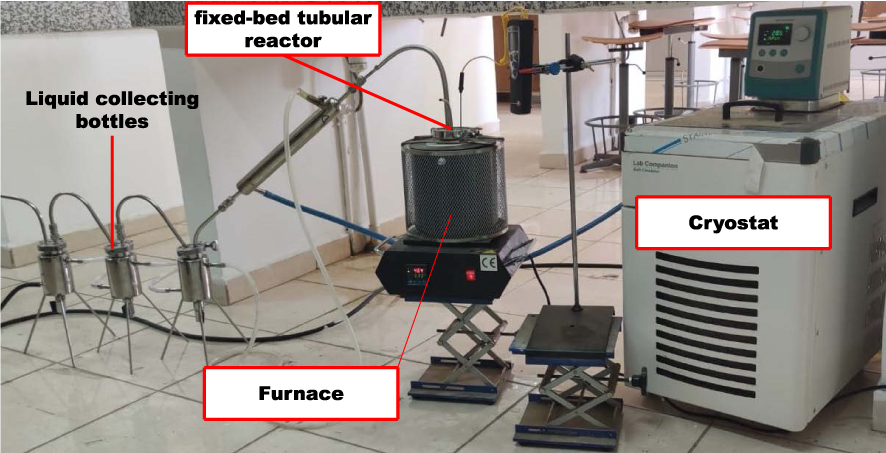
In the second set of experiments, four N2 gas flow (50, 100, 200, 400, and 800 mL⋅min−1) were studied at 500 °C with a constant heating rate of 100 °C⋅min−1 to investigate the effect of N2 gas flow on product yields.
After completion of all experiments, the product yields were calculated as follows:
| (2) |
| (3) |
| (4) |
2.3. Characterization
2.3.1. Proximate analysis
The immediate analysis is based on the determination of the following parameters: moisture content, volatile matter fraction, fixed carbon and ash content. These parameters are determined using a thermogravimetric analyser (SETARAM-LABSYS evo STA 1600).
2.3.2. Ultimate analysis
The ultimate analysis or elemental analysis for the evaluation of carbon, hydrogen, nitrogen, and oxygen is carried out using an elemental analyzer (vario MICRO cube V4.0.2). The H/C, O/C molar ratios and empirical formulas were calculated from elemental composition.
2.3.3. High heating value (HHV)
A bomb calorimeter (Model 1261, Parr Instruments) was used to measure higher heating value (HHV) using ASTM D 5865-04.
2.3.4. Thermal analysis
The thermal degradation of bio-oil was studied by thermogravimetric analysis (TGA) from 100 to 900 °C in order to observe the maximum temperature of each fraction before degradation. TGA also provides information on the boiling-point distribution of the bio-oil. TGAs were performed using a SETARAM-LABSYS evo STA 1600 apparatus.
2.3.5. FT-IR analysis
Fourier transform infrared spectroscopy (FTIR) analyses were carried out using a Bruker tensor27 infrared spectrometer. All the spectra are at a resolution of 4 cm−1 between 400–4500 cm−1.
2.3.6. 1H NMR analysis
1H NMR spectra were recorded using a 600 MHz Bruker spectrospin instruments. Samples were dissolved in deuterated chloroform.
2.3.7. GC–MS analysis
The molecular composition of the bio-oils was obtained using gas chromatography coupled to mass spectrometry GC–MS (Thermo scientific ISQ single quadrupole). This technique permits the analysis of volatile compounds. A sample of volume 1 μL is injected with a 20:1 split. Helium is used as carrier gas (1.2 mL⋅min−1). The temperature ramp was programmed between 70 and 300 °C at 10 °C⋅min−1 and the injector temperature maintained at 300 °C. Each sample was injected three times to test the reproducibility of the measurement.
2.3.8. SEM analysis
The morphology of the woody biomass and corresponding bio-char was examined with a scanning electron microscope (phenom Pro X). SEM was performed using a 15 kV electron acceleration. The images were taken at 3000× magnification.
2.3.9. BET analysis
The surface area of biomass and bio char was determined using Quantacrome instruments NOVA 1000 BET surface area and pore size analyser in N2 atmosphere. The sample was degassed in a vacuum chamber at 50–180 °C for 5 h. The degassed sample was then analysed in a Dewar calorimeter containing liquid N2.
3. Results and discussion
3.1. Characterization of Ficus wood
Physicochemical properties of Ficus wood studied are outlined in Table 1. Proximate analysis shows that Ficus wood has lower moisture content (5.38%), higher volatile matter content (68.75%) and less fixed carbon content (16.85%). Such a composition indicates that the Moroccan woody biomass is more appropriate for bio-oil production [31]. Higher ash content (14.4%) of Ficus wood has negative effects on the conversion efficiency, which led to higher bio-char content and lower heating value of the biomass [32]. The ultimate analysis showed that Ficus wood contains a carbon content of 43.55% which confirms the suitability of Ficus wood for pyrolysis. The HHV was found to be 16.82 MJ/kg, which is due to O/C (0.861) and ash content (14.4%) in the Ficus wood. The holocellulose (cellulose and hemi-cellulose) content was about 72.87% which confirms that the material was more adapted for bio-oil production.
FT-IR spectra of Ficus wood are given in Figure 2. The raw wood was characterized by FT-IR in the middle region, including wave numbers between 4000 and 400 cm−1. The aim of FT-IR analysis was the identification of functional groups in raw wood for comparison with possible structural changes after the pyrolysis. FT-IR analysis shows that the wood is composed of alkyl, ester and phenolic groups. A stretching vibration around 3300 cm−1 indicates the presence of phenolic and alcoholic groups. The weak band at 2900 cm−1 can be assigned to C–H stretching due to the aliphatic methylene groups. The peaks at 1700–1800 cm−1 (carbonyl stretch) confirm greater concentrations of fatty acids. The presence of nitrogen components may be deduced by the N–H bending vibrations seen in the frequency range of 1660–1560 cm−1. The O–H bending vibrations at 1420 cm−1 confirm the presence of alcoholic components. The bending vibrations observed in the range of 1390–1300 cm−1 confirm the presence of phenolic groups. The C–O stretching absorbance peaks at 950–1340 cm−1 indicate the presence of primary, secondary and tertiary alcohols, phenols, ethers and esters.
FTIR spectra of Ficus wood.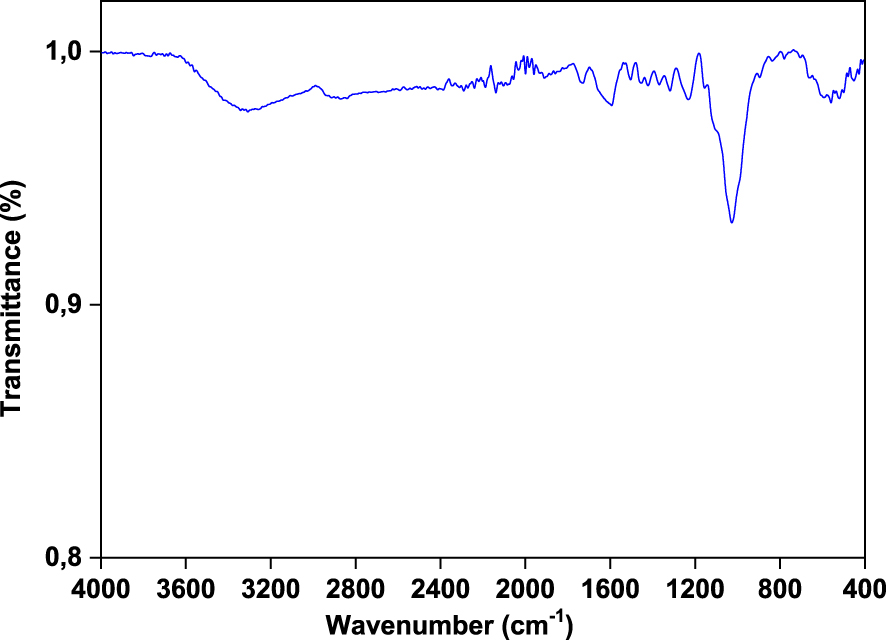
Before performing the pyrolysis experiments, thermal behavior of the Ficus wood was also investigated by TGA. The thermogravimetric weight loss and the corresponding derivative curves are given in Figure 3. It shows that the main degradation process (also known as the active pyrolysis) occured at a temperature range of 200–600 °C, resulting in a total weight loss of 61.41%. The first volatilization of the active pyrolysis occurred at a temperature range of 180 °C to 380 °C which corresponds to the decomposition of hemicellulose and cellulose. The second stage of the active pyrolysis occurred in the temperature range of 380 °C to 600 °C, due to decomposition of lignin. After this temperature, mineral decomposition takes place (metal carbonates). From dm∕dt curve, it is evident that devolatilization takes place from 180 to 380 °C and decomposition occurs from 380 to 600 °C. Therefore, the result of TGA/DTG curves show that the 350–600 °C range would be optimal for the pyrolysis of Ficus wood. According to literature, the temperature range for the decomposition of hemicellulose is 141–304 °C, cellulose is 276–407 °C, and lignin is 380–588 °C [33]. Those temperature ranges were determined using a heating rate of 10 °C/min. Additionally, another study by Kaur et al. [34] suggests that the active pyrolysis process involves the decomposition of hemicellulose, cellulose, and lignin in a temperature range of 160–520 °C. This temperature range is likely associated with the primary decomposition of those components during pyrolysis.
TGA/DTG of Ficus wood.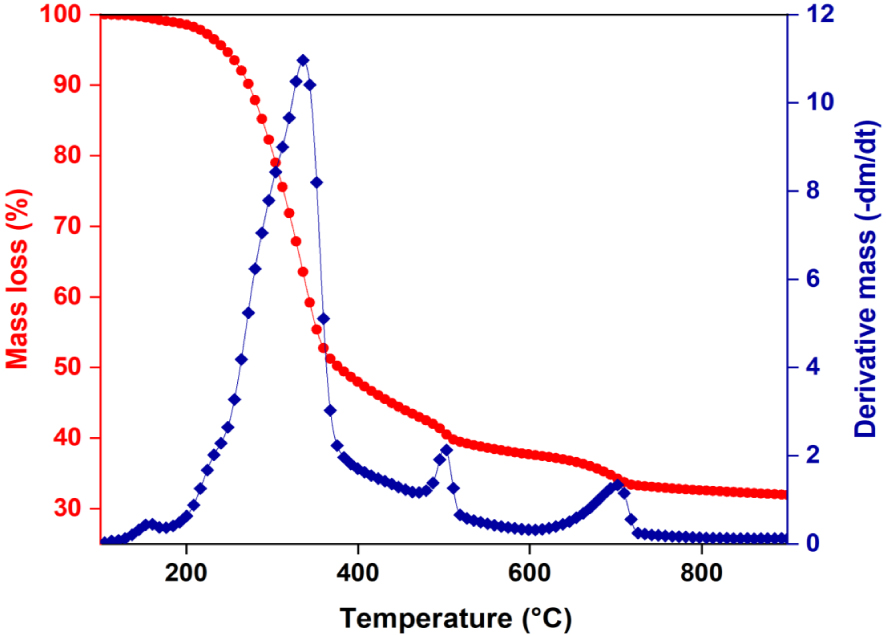
3.2. Effect of pyrolysis parameters on the product distribution
3.2.1. Effect of temperature and heating rate on the product distribution
Figure 4 shows the effect of pyrolysis temperature and heating rate on the yield distribution of pyrolysis products (Figure 4a: Conversion; Figure 4b; Bio-char yield; Figure 4c: Bio-oil yield; Figure 4d: Bio-gas yield, respectively). The experiments were conducted at 350–600 °C with different heating rate of 20, 50, 80, and 100 °C⋅min−1 with a N2 flow rate of 100 mL⋅min−1.
Effect of pyrolysis temperature and heating rate on products yields.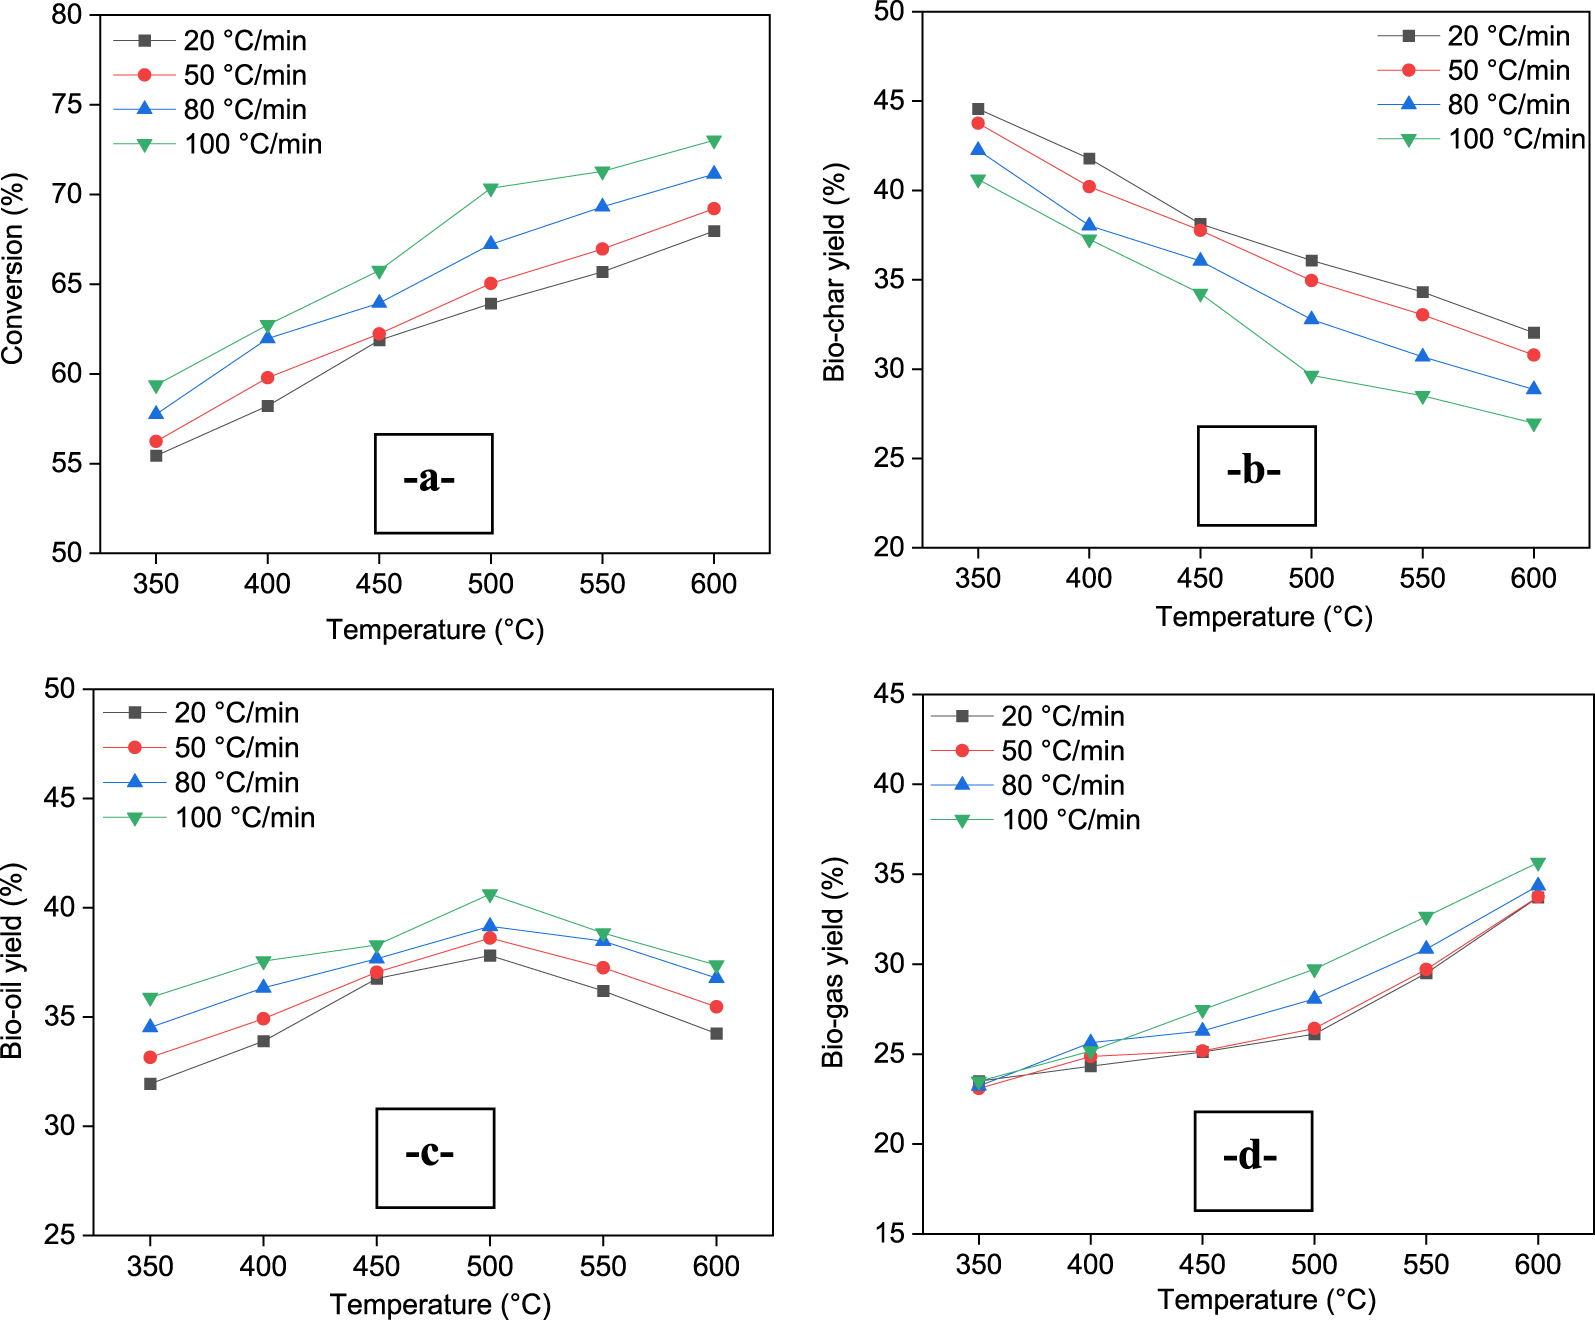
It can be seen from Figure 4 that pyrolysis temperature has a significant effect on both conversion and product distribution. For all heating rates, it can be concluded that, when the temperature increases from 350 to 500 °C, the bio-oil yield increased from 31.97%–35.89% to 37.81%–40.62%. This increase is more significant at a heating rate of 100 °C⋅min−1. At 600 °C, the bio-oil yield decreased to 34.24%–37.37%. An increase in pyrolysis temperature from 350 °C to 600 °C and heating rate from 20 to 100 °C⋅min−1 led to an increase in gas yield from 23.09%–23.50 to 33.72%–35.65%, while bio-char yield decreased from 44.56%–40.62% to 26.98%–32.04%. The higher temperature led to more bio-oil cracking resulting in higher bio-gas yield and lower bio-oil yield. Furthermore, the decrease in charcoal yield is due to high primary decomposition and/or secondary pyrolysis of bio-char at higher temperature. With a high heating rate of 100 °C⋅min−1, about 7 to 15% more bio-oil is produced than at 20 °C⋅min−1. Hence, the highest bio-oil yield was obtained at 500 °C with a heating rate of 100 °C⋅min−1. A high heating rate in pyrolysis processes facilitates efficient heat transfer, minimizes residence time, controls reaction pathways, and reduces mass and heat transfer limitations. These factors collectively contribute to high selectivity towards bio-oil production by minimizing the occurrence of secondary degradation reactions and maximizing the conversion of biomass into liquid products.
The effect of temperature is the main important parameter on bio-oil production during intermediate pyrolysis. It has been shown that optimal temperature for maximum bio-oil yield is obtained in the 450–550 °C range depending on the type of biomass, reactor type and heat transfer mechanism. Santos et al. [35] studied the intermediate pyrolysis of lignocellulosic biomass at 400, 450, and 500 °C. The highest bio-oil yield was obtained at 500 °C. The authors concluded that the increase in pyrolysis temperature improved total acid number, viscosity, and density of the bio-oil, but did not change significantly the biochar and syngas characteristics. Torri et al. [24], pyrolyzed two types of wood in a bench-scale fixed bed under different pyrolysis conditions in order to determine the role of final temperature (400, 550, and 700 °C), mass of biomass (5, 7, and 9 g) and catalyst type (ZSM-5, SiO2/Al2O3 ratio of 140) on the product yields. It was found that the higher bio-oil yield was obtained at a pyrolysis temperature of 500 °C for two woods. They obtained bio-oil yields of 49 ± 1.3% and 50 ± 5.7% for Eucalyptus sp. chips and Picea abies residues, respectively. They observed that the bio-oil obtained from Eucalyptus pyrolysis is rich in ketonic and phenolic compounds using GC/MS analysis. Kim et al. [25] studied pyrolysis of pine wood in an auger reactor at various temperatures (500 °C, 525 °C, and 550 °C). The authors found that, at 500 °C, the pyrolysis gave the highest bio-oil yield of 59.8 wt%. It has been shown that there is a parabolic behavior for bio-oil production as a function of temperature wherein the maximum bio-oil yield is obtained with reactor temperatures between 450 °C and 500 °C, depending on the type of biomass and reactor. Bhattacharjee and Biswas [36] performed the pyrolysis of alligator weed at a temperature range from 350 to 550 °C at a constant heating rate of 25 °C⋅min−1 and under N2 atmosphere at a flow rate of 100 mL⋅min−1. The maximum liquid yield was found to be 40.10% at 450 °C. The maximum yield of lignin-derived oligomers has been reported between 450 and 500 °C [37]. These results reflects the balance between primary reactions which release oligomeric products from biomass, and secondary reactions which degrade these products into monomers and eventually small organic compounds and gas above 500 °C [38].
3.2.2. Effect of gas flow rate on the product distribution
The effect of five N2 flow rates of 50, 100, 200, 400, and 800 mL⋅min−1 on product distribution was determined under the optimum conditions (temperature: 500 °C, heating rate: 100 °C⋅min−1). Figure 5 shows the effect of N2 flow on product distribution. The maximum bio-oil yield of 41.85% was obtained at a N2 flow rate of 100 mL⋅min−1. At 800 mL⋅min−1, the bio-oil yield dropped to 36.89%. The syngas yield increased from 28.98% to 36.83%, and the bio-char yield decreased from 30.71% to 26.02% when N2 flow rate was increased from 50 mL⋅min−1 to 800 mL⋅min−1. At lower N2 flow rates, volatiles residence times were longer, which resulted in the formation of more biochar. This results in low bio-oil yield since secondary reactions of vapors such as thermal cracking, repolymerization and recondensation take place. Thus, at 100 mL⋅min−1, those secondary reactions were minimized, and the bio-oil yield exhibited a significant increase. Ignoring the small differences in the values obtained in our study compared to previous studies, similar results have been reported in the literature [36, 39, 40, 41]. As the flow rate of N2 increased, more steam formation occurred, caused a continuous decrease in biochar yield, an increase in gas yield and significant decrease in bio-oil yield. Such a behavior is due to either poor cooling or fast release of pyrolysis vapors before condensation. As reported in literature, gas sweeping during pyrolysis affects residence time by removing the volatile substances from the hot zone to minimize secondary reactions such as thermal cracking, repolymerization and recondensation [39, 40, 41].
Effect of N2 flow rate on product yields at a heating rate of 100 °C⋅min−1 and pyrolysis temperature of 500 °C.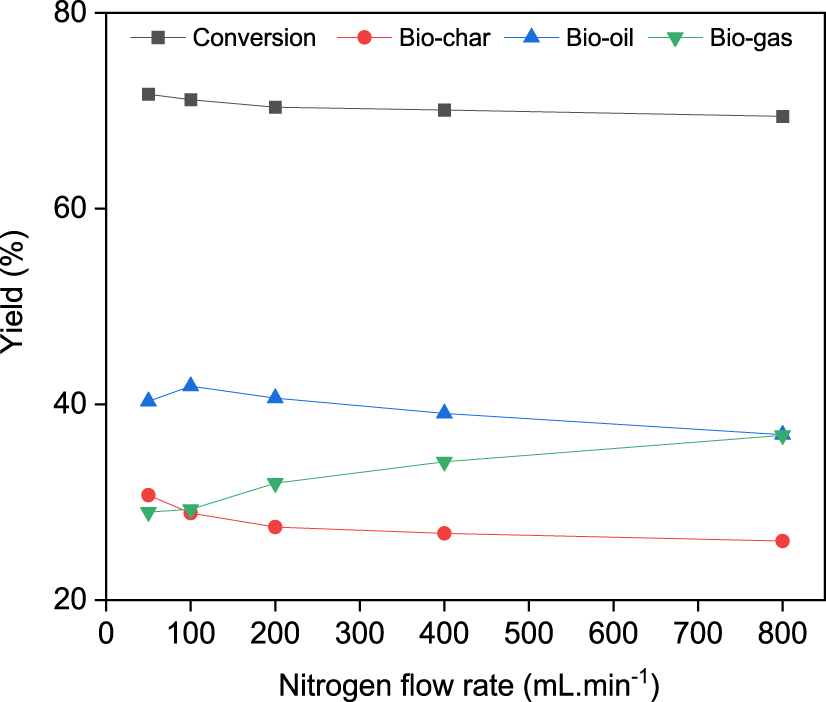
3.3. Characterization of bio-oil
Physicochemical, physical and chemical properties of bio-oil produced under optimal pyrolysis conditions (temperature of 500 °C, heating rate of 100 °C⋅min−1, N2 flow rate 100 mL⋅min−1) were evaluated.
3.3.1. Physicochemical characteristics
Proximate and ultimate analyses and physical characteristics of bio-oil are presented in Table 2. It is observed that carbon content (51.9%) increased greatly when compared with Ficus wood (43.55%) and the oxygen contents of bio-oil (40.25%) were found to be less than that of Ficus wood (50.01%). The calorific value of the bio-oil (22.56 MJ⋅kg−1) is rather higher than that of Ficus wood (16.82 MJ⋅kg−1). The H/C and O/C molar ratios of bio-oil are 1.635 and 0.582, respectively. The H/C molar ratio of bio-oil was greater than Ficus wood and between those of the light and heavy petroleum products (1.5–1.9) [43, 44]. The empirical formula of bio-oil obtained from elemental analysis data is CH1.635O0.582N0.013. For better quality of transportation fuel, the H/C ratio of bio-oil obtained in this research should be increased in the range of 1.9–2.0. Therefore, bio-oil upgrading is needed by hydrotreating to increase this ratio by adding hydrogen [45].
Proximate, ultimate analyses and physical characteristics of bio-oil
| Characteristics | Raw wood | Bio-oil | |
|---|---|---|---|
| Proximate analysis (wt%) | Moisture content | 5.38 | 9.85 |
| Volatile matter | 68.75 | 87.12 | |
| Ash | 14.4 | 4.08 | |
| Fixed carbon | 16.85 | 8.8 | |
| Ultimate analysis (wt%) | Carbon | 43.55 | 51.9 |
| Hydrogen | 5.76 | 7.07 | |
| Nitrogen | 0.68 | 0.78 | |
| Sulfur | – | – | |
| Oxygen | 50.01 | 40.25 | |
| Fiber analysis (wt%) | Extractive | 5.33 | – |
| Hemicellulose | 31.78 | – | |
| Cellulose | 41.09 | – | |
| Lignin | 21.80 | – | |
| H/C molar ratio | 1.587 | 1.635 | |
| O/C molar ratio | 0.861 | 0.582 | |
| Empirical formula | CH1.587O0.861N0.013 | CH1.635O0.582N0.013 | |
| Higher heating value (MJ⋅kg−1) | 16.82 | 22.56 | |
The bio-oil potentiality highly depends on its calorific value. The higher calorific value of bio-oil from Ficus wood is 22.56 MJ/kg, which is comparable to the result obtained by other authors [8, 42]. Since bio-oil derived from biomass contains higher oxygen content compared to fossil fuel, its calorific value and energy density is inferior compared to commercial fuels [46].
3.3.2. Chemical composition
In the present work, the chemical functional groups, nature of protons and chemical compounds present in the bio-oil are determined through GC–MS, 1-H NMR and FTIR analysis.
FTIR characterization is performed to evaluate the functional groups present in the bio-oil. Results of the FTIR analysis for pyrolytic liquid derived from Ficus wood is shown in Figure 6. There are various peaks with weak, medium and strong intensity corresponding to different bonds present in bio-oil. The O–H stretching vibrations between 3100 and 3600 cm−1 indicate the presence of phenols and alcohols [47, 48]. The saturated C–H stretching vibrations in frequency range of 3000–2800 cm−1 and C–H bending vibration bands between 1500 and 1315 cm−1 indicate the presence of alkanes. The strong peaks at 1640 and 1820 cm−1 show a rise due to C=O stretching vibration, which indicates the presence of ketones, carboxylic acids or aldehydes [49, 50]. The stretching vibrations of C=C observed at 1515 and 1608 cm−1 can be ascribed to aromatics and alkenes. Aromatic compounds are confirmed by the aromatic C=C stretching vibrations between 1430 and 1545 cm−1 [40]. The peaks at 1300–950 cm−1 are related to C–O stretching and O–H bending indicating the presence of primary, secondary and tertiary alcohols, phenols, esters, and ethers [51]. The absorption peaks between 650 and 900 cm−1 indicate mono- and polycyclic and substituted aromatic groups [52]. The present FT-IR analysis of bio-oil confirms the presence of various chemical components such as alkanes, alkenes, aromatics and several oxygen-containing compounds such as alcohols, phenols, ketones, carboxylic acids or aldehydes. Furthermore, in order to quantify the presence of different chemical components in the bio-oil and also justify the existence of the above functional groups, the bio-oil was analysed through GC–MS.
FTIR spectrum of bio-oil from Ficus nitida wood obtained at 500 °C for 100 °C⋅min−1 and 100 mL⋅min−1 of N2.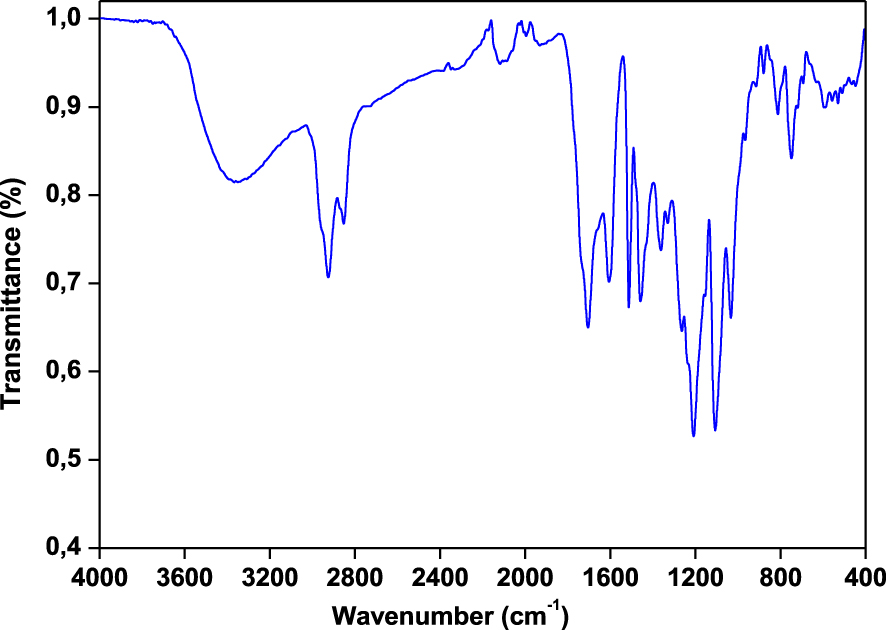
1-H NMR spectroscopy is applied to examine the type of protons present in the entire bio-oil. The 1-H NMR spectra of Ficus wood bio-oil are given in Figure 7. Based on the chemical deviation obtained from the 1-H NMR spectrum, Table 3 gives the proportion of proton types present in the bio-oil. From Figure 7, the first region between 0.5 and 1.5 ppm represents about 39.68% of resonated protons due to the existence of aliphatic protons. The following part of the spectra (1.5–3.0 ppm) demonstrates the aliphatic protons of 27.38% that are attached to C=C either olefinic or two double bonds from heteroatoms. The section in the middle of 3.0–4.5 ppm is attributed to the protons of amines, alcohols or aliphatics, or a methylene group which bonds two aromatic rings, around 17.08% protons for Ficus wood bio-oil are in this area. The area between 4.5 and 6 may be due to the presence of protons (3.57%), which are attached to carbon molecules in methoxy or phenolic OH groups. Finally, the aromatic area in the 6.0–9 ppm range contains around 12.31% of protons. The above means the existence of alkenes, alkanes, aromatics and other synthetic chemicals like alcohols, acids, phenols, etc. in Ficus wood bio-oil, in agreement with the FTIR study.
1H-NMR spectrum of bio-oil from Ficus wood obtained at 500 °C for 100 °C⋅min−1 and 100 mL⋅min−1 of N2.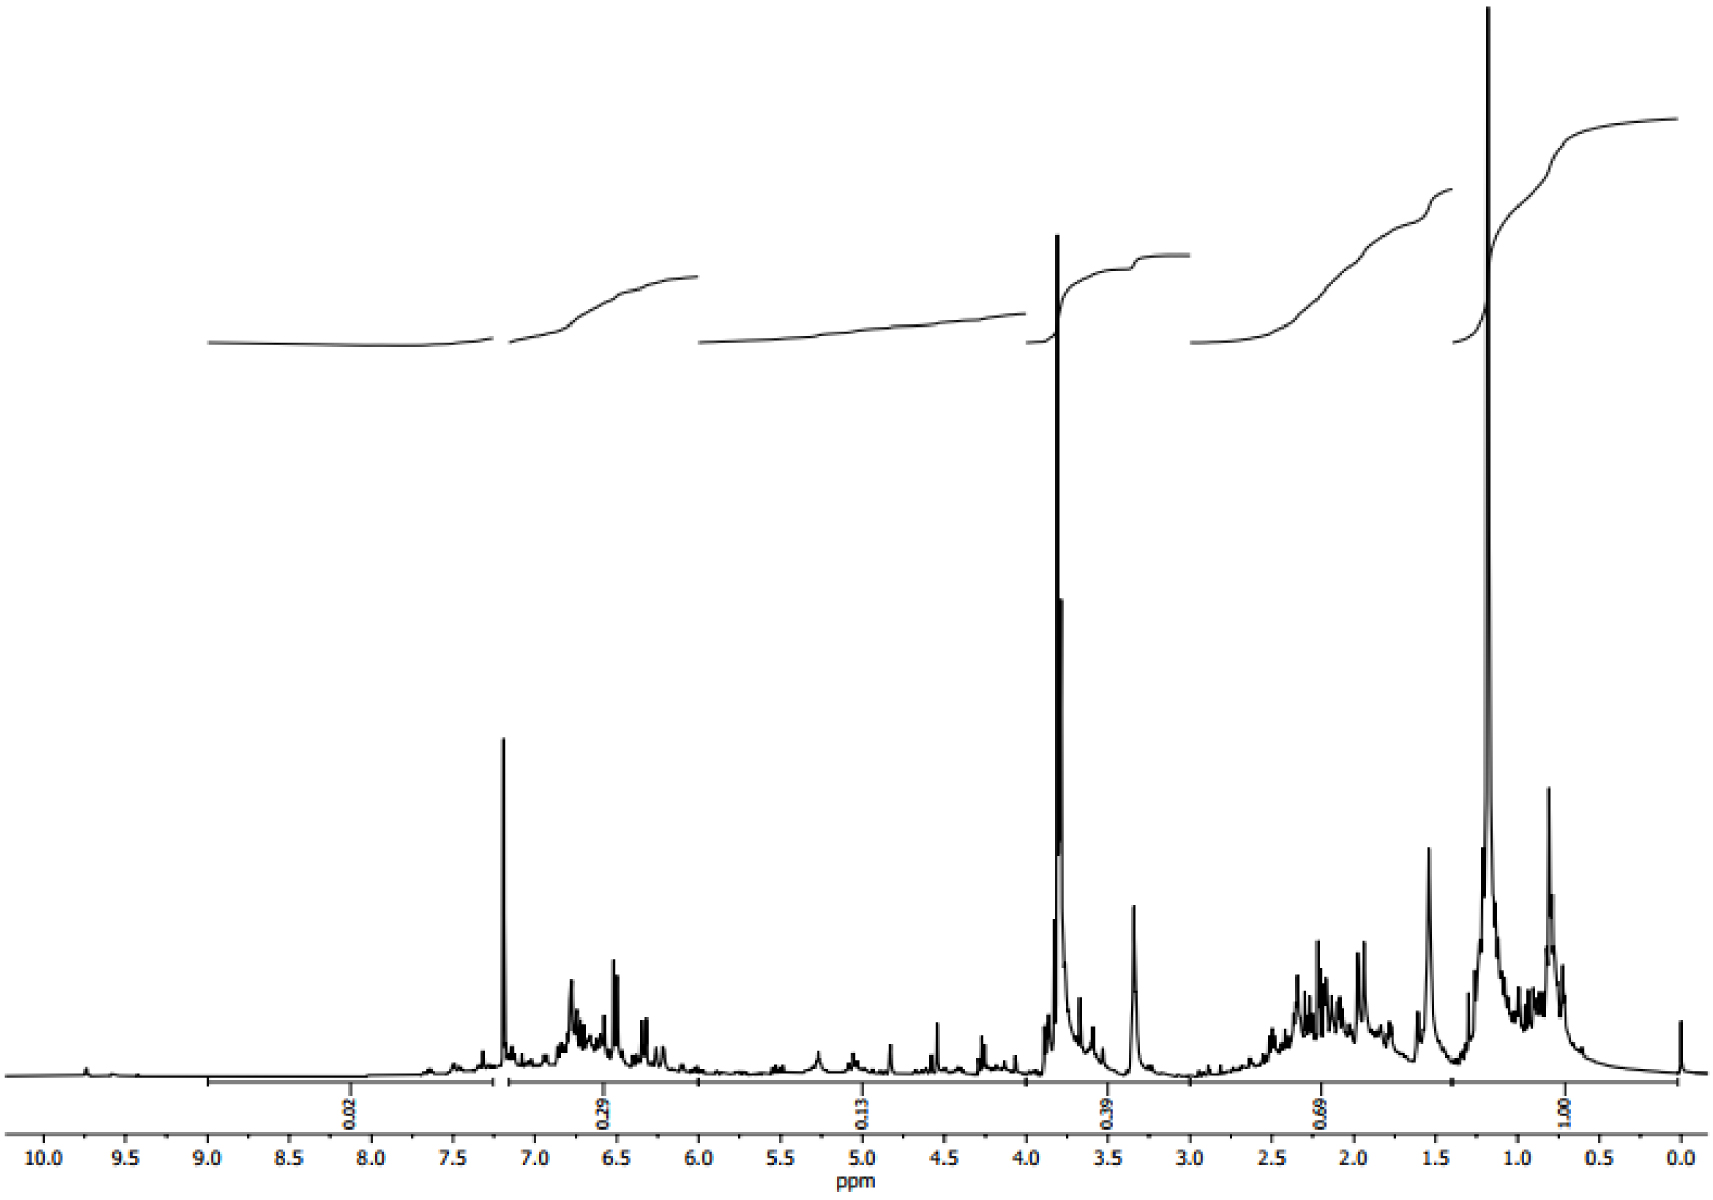
The amount of Hydrogen types of the bio-oil
| Chemical shift (ppm) | Type of protons | Area (%) |
|---|---|---|
| 0.5–1.5 | Aliphatic (attached to C that is two bonds from C=C or C connected to heteroatom) | 39.68 |
| 1.5–3.0 | CH3, CH2 and CH α to aromatic ring or acetylenic | 27.38 |
| 3.0–4.0 | Hydroxyls, ring-joining methylene, methine or methoxy | 15.47 |
| 4.0–6.0 | Phenols, non-conjugated olefins | 5.16 |
| 6.0–9.0 | Aromatics, conjugated olefins | 12.31 |
The GC/MS spectrum of bio-oil is given in Figure 8. The list of compounds identified by GC/MS is given in Table 4. More than 200 peaks were detected in mass spectra showing that there is no major component and only the 43 components with area more than 0.8% (totalling 75%) are presented in Table 4. Table 4 and Figure 8 show that the bio-oil compounds from intermediate pyrolysis of Ficus wood can be grouped into four different classes of monoaromatic, aliphatic, oxygenated, and polyaromatic compounds. Monoaromatic compounds include toluene, furans, phenols, benzene and their derivatives. Aliphatics mainly consist of alkanes and alkenes and their derivatives, oxygenated compounds of aldehydes, ketones, carboxylic acid and esters [40, 42]. As seen from Table 4, phenolics and their derivatives (54% of total area of bio-oil) as well as aliphatics (27% of total area of bio-oil) are the major components of bio-oil. They consist of phenols, methoxyphenols, alkylphenols and eugenol. During pyrolysis of woody biomass, hemicelluloses decompose first (200–280 °C) forming acidic compounds such as acetic acid. On the other hand, decomposition of cellulose (240–350 °C) produces levoglucosan as the primary breakdown product during thermal treatment, but other anhydroglucoses, furan, and furan derivatives are also produced. Phenols and their derivatives such as 2-methoxyphenol, 2,6-dimethoxyphenol and phenol, the majority of the compounds in bio-oil, are obviously the primary products of degradation of lignin (280–500 °C) during pyrolysis. Bio-oil can be used not only as a fuel in engines but also as a chemical feedstock, phenols could be considered as one of them because of their commercial values.
GC/MS spectrum of bio-oil from Ficus wood obtained at 500 °C for 100 °C⋅min−1 and 100 mL⋅min−1 of N2.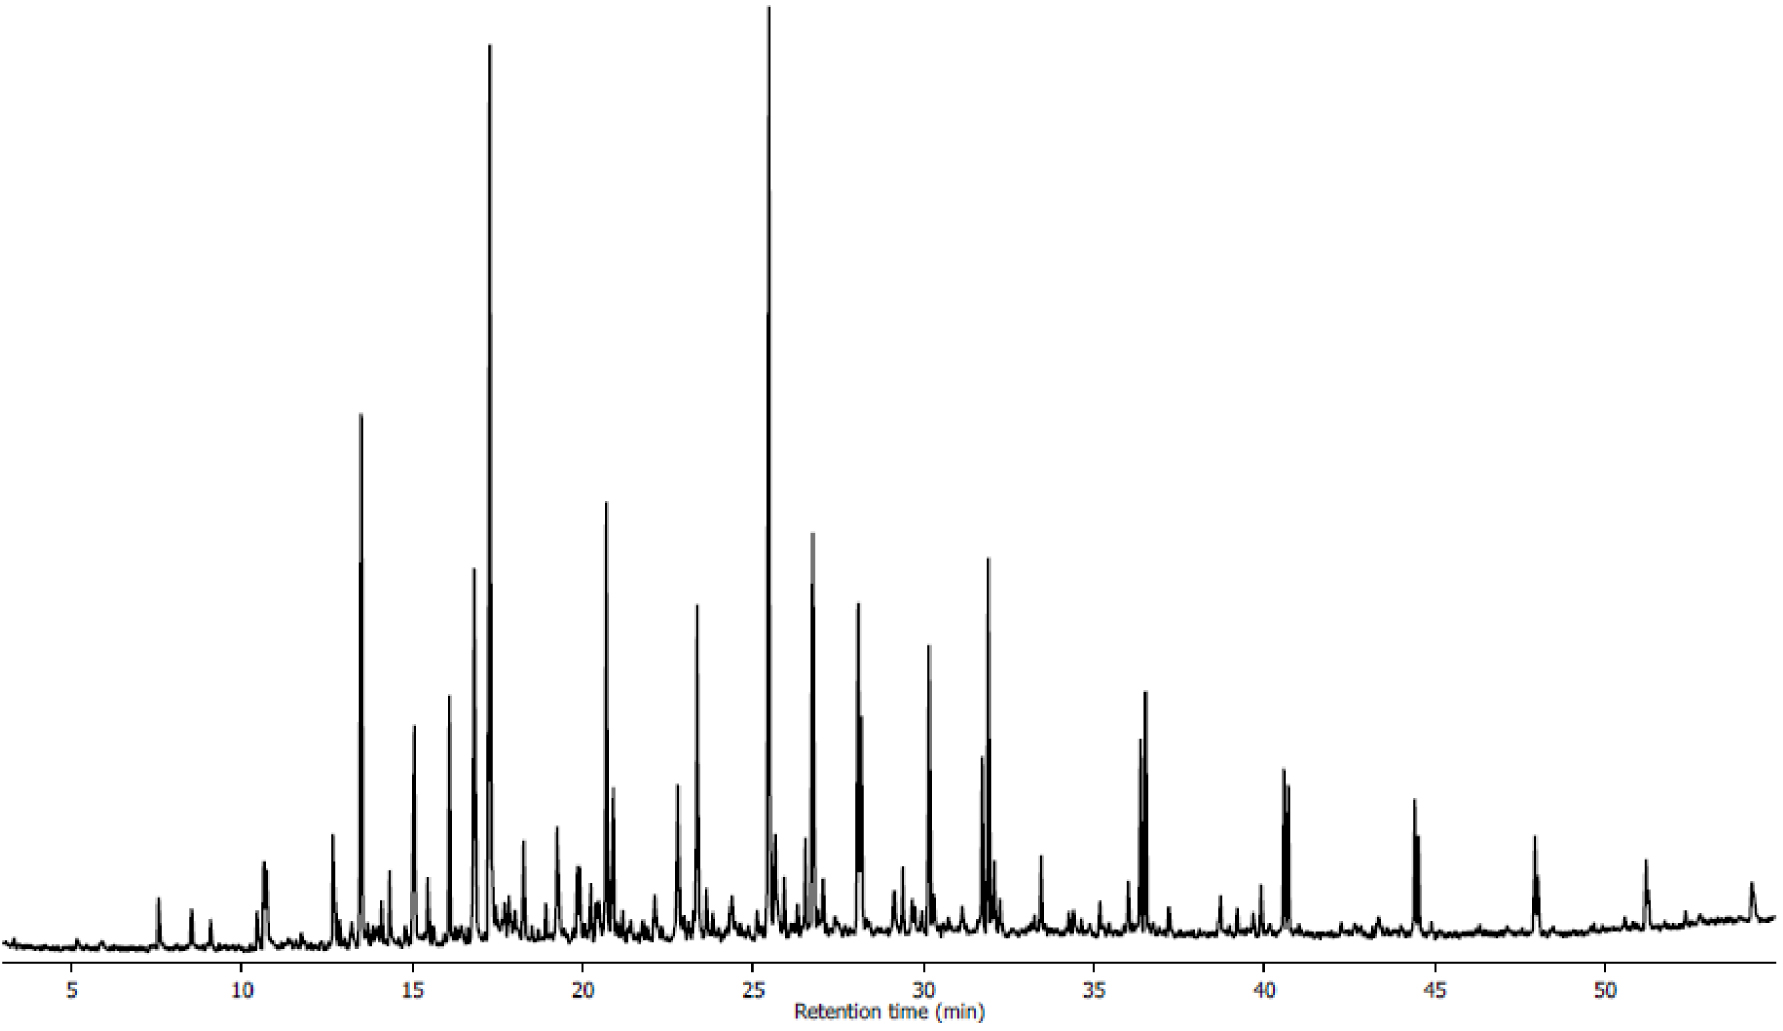
Chemical constituents of bio-oil identified by GC–MS
| No | Retention time (min) | Compounds | Area (%) | Molecular formula |
|---|---|---|---|---|
| 1 | 10.637 | 1-(3H-Imidazol-4-yl)-ethanone | 0.82 | C5H6N2O |
| 2 | 10.708 | 2(5H)-Furanone | 0.89 | C4H4O2 |
| 3 | 12.670 | 3-Oxabicyclo[3.3.0]oct-7-en-2-one, 7-methoxy- | 1.04 | C8H10O3 |
| 4 | 13.495 | Phenol | 5.8 | C6H6O |
| 5 | 14.325 | 2-Furanmethanol, tetrahydro- | 0.78 | C5H6O2 |
| 6 | 15.054 | 1,2-Cyclopentanedione, 3-methyl- | 3.44 | C6H8O2 |
| 7 | 15.444 | 2-Cyclopenten-1-one, 2,3-dimethyl- | 0.77 | C6H10O |
| 8 | 16.087 | Phenol, 2-methyl- | 2.27 | C7H8O2 |
| 9 | 16.812 | p-Cresol | 5.94 | C7H8O |
| 10 | 17.265 | Phenol, 2-methoxy- | 11.11 | C7H8O2 |
| 11 | 18.261 | 2-Cyclopenten-1-one, 3-ethyl-2-hydroxy- | 1.37 | C7H10O2 |
| 12 | 19.240 | Phenol, 2,4-dimethyl- | 2.09 | C8H10O |
| 13 | 19.836 | Phenol, 4-ethyl- | 0.79 | C8H10O |
| 14 | 19.906 | Phenol, 3,5-dimethyl- | 0.82 | C8H10O |
| 15 | 20.231 | Phenol, 2-methoxy-3-methyl- | 0.87 | C8H10O2 |
| 16 | 20.690 | Creosol | 4.6 | C8H10O2 |
| 17 | 20.894 | Dodecane | 2.12 | C12H26 |
| 18 | 22.111 | 2,3-Dimethoxytoluene | 0.81 | C9H12O2 |
| 19 | 22.784 | 1,2-Benzenediol, 3-methoxy- | 2.47 | C7H8O |
| 20 | 23.352 | Phenol, 4-ethyl-2-methoxy- | 3.87 | C9H12O2 |
| 21 | 23.617 | 1,2-Benzenediol, 4-methyl- | 0.8 | C7H8O2 |
| 22 | 25.454 | Phenol, 2,6-dimethoxy- | 9.85 | C8H10O3 |
| 23 | 25.638 | 3-Allyl-6-methoxyphenol | 1.89 | C10H12O2 |
| 24 | 25.911 | Phenol, 2-methoxy-4-propyl- | 0.74 | C10H14O2 |
| 25 | 26.523 | 1-Pentadecene | 1.06 | C15H30 |
| 26 | 26.743 | Tetradecane | 4.41 | C14H30 |
| 27 | 28.078 | 1,2,3-Trimethoxybenzene | 3.35 | C9H12O3 |
| 28 | 28.169 | trans-Isoeugenol | 2.42 | C10H12O2 |
| 29 | 29.135 | Apocynin | 1.03 | C9H10O3 |
| 30 | 29.385 | Pentadecane | 0.81 | C15H32 |
| 31 | 30.155 | 5-tert-Butylpyrogallol | 2.92 | C10H14O3 |
| 32 | 30.296 | (+)-s-2-Phenethanamine, 1-methyl-N-vanillyl- | 0.83 | C17H21NO2 |
| 33 | 31.130 | 3′,5′-Dimethoxyacetophenone | 0.78 | C10H12O3 |
| 34 | 31.713 | E-14-Hexadecenal | 2.05 | C16H30O |
| 35 | 31.896 | Hexadecane | 3.4 | C16H34 |
| 36 | 32.074 | Phenol, 2,6-dimethoxy-4-(2-propenyl)- | 0.93 | C11H14O3 |
| 37 | 32.243 | 2,4-Hexadienedioic acid, 3,4-diethyl-, dimethyl ester, (Z,Z)- | 0.8 | C12H18O4 |
| 38 | 33.444 | Benzaldehyde, 4-hydroxy-3,5-dimethoxy- | 1.12 | C9H10O4 |
| 39 | 36.010 | 3,5-Dimethoxy-4-hydroxyphenylacetic acid | 0.77 | C10H12O5 |
| 40 | 36.363 | n-Nonadecanol-1 | 2.02 | C19H40O |
| 41 | 36.511 | Octadecane | 2.28 | C18H38 |
| 42 | 40.570 | Behenic alcohol | 1.61 | C22H46O |
| 43 | 40.694 | Heneicosane | 1.46 | C21H44 |
3.3.3. Thermal behavior
To evaluate the volatility of the bio-oil, thermogravimetric analysis was performed at 500 °C with a 100 °C⋅min−1 heating rate and 100 mL⋅min−1 of N2. Figure 9 and Table 5 show the results of the TG/DTG analysis. Boiling point distribution was interpreted according to Speight’s terminology and classification of petroleum products [53]. During evaporation, the bio-oil is mainly composed of a medium naphtha fraction (38.66%) and gasoil (20.32%). We observe that the boiling point fractions (b.p. > 343 °C) represent 33.93% of the bio-oil composition. On the other hand, the bio-oil has a low percentage of components with low boiling point (7.09%). This observation could be due to the process used to obtain bio-oil: molecules with low boiling point are evaporated together with ethylacetate, which is detected by GC–MS analysis of bio-oil before and after evaporation [54]. A TG analysis can provide insight into the distillation potential of bio-oil, but further upgrading steps are needed as much based on the chemical nature of the molecules as on the boiling points.
TGA/DTG curve of the bio-oil produced by intermediate pyrolysis of Ficus wood.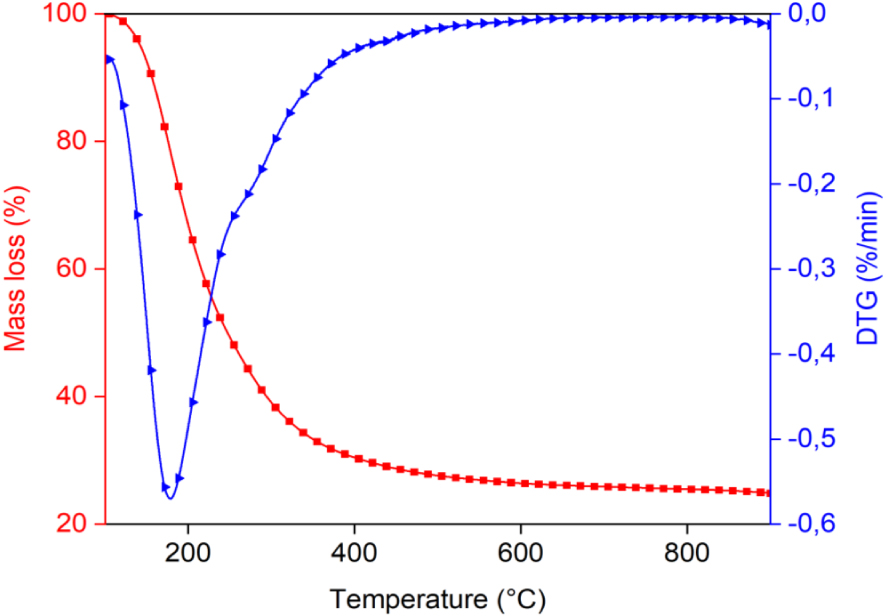
Boiling-point distribution of the bio-oil obtained by TGA
| Temperature (°C) | % evaporated | |
|---|---|---|
| Light naphtha | <149 | 7.09 (100 − 92.91) |
| Medium naphtha | 149–232 | 38.66 (92.91 − 54.25) |
| Gas oil | 232–343 | 20.32 (54.25 − 33.93) |
| Light vacium gas oil LVGO | 343–371 | 2.05 (33.93 − 31.88) |
| Heavy vacium gas oil HVGO | 371–566 | 5.13 (31.88 − 26.75) |
| Residium | >566 | 26.75 |
3.4. Characterization of biochar
3.4.1. Chemical characteristics
The proximate analysis of the produced biochar is summarized in Table 6. The moisture, volatile compounds, fixed-carbon and ash contents can be derived from the mass loss of the carbonaceous samples over the thermogravimetric analysis. The volatile matter fraction of the biochar was found to decline compared to that found in the raw materials. The reduction in volatile content results from the removal of more volatiles as the temperature increases during pyrolysis. Comparing the C, H, O, and N contents of biochar and its biomass, it seems that bio-char becomes carbonaceous as the carbon content in bio-char is higher than that of the raw material. It is also observed that a significant variation occurs in C and O content as well as slight variation occurs in H content between wood and biochar. This demonstrates the expulsion of oxygen and volatile components from wood during pyrolysis, which enhances the fixed carbon in biochar. HHV of biochar is 28.75 MJ/kg, which is higher than the original biomass.
Proximate, ultimate analyses and physical characteristics of bio-char
| Characteristics | Raw wood | Bio-char | |
|---|---|---|---|
| Proximate analysis (wt%) | Moisture content | 5.38 | 6.64 |
| Volatile matter | 68.75 | 30.86 | |
| Ash | 14.4 | 28.30 | |
| Fixed carbon | 16.85 | 40.84 | |
| Ultimate analysis (wt%) | Carbon | 43.55 | 55.46 |
| Hydrogen | 5.76 | 5.51 | |
| Nitrogen | 0.68 | 1.48 | |
| Sulfur | – | – | |
| Oxygen | 50.01 | 37.55 | |
| Fiber analysis (wt%) | Extractive | 5.33 | – |
| Hemicellulose | 31.78 | – | |
| Cellulose | 41.09 | – | |
| Lignin | 21.80 | – | |
| H/C molar ratio | 1.587 | 1.237 | |
| O/C molar ratio | 0.861 | 0.508 | |
| Empirical formula | CH1.587O0.861N0.013 | CH1.237O0.508N0.023 | |
| Higher heating value (MJ⋅kg−1) | 16.82 | 28.75 | |
| Surface characteristics BET surface (m2⋅g−1) |
4.17 | 48.85 | |
The FT-IR spectrum of biochar produced at 500 °C is given in Figure 10. Significant changes in the FT-IR spectrum are observed compared to the raw materials. The O–H stretching vibration band at 3335 cm−1 has almost disappeared for biochar showing that the oxygen was removed from raw material during pyrolysis. This oxygen removal causes the phenolic and aromatic structures cracking and therefore produces carbonaceous solid products. The bands attributed to C–H alkyl functional groups at 2860–2970 cm−1 is almost missing in bio-char. There were also drastic changes in the aliphatic and polysaccharide band intensities of raw wood and their bio-char, which provide further evidence of organic decompositions during the pyrolysis process. For example, a disappearance in band absorbance intensity at 1000 cm−1 to 1100 cm1 (carbohydrates bands) and 2850 cm−1 to 2920 cm−1 (aliphatic compounds) can be seen from Figure 8. This behavior may be attributed to dehydration during the pyrolysis process [55]. Additionally, bands at 890 cm−1 to 700 cm−1, corresponding to aromatic C–H bends, were observed in chars but not in raw wood, suggesting that biochar possesses aromatic structure. The olefinic ν(C=C) functional groups (i.e., the band at 1640 cm−1 for the raw wood) disappear while the skeletal C=C vibrations in aromatic rings (which correspond to the bands at 1586 cm−1) are intensified. It is apparent from the bio-char spectrum that there is a number of oxygenated functional groups, as well as aromatic carbon functional groups. A strong peak at 1408 cm−1 correlates with aromatic C–H stretching [56], while 875 cm−1 represents aromatic C–O functional groups. Aromatic C–O and phenolic O–H functional groups are visible in a broad band between 1115 and 1215 cm−1.
FTIR spectrum of bio-char from Ficus wood obtained at 500 °C for 10 °C⋅min−1 and 100 mL⋅min−1 of N2.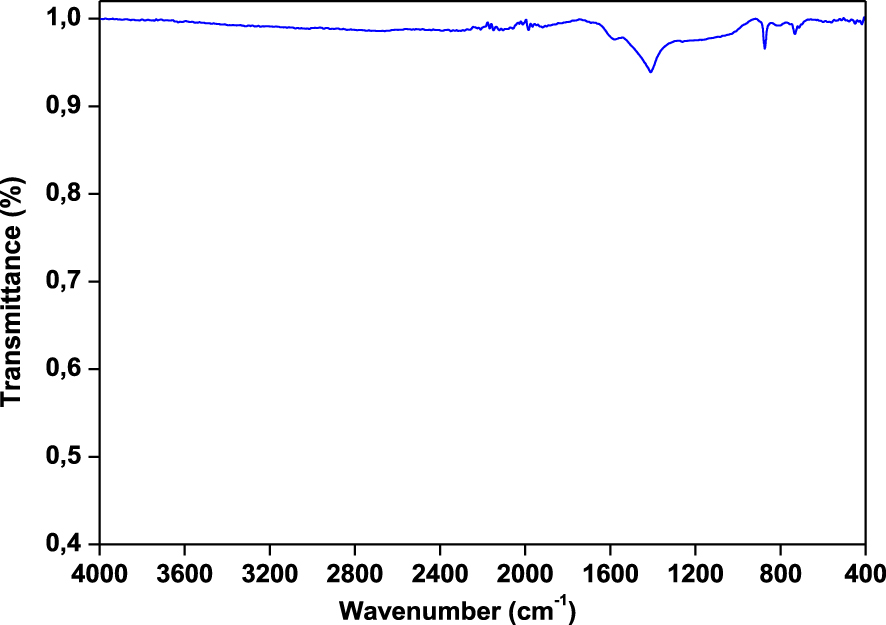
3.4.2. Textural properties
The results of the BET surface analysis are given in Table 6. As expected, raw wood has low surface areas of 4.17 m2⋅g−1. After applying thermal treatment, the resulting product reached a higher specific surface area of 48.85 m2⋅g−1. Further pyrolysis process increases volatilities of organic compounds and creates more pores which contribute to a larger surface area.
3.4.3. Surface morphology SEM
Figure 11 presents the SEM pictures of raw wood and its derived biochar. The surface of raw wood as showed in Figure 11 was smooth without any ridges or pores. Nevertheless, after the pyrolysis process, many well-defined pores were created which might be caused by devolatilization of organic compounds. Consequently, more void space and higher porosity are detectable on the biochar surface.
SEM micrograph of (a) the Ficus wood and (b) the biochar obtained at 500 °C for 10 °C⋅min−1 and 100 mL⋅min−1 of N2.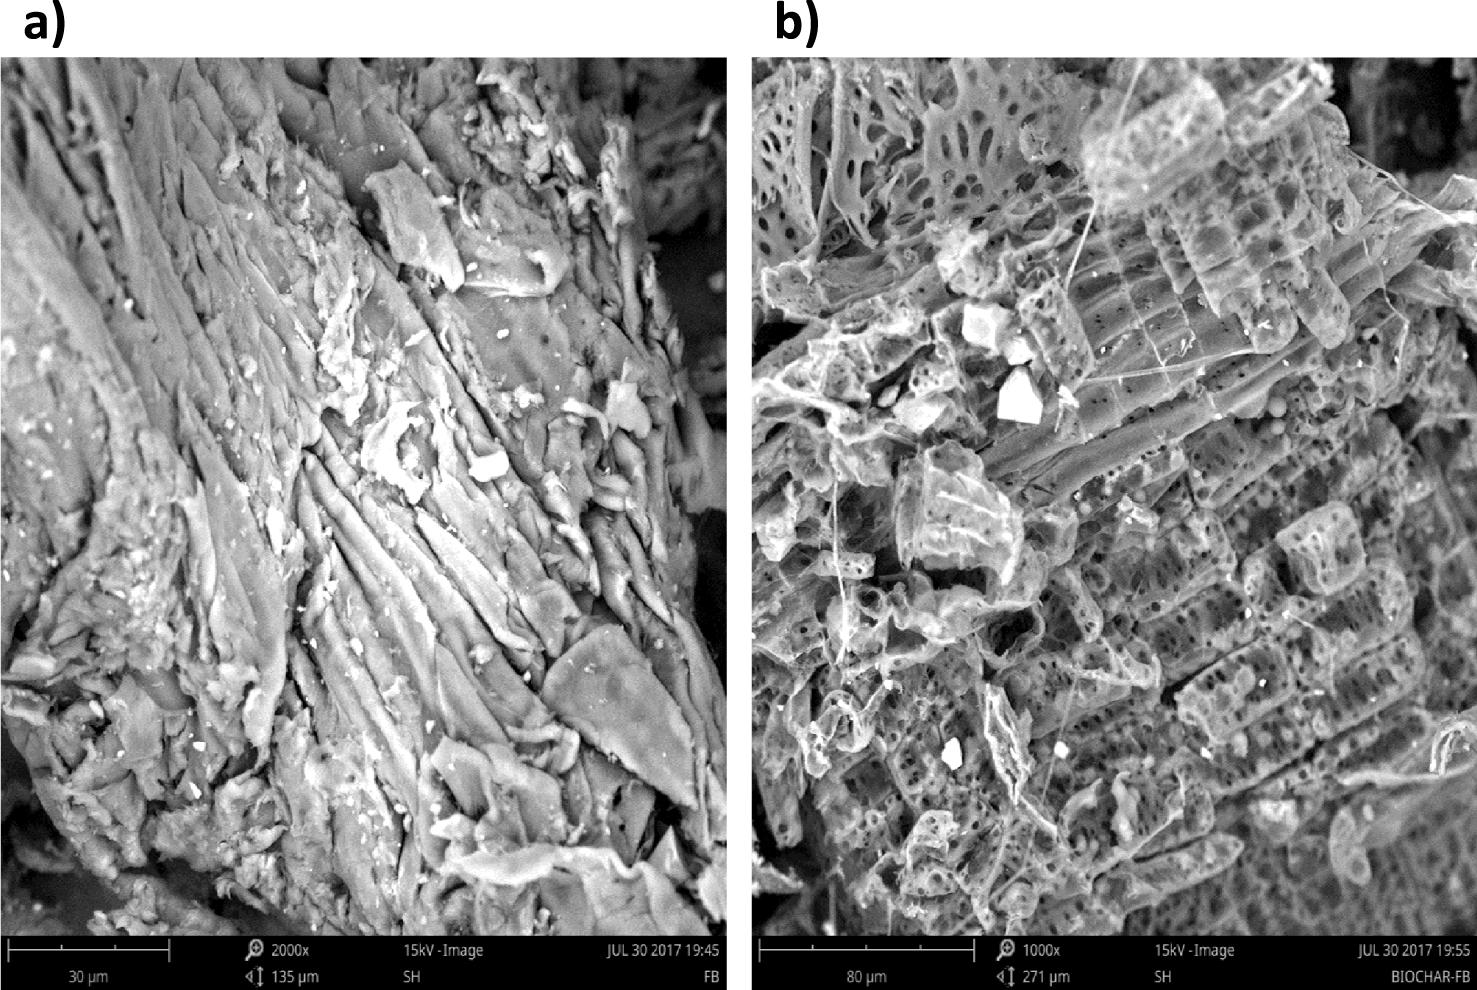
4. Conclusion
The Ficus nitida wood is excellent feedstock for energy production and value-added products as bio-oil and bio-char. It stores a large amount of energy which can be converted to bio-oil, bio-char and syngas. The present study is focused on the intermediate pyrolysis in a fixed-bed reactor and investigated the effects of pyrolysis operating parameters on the products yield. The pyrolysis tests of Ficus nitida wood were carried out at different temperatures of (350, 400, 450, 500, 550 and 600 °C) with different heating rates (20, 50, 80 and 100 °C⋅min−1) under N2 gas flow rates of 50, 100, 200, 400, 800 mL⋅min−1. The results show that the maximum bio-oil yield was obtained at the temperature of 500 °C, heating rate of 100 °C⋅min−1 and N2 gas flow rate of 100 mL⋅min−1. The yields of bio-oil, bio-char and gas were 41.85%, 28.88% and 29.27%, respectively. Chromatographic and spectroscopic characterization of the bio-oil showed that the Ficus wood pyrolysis could be suitable for energetic applications as renewable fuel production and/or chemical feedstock. The physical and chemical properties of bio-char showed that the bio-char produced from Ficus wood has the potential to be new and tenable material for fuel applications precursor for active carbon production processes.
Declaration of interests
The authors do not work for, advise, own shares in, or receive funds from any organization that could benefit from this article, and have declared no affiliations other than their research organizations.
Acknowledgments
This work was carried out as a collaboration between Sultan Moulay Slimane University (Faculty of Polydisciplinary-Beni Mellal, Morocco), Institute Mines Telecom IMT Atlantique-Nantes, France, and University of Haute-Alsace-Mulhouse (CNRS, France) in the framework of the PHC Maghreb project 2020 (43871WB).