


 CC-BY 4.0
1. Introduction
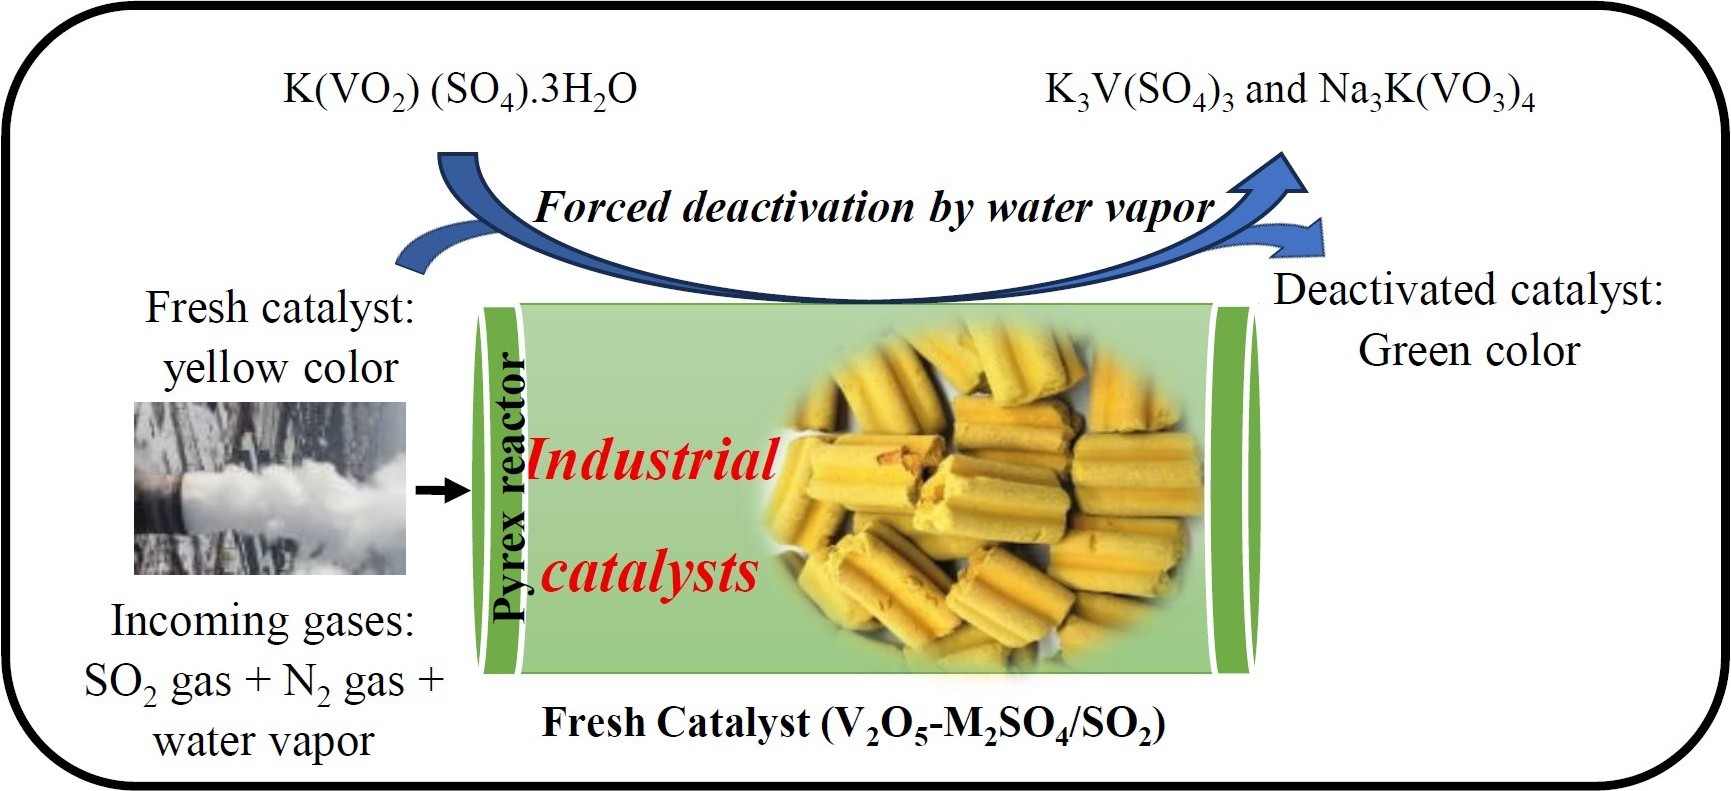
Sulfuric acid is, thus far, one of the most widely used mineral products across various fields, particularly in the chemical industry for the production of phosphoric acid and fertilizers. The manufacturing process of sulfuric acid relies on three main steps: (1) the combustion of liquid sulfur, (2) the oxidation of sulfur dioxide to sulfur trioxide, and (3) the absorption of SO3 with water to form H2SO4. The conversion reaction from SO2 to SO3, also known as the contact process [1, 2], is a crucial step in sulfuric acid production. Its very high activation energy leads to a slow reaction rate and low conversion efficiency; therefore, catalysts are required to lower the energy barrier. The vanadium-based catalyst used is deposited on a silica or alumina support to increase the contact effect with the substrate, and it is mixed with alkaline promoters typically potassium, sodium, and/or cesium [3]. During the oxidation of SO2 to SO3, the vanadium-based catalyst becomes active at around 420 °C [4] and operates according to a redox cycle mechanism [2, 5] as illustrated by the following equation:
| \begin {eqnarray*} &{\mathrm {V}}_{2} {\mathrm {O}}_{5} + {\mathrm {SO}}_{2} \leftrightarrow \mathrm {V}_{2} {\mathrm {O}}_{4} + {\mathrm {SO}}_3&\\ &{\mathrm {V}}_{2} {\mathrm {O}}_{4} + 1/2\, {\mathrm {O}}_{2} \leftrightarrow {\mathrm {V}}_{2} {\mathrm {O}}_{5}& \end {eqnarray*} |
The primary issues with the catalyst during multiple cycles of SO2 to SO3 oxidation eventually lead to a decrease in its activity, indicating deactivation and/or aging of the catalyst. In addition, there is a gradual increase in pressure due to high operating temperatures and the dust carried by the gases as well as surface poisoning and pore blockage. To restore the catalyst’s activity, regeneration processes can be applied; however, in some cases, the catalyst must be replaced with a new one. Deactivated catalysts are classified as hazardous waste [6].
Several studies have investigated the thermal deactivation of vanadium-based catalysts used in the SO2 oxidation reaction [7, 8, 9, 10]. Lapina et al. [7] studied the influence of reagents on SO2 conversion and reported that the deactivation is partly attributed to structural changes in both the support and the active phase, leading to the formation of new non-active phases, particularly vanadyl sulfates.
Akola et al. [11] investigated catalyst deactivation caused by fine particle formation, which occurs more rapidly with decreasing vanadium content in the catalyst accompanied by structural changes and the formation of sulfated compounds. Grobela and Grzesiak [12] reported additional noteworthy findings, explaining that the presence of iron oxide in the active phase of the catalyst promotes the oxidation of SO2 to SO3 at temperatures above 600 °C, whereas iron sulfate contributes to catalytic deactivation and may even lead to an increase in temperature.
The aim of this study is to investigate the accelerated deactivation of industrial catalysts by water vapor in the shortest possible time in order to gain a deeper understanding of the mechanism. The deactivated catalysts were characterized using various techniques such as X-ray fluorescence (XRF), X-ray diffraction (XRD), and Fourier transform infrared (FTIR) spectroscopy. Their catalytic performance was subsequently evaluated through catalytic testing to assess the effect of water vapor on activity.
2. Materials and methods
2.1. Materials
The study was carried out using commercial vanadium-based catalysts supplied by MECS (USA). These catalysts are manufactured in different geometric shapes, the most common being extrudates, rings, and stars (Figure 1) [13]. Figure 2 illustrates the physical appearance of fresh and deactivated catalysts: the fresh catalyst exhibits a yellow color, whereas the deactivated catalyst appears green. This color change is attributed to structural modifications induced during the accelerated deactivation treatment.
Differently shaped catalysts proposed by MECS (USA): (a) extruded, (b) rings, and (c) stars.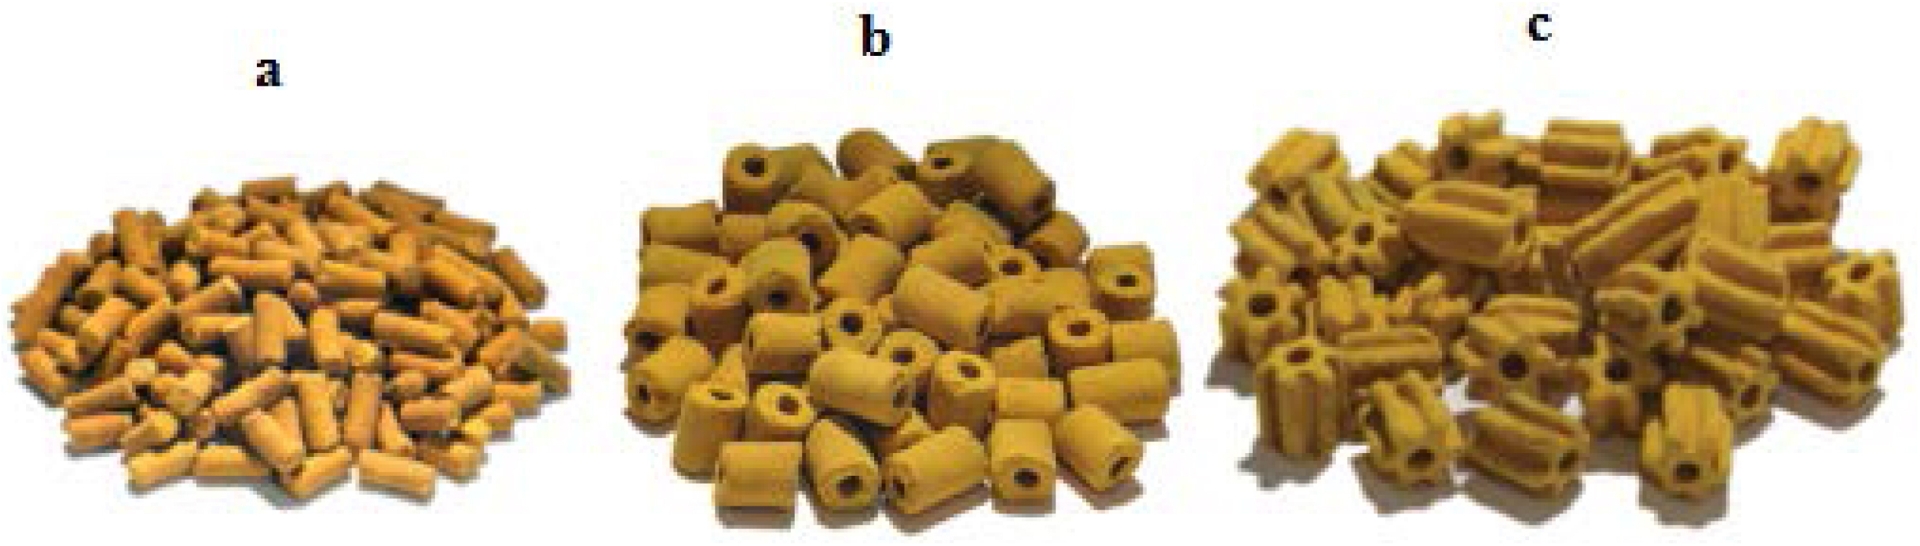
(A) Fresh catalyst and (B) deactivated catalyst.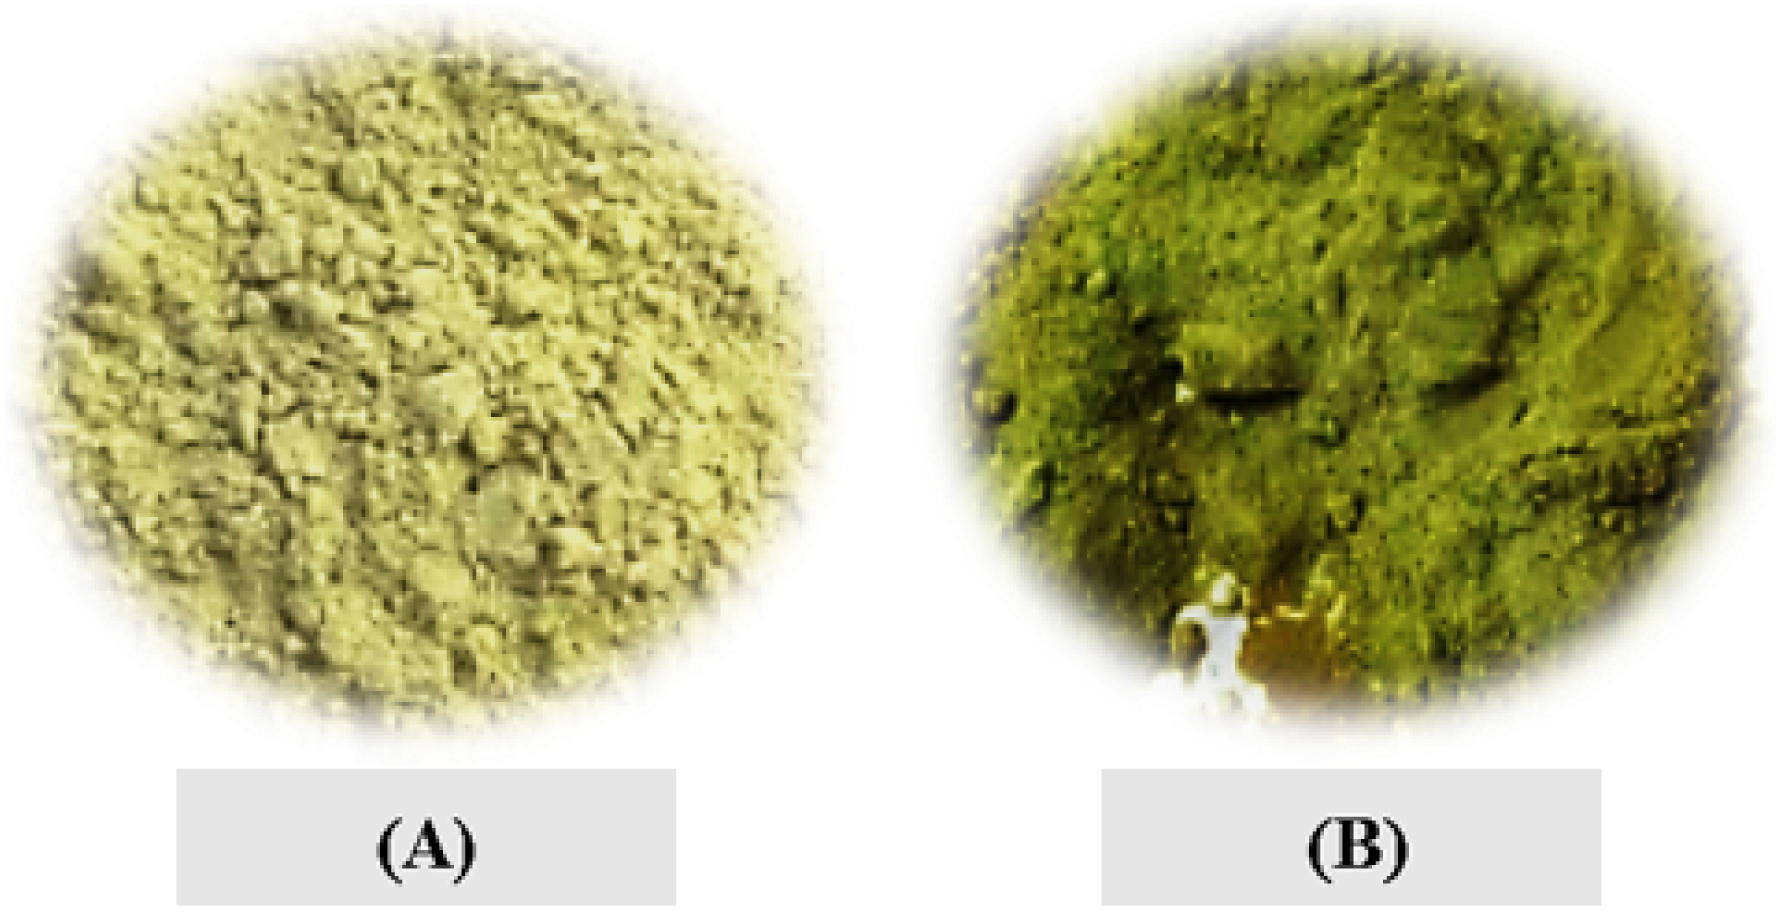
2.2. Leaching process
The fresh catalyst was ground in a porcelain mortar, and 300 mg of the resulting powder was weighed and introduced into a tubular glass reactor equipped with two inlets (Inlet 1: SO2; Inlet 2: steam + N2) and a glass frit to support the catalyst. The reactor fitted with a thermowell containing a thermocouple was placed as close as possible to the catalyst for precise temperature monitoring. The tubular furnace was connected to a temperature controller to regulate the reaction temperature. At the furnace inlet, steam was generated using a bubbler filled with water maintained at 80 °C in a thermostatic bath. This steam was carried by nitrogen, with the steam circuit being surrounded by a heating cord to prevent condensation. The resulting steam, mixed with SO2, passed through the catalyst bed at 350 °C for varying time periods. The outlet gases were directed through a bubbler before being released (Figure 3).
Accelerated deactivation in a steam and SO2 deactivation setup.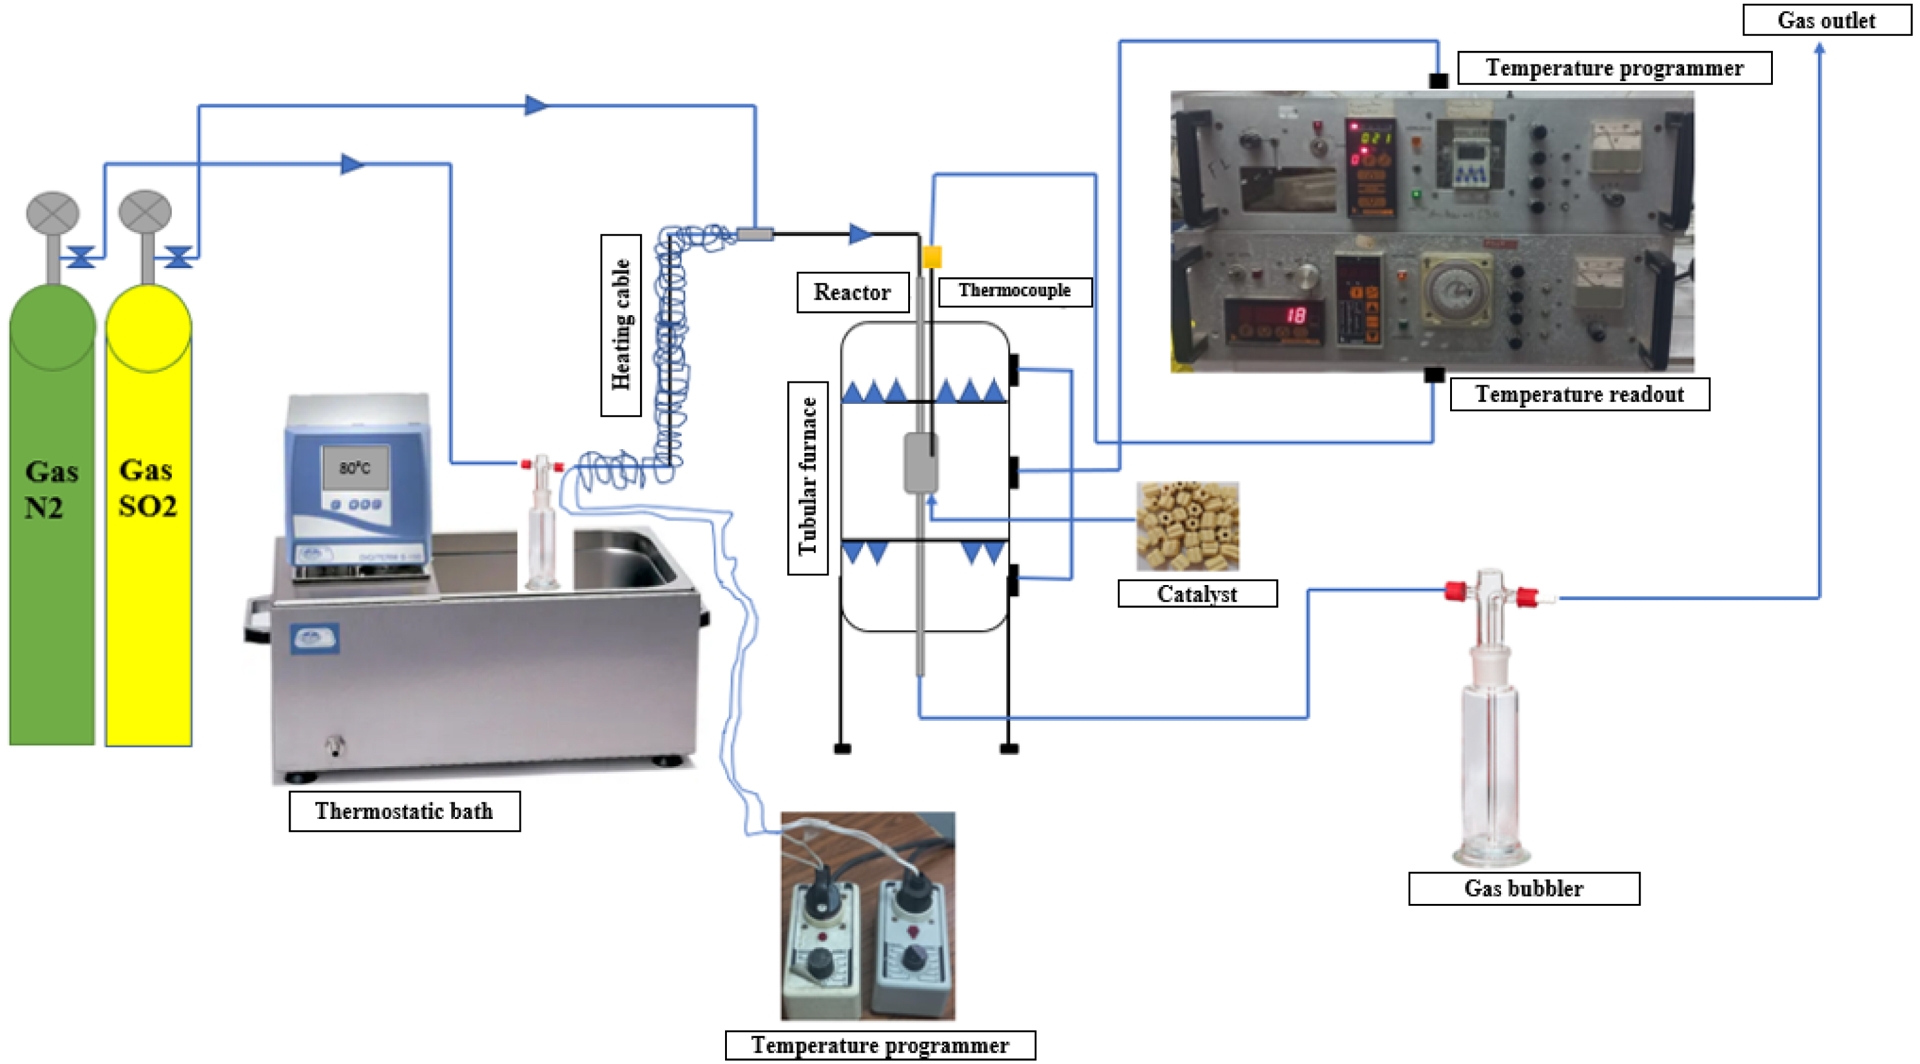
2.3. Characterization techniques
The chemical composition of fresh, spent, and deactivated industrial catalyst was determined by XRF analysis using a Bruker AXS S2 Puma EDXRF spectrometer equipped with a silver anticathode. The crystalline phases were then identified by XRD, using a Bruker Advance diffractometer with a Cu-K𝛼 radiation source (𝜆 = 1.5418 Å). Finally, FTIR spectroscopy was employed to investigate the surface chemistry of the catalysts and to confirm the phases identified by XRD. Infrared transmission spectra were recorded on a Nicolet Impact 400D spectrometer in the range of 500 to 4000 cm−1.
2.4. Experimental conditions
The forced deactivation of the catalysts was carried out by exposing them to a mixture of SO2 and H2O vapors at different ratios to simulate the conditions under which catalysts are exposed to sulfur compounds and to better understand the deactivation process. The poisoning treatments consisted of exposing the fresh catalyst to a reaction mixture of SO2 and steam at a temperature below that of the SO2 to SO3 oxidation reaction (approximately 350 °C). The operating conditions applied for the deactivation experiments are summarized in Table 1.
The operating conditions for catalyst deactivation
| Designation | Reaction temperature (°C) | N2 flow rate (mL/min) | SO2 flow rate (mL/min) | SO2/N2 ratio | Reaction time (h) |
|---|---|---|---|---|---|
| Deactivated catalyst | 350 | 71 | 60 | 0.85 | 2 |
| Deactivated catalyst | 350 | 26 | 43 | 1.65 | 4 |
2.5. Iodometric determination
The catalytic performance of both fresh and deactivated catalysts was evaluated under simulated industrial conditions, reproducing those of the sulfuric acid production units at Jorf Lasfar. The evaluation was based on an iodometric back-titration method, which enables the quantification of unconverted SO2 and thus the determination of the catalytic conversion rate. In this approach, the outlet gas stream was passed through a 0.1 mol⋅L−1 iodine solution, where SO2 reacts with iodine to form sulfate ions ($\mathrm{SO}_2+ \mathrm{I}_2+ 2\mathrm{H}_2\mathrm{O} \rightarrow \mathrm{SO}_4^{2-} + 4\mathrm{H}^{+} + 2\mathrm{I}^{-}$) [14]. The residual iodine was subsequently titrated with a standardized 0.1 mol⋅L−1 sodium thiosulfate solution according to the following half-equations: I2 (aq) + 2e−→2I− (aq) and $2\mathrm{S}_2\mathrm{O}_3^{2-}\ (\mathrm{aq}) \rightarrow \mathrm{S}_4\mathrm{O}_{6}^{2-}\ (\mathrm{aq}) + 2\mathrm{e}^{-}$, which combine to give the overall reaction $\mathrm{I}_2\ (\mathrm{aq}) + 2\mathrm{S}_2\mathrm{O}_3^{2-}\ (\mathrm{aq}) \rightarrow \mathrm{S}_4 \mathrm{O}_{6}^{2-}\ (\mathrm{aq}) + 2\mathrm{I}^{-}\ (\mathrm{aq})$. Based on these stoichiometric relations, the amount of unconverted SO2 was calculated using the expression n(SO2)unreacted = n(I2)initial − n(I2)titrated. The catalytic tests were performed using 300 mg of catalyst at a reaction temperature of 450 °C, with both iodine and sodium thiosulfate solutions standardized at 0.1 mol⋅L−1.
3. Results and discussion
3.1. Characterization of fresh, spent, and deactivated catalysts
The XRF analysis provided insights into the evolution of the chemical composition of the catalysts after forced deactivation. The results (Table 2) revealed an average increase of 24% in the concentrations of iron (Fe), calcium (Ca), potassium (K), sulfur (S), and vanadium (V) in the active phases. This indicates a change in the percentage composition of the catalyst after deactivation, mainly due to the increase in sulfur (S) content among these elements in the catalyst residues following deactivation. In contrast, the concentration of these elements increased in the active catalyst residues after deactivation. The silicon (Si) content decreased by 18%, indicating possible degradation or loss of this component during the deactivation process (Table 2). The deactivated catalysts exhibit a high content of potassium, sodium, and sulfur, which react with vanadium to form compounds such as K3V(SO4)3 and Na3K(VO3)4. This involves the reduction of V5+ present in the fresh catalyst phase K(VO2) (SO4)⋅3H2O [15] to V3+. Silica is also identified in the deactivated catalyst, as evidenced by the XRD patterns showing characteristic peaks (index no. 2), although a large portion remains in the amorphous phase (Figure 4). At temperatures between 205 °C and 370 °C, SO3 vapors react with water vapors to form H2SO4 aerosols. These aerosols can condense or deposit on the catalyst surface, initiating reactions that alter both the phases and the physicochemical properties of the catalyst [16]. Such modifications are primarily responsible for catalyst deactivation [11]. Furthermore, it was observed that when the SO2/N2 ratio decreases relative to the catalytic activity, the presence of additional water molecules promotes catalyst degradation, leading to the formation of inactive species such as V3+.
Chemical composition of fresh, spent, and deactivated catalysts, at different ratios, analyzed by XRF
| Item description | Fe2O3 | CaO | K2O | SO3 | SiO2 | V2O5 |
|---|---|---|---|---|---|---|
| Fresh catalyst (%) | 1.8 | 0.50 | 13.78 | 21.11 | 52.32 | 8.48 |
| Spent catalyst (%) | 1.18 | 0.13 | 8.76 | 19.40 | 65.23 | 4.40 |
| Deactivated catalyst (SO2/N2) = 1.66 | 1.94 | 0.49 | 16.02 | 28.32 | 43.60 | 9.64 |
| Deactivated catalyst (SO2/N2) = 0.85 | 2.12 | 0.68 | 17.12 | 27.07 | 42.62 | 10.38 |
X-ray diffraction patterns of the fresh catalyst (D), the spent catalyst (C), and deactivated catalyst obtained in SO2/N2 ratios of 0.85 (B) and 1.66 (A).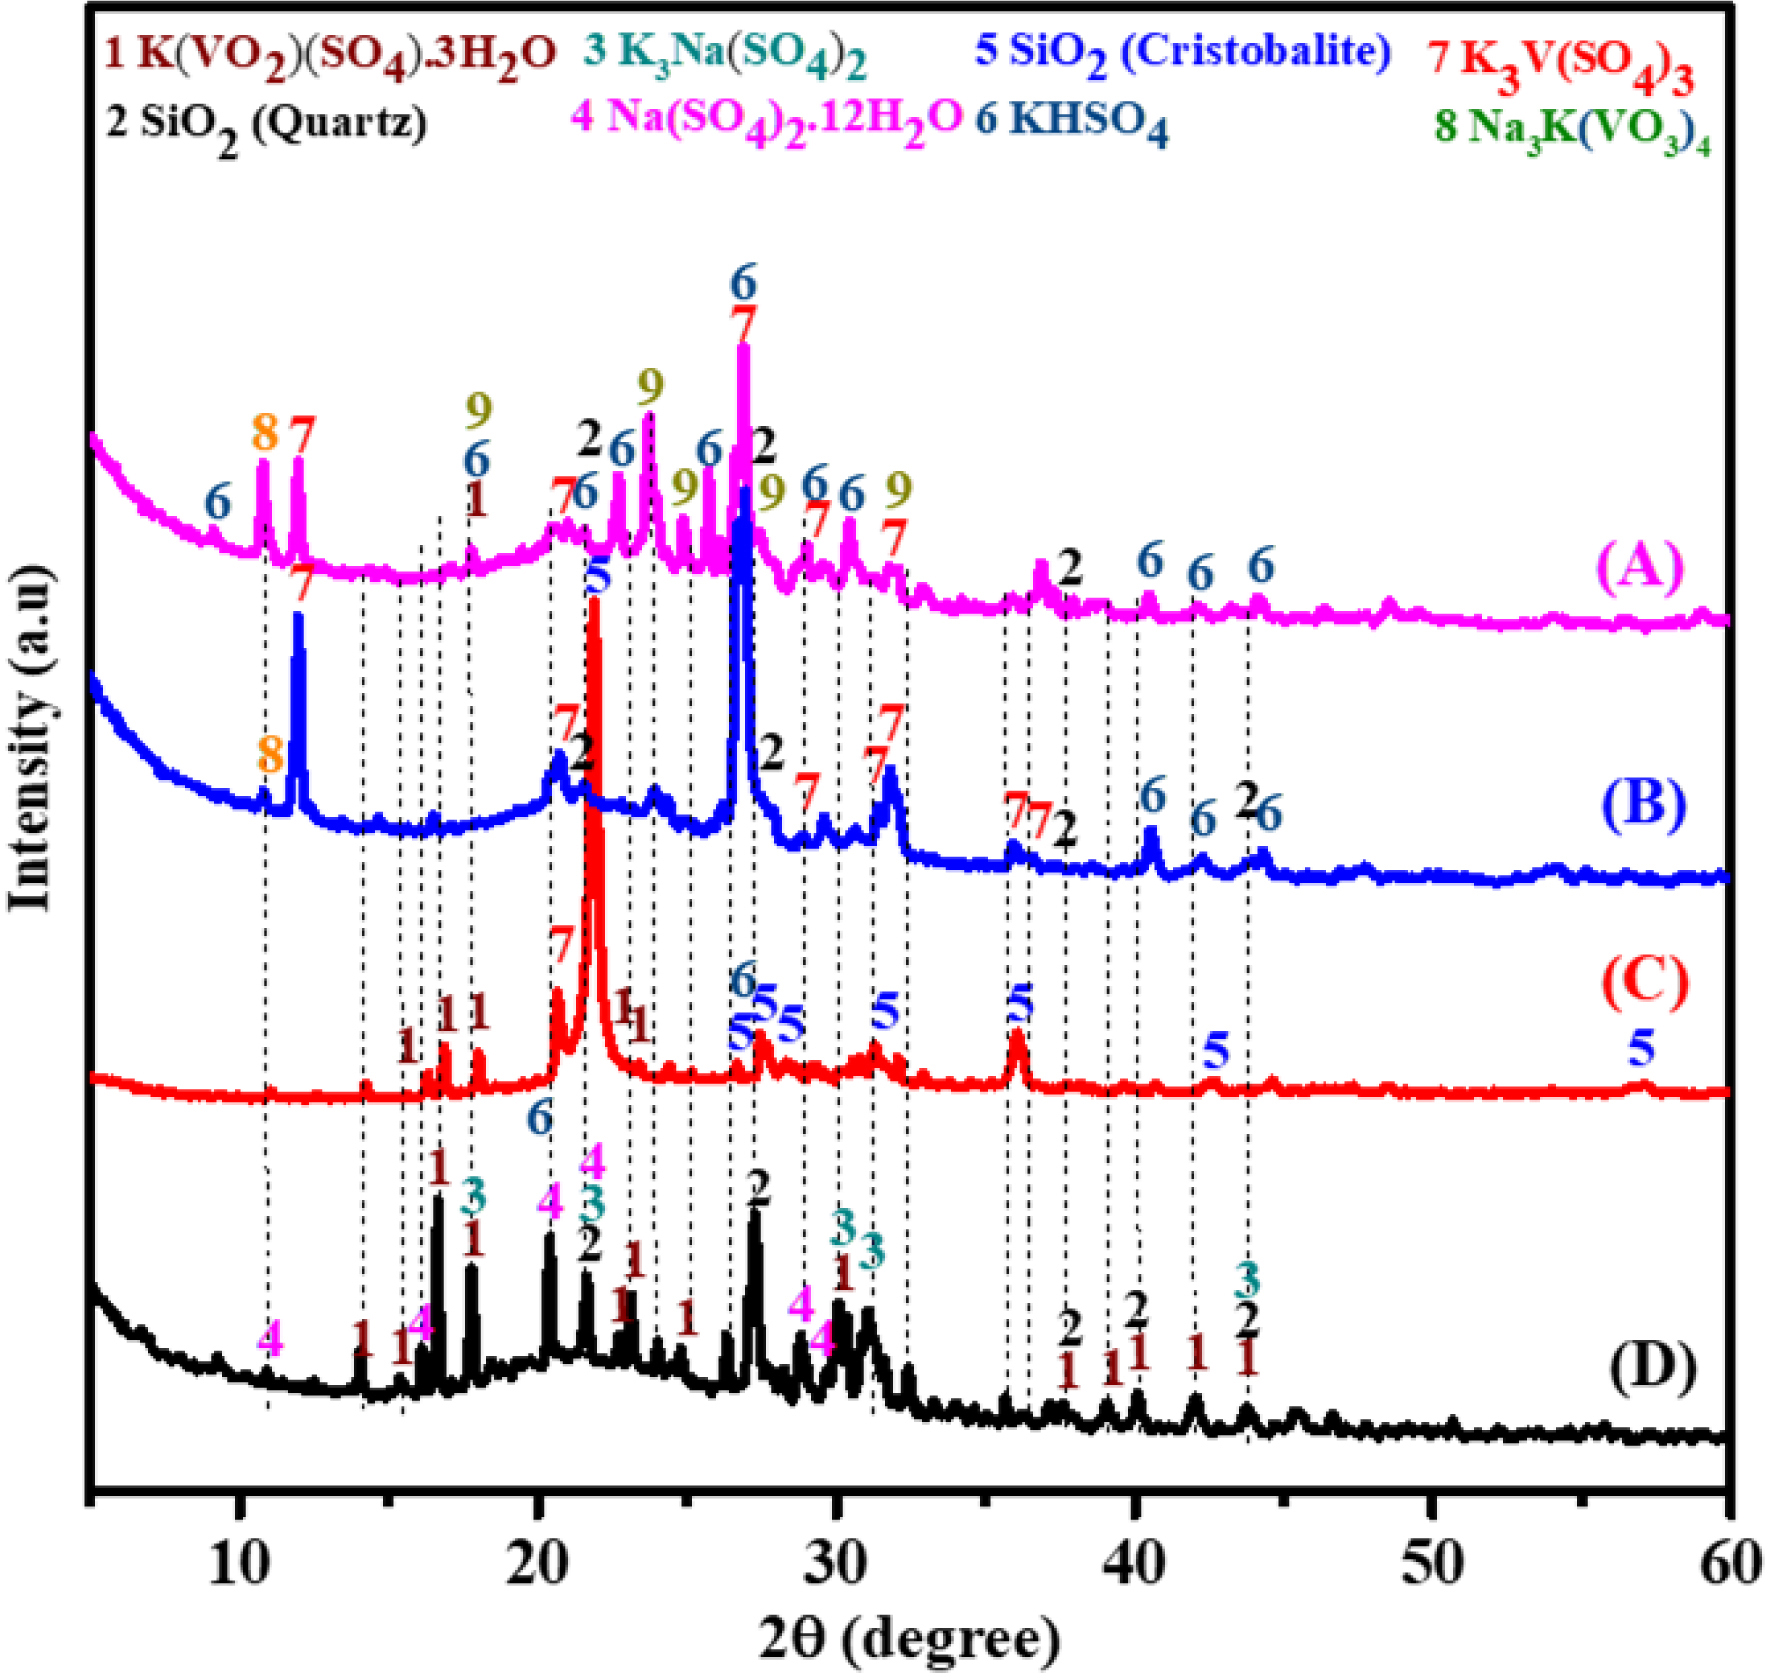
The FTIR spectroscopy was employed to analyze the catalyst samples, providing detailed information on the chemical bonds and molecular vibrations present (Figure 5). As shown in Table 3, the planar rotations of V–O–V bonds observed at 550 and 670 cm−1 are characteristic of vanadium-containing compounds [17, 18, 19], reflecting specific interactions between vanadium and oxygen atoms within the crystal lattice. The band around 798 cm−1 corresponds to asymmetric V–O–V stretching vibrations [11]. A band near 874 cm−1, also attributed to V–O–V vibrations [20], together with the band at 900 cm−1, assigned to V–O–S vibrations, confirms the presence of vanadium–oxygen complexes. The band observed at 933 cm−1 indicates Si–O–V interactions [21] while the band at 975 cm−1, assigned to V=O stretching of polymerized vanadate species [22], suggests polymerization of vanadium compounds within the catalyst.
FTIR spectra of the fresh catalyst (D), the spent catalyst (C), and the deactivated catalyst obtained in SO2/N2 ratios of 0.85 (B) and 1.66 (A).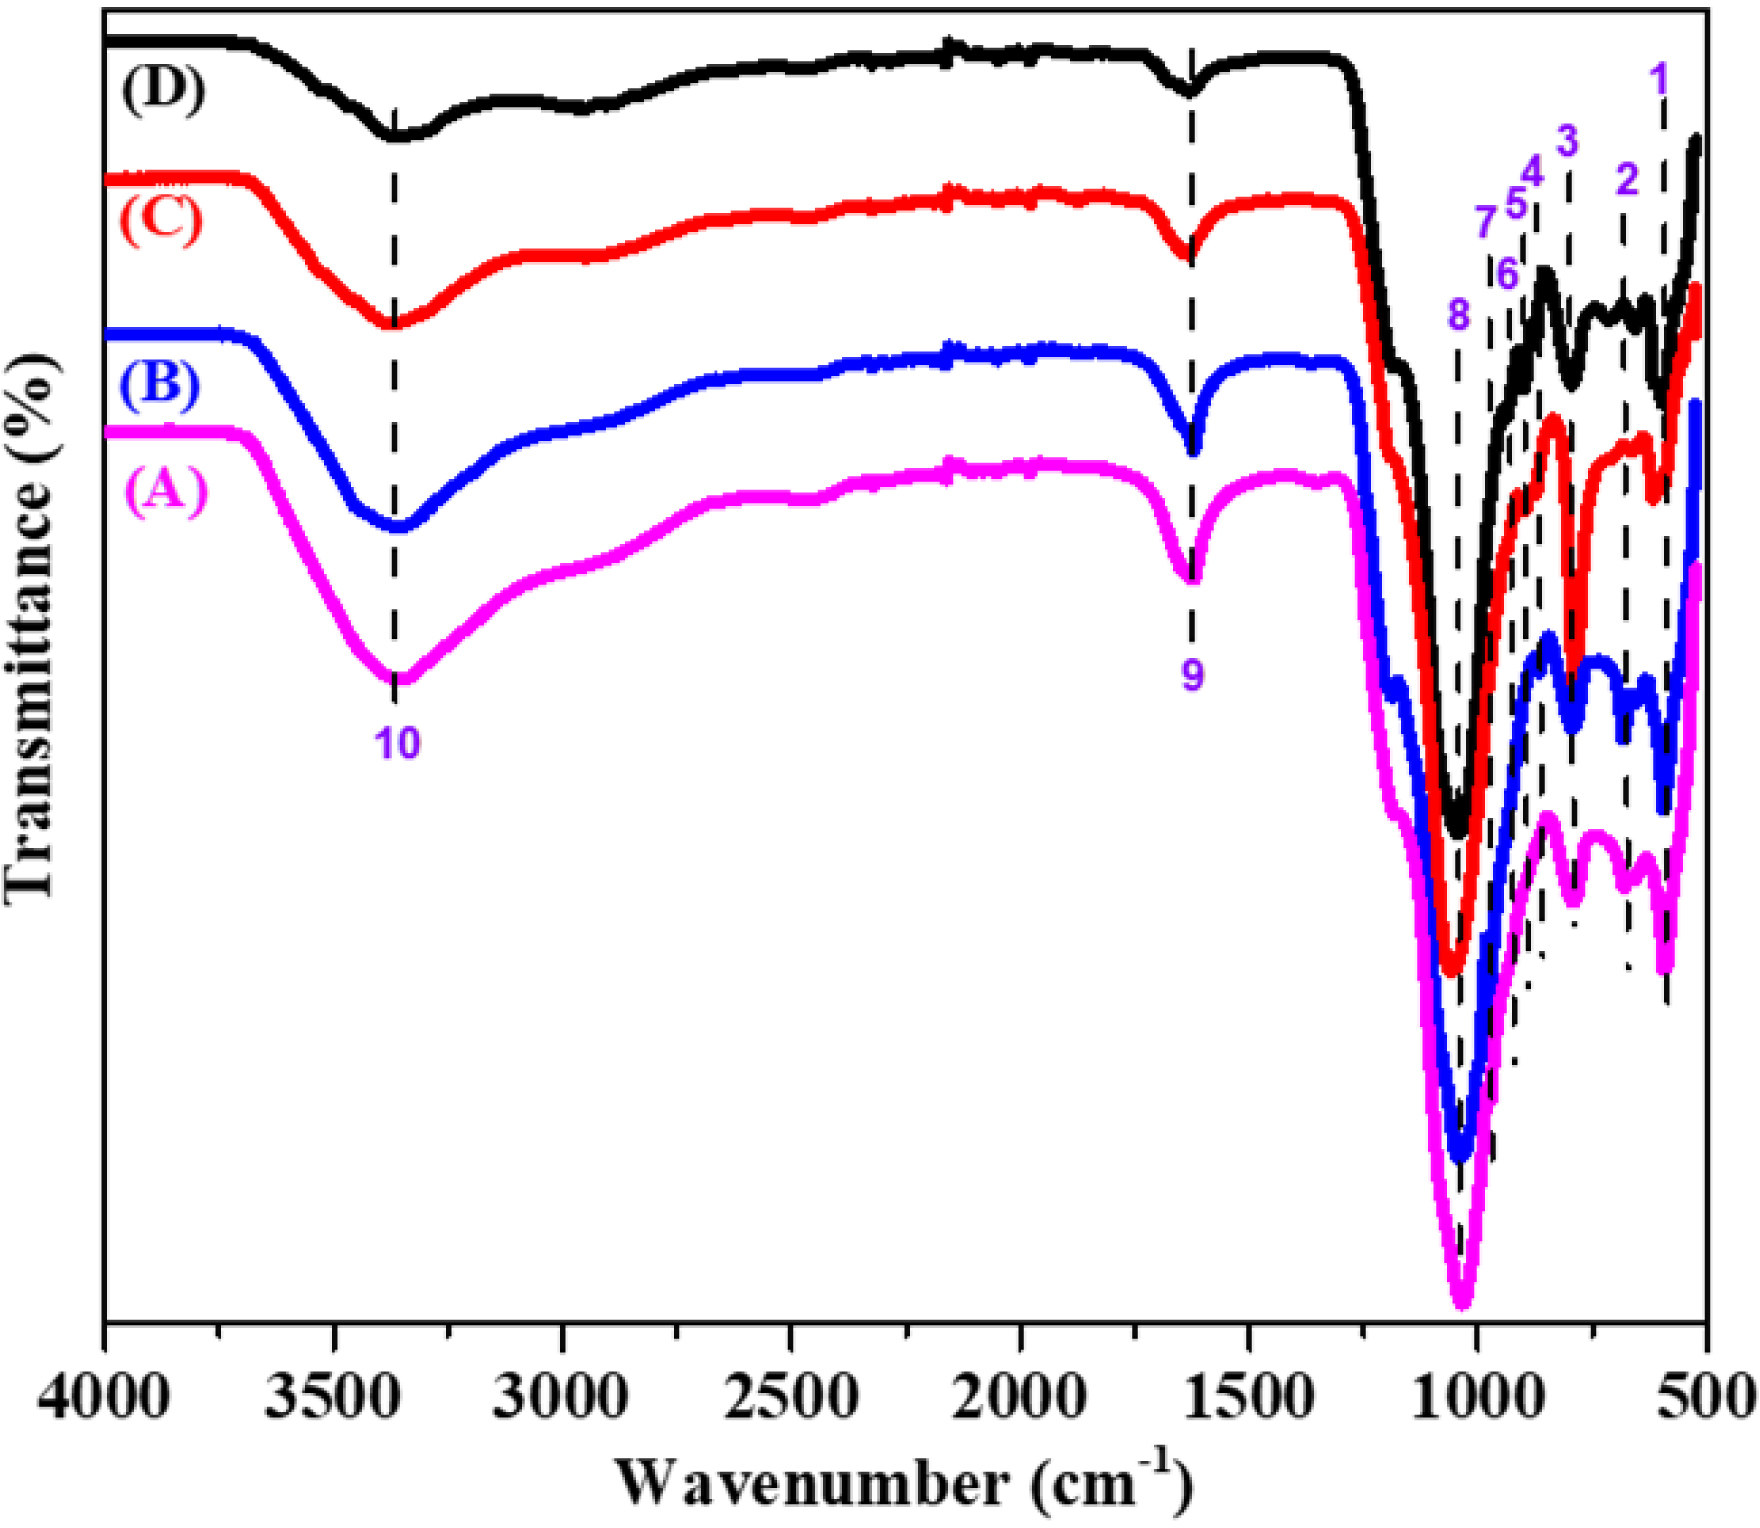
FTIR bands characteristic of the different catalyst bands
| No. | Position (cm−1) | Type of chemical bond |
|---|---|---|
| 1–2 | 550 and 670 | Planar rotation of V–O–V bonds |
| 3 | 797 | Symmetric vibration of Si–O–Si |
| 4 | 874 | Vibration of the V–O–V link |
| 5 | 900 | V–O–S link vibration |
| 6 | 933 | Si–O–V bonding vibration |
| 7 | 975 | V=O vibration of polymerized vanadate species |
| 8 | 1060 | Asymmetric elongation vibration of the Si–O–Si band |
| 9 | 1643 | Bond elongation vibration (H–O–H) |
| 10 | 3380 | Vibration of the (O–H) bond |
In addition, a broad band at around 1060 cm−1, corresponding to asymmetric Si–O–Si stretching vibrations, indicates the presence of extended siliceous structures [17, 23, 24]. A band in the 1020–1070 region is associated with sulfate stretching or V–O–SO4 vibrations [25]. The band at 1643 cm−1 is attributed to the bending vibrations of adsorbed water [26]. Finally, a broad band in the 3720–2600 cm−1 region, assigned to surface hydroxyl groups and coordinated water molecules [26, 27], was also observed. These FTIR spectroscopic results are consistent with the phases identified by XRD and confirmed by XRF, providing a comprehensive understanding of the chemical composition and structural features of the catalysts. Such information is crucial for elucidating the mechanisms of catalyst operation and deactivation as well as for guiding regeneration strategies and improving catalytic performance.
3.2. Catalytic test
A catalytic test was carried out on the SO2 to SO3 conversion reaction to confirm the results obtained in this study. This test allows the practical efficiency of the catalysts to be evaluated under conditions close to industrial reality. The results (Table 4) show a rapid decrease in the activity of the deactivated catalyst compared to the fresh catalyst, with a SO2/N2 ratio of 0.85 after only 2 h of reaction. This loss of performance can be attributed to several factors related to the structural and chemical modifications of the catalyst. Characterization of the deactivated catalyst by FTIR, XRF, and XRD confirmed a reduction in the SiO2 support and an enrichment in vanadium and sulfur phases, leading to the formation of less active compounds for the SO2 to SO3 conversion step. In particular, the appearance of the K3V(SO4)3 and Na3K(VO3)4 phases containing vanadium in the +3 oxidation state, which is less active than the +5 state of the initial vanadium phases, contributes significantly to the decline in catalytic performance, as confirmed by the study reported by Eriksen et al. [8]. The catalytic test results therefore confirm that the structural and chemical modifications occurring during deactivation have a direct impact on catalyst efficiency. Overall, these findings highlight the importance of understanding and controlling deactivation mechanisms in order to improve catalyst durability and performance in industrial applications. The data obtained provide a solid basis for developing regeneration and optimization strategies aimed at extending catalyst lifetime and maintaining high efficiency in sulfuric acid production processes.
Measured conversion rates for different catalysts
| Designation | Ratio (SO2/N2) | Reaction time (h) | Conversion rate |
|---|---|---|---|
| Fresh catalyst | 63 | ||
| Deactivated catalyst | 1.65 | 4 | 44 |
| Deactivated catalyst | 0.85 | 2 | 36 |
4. Conclusion
In this work, forced deactivation was investigated in order to elucidate the main causes of industrial catalyst deactivation during sulfuric acid production over a short timescale. Deactivation by water vapor was observed when the SO2/N2 ratio decreases, leading to visible color change accompanied by structural modification of the catalyst. The XRF analysis revealed an enrichment in active elements and a reduction in the silica support, together with the formation of less active vanadium species in the +3 oxidation state (V3+), which are associated with the loss of catalytic activity.
Sulfate accumulation was also evidenced with XRD confirming the development of new sulfate phases. This finding was supported by FTIR analysis, which showed increased sulfate deposition on the deactivated catalyst surface due to adsorption of SO2 and SO3 as well as higher water molecule interactions, leading to phase transformations responsible for catalyst deactivation.
Catalytic testing confirmed these structural and chemical changes, showing that activity was reduced by nearly half with the conversion dropping from an initial 63% to 36% after 2 h of operation at 350 °C in the SO2/N2 ratio of 0.85.
Acknowledgments
The authors would like to express their sincere gratitude to the OCP Foundation for funding the APPHOS project.
Declaration of interests
The authors do not work for, advise, own shares in, or receive funds from any organization that could benefit from this article, and have declared no affiliations other than their research organizations.