


 CC-BY 4.0
Highlights
- Particle shape significantly affects the cake porosity and in-turn cake resistance.
- Particle size distribution exhibits substantial effect on cake resistance.
- Narrow particle size distribution attributes porous cake than wider distribution of particle size.
- Research in particle properties analysis in holistic filtration approach is advised.
- General guidelines to accommodate deviations from filtration models are needed.
1. Introduction
Filtration is one of the important separation techniques used as downstream processing in chemical and allied industries such as pharmaceuticals, agriculture, food processing, ceramic, minerals processing, water treatment industries, and so on. It has been universally accepted that all the matter consists of particles, and a true definition of a particle depends on the type of operation [1]. In industries such as pharmaceuticals, the size of the particles affects its ultimate desired property of absorption rate and dissolution. Generally, in industrial filtration, particles in the slurry can be of the same geometry but not of uniform size. However, in practice, filtration operation is provided with only a particle size range, and the exact details about the particle size and its distribution are not taken into account while designing the filtration equipment. Theoretically, it is expected that a given filter medium will retain all the particles, the size of which is larger than the nominal or the absolute filter pore size [2].
The uniform spherical size particle is particularly defined by its diameter [3]. While a single dimension can define particles like cubes or tetrahedra, the height and the base diameter are needed for a cone, whereas for a cuboid, three dimensions are required [3, 4]. Particle size plays a vital role in the determination of the properties of particulate matter. Hence, it is often considered an important measure of property and performance. This is logical for a wide range of materials, from powders, emulsions, suspensions to aerosols. A few examples where particle size plays a vital role are the flavor of cocoa powder, appearance of cosmetics, hydration rate and potency of cement, dispersibility of drug molecule, and so on. Various methods are available for particle size analysis depending on the type and nature of samples, for example, laser diffraction, the most commonly used technique or sieving, one of the oldest and widely used techniques. Laser diffraction is chiefly used for determination in the range between 0.5–1000 μm while sieving is used for relatively larger particles particularly, dry sieving: >60 μm, air-jet sieving: 15 μm–1 mm, and wet sieving: 2 μm–1 mm, respectively. However, for particles having a size less than 0.5 μm, dynamic light scattering is at present the most recommended technique available for such analysis [5]. In cases where morphological properties also need to be measured, the image analysis method is one of the techniques to gain deeper insight into the topic. Many more techniques such as air elutriation analysis, photo analysis, optical counting methods, sedimentation techniques, time of transition (TOT), laser obstruction time (LOT), cascade impactors, and acoustic spectroscopy exist for particle size analysis [6].
To describe the particle size distribution (PSD), D-values (D10, D32, D50, D43, and D90) are commonly used. Here, D[i] represents i% of the cumulative mass that is comprised of smaller particles. The D10 signifies that the diameter of 10% of the mass of the sample has a diameter of less than this value. The D50 (median) implies that the diameter of 50% of the distribution lies below this value, whereas, D90 signifies that 90% of the distribution lies below this value. The surface area-based particles are mentioned in terms of Sauter mean diameter (D32), the median diameter (D50), and the volumetric mean diameter (D43), which is based on volume distribution, and these are used to define the particle size of the solids [7, 8]. The Sauter mean diameter, D32, is determined by the equation:
| (1) |
| (2) |
It is imperative to comprehensively assess the change in filterability with the help of the physical features of particles. The attributes of particle shape, size, and size distribution in cake filtration are highly pertinent and are usually the focal point of key industrial filtration processes, including pharmaceutical and specialty chemicals. There exists a dearth of information in this subject area, and hence it is of paramount importance to briefly summarize the prevalent work from the published literature. Though the scant literature on the subject matter may not be sufficient to traverse its complexity; however, it is but sure that this work will further spur the much-needed research in understanding the physics of filter cakes.
2. Effect of particle size and particle size distribution on filtration
Wakeman [11] studied the effect of particle size and particle size distribution on filtration. The author propounded through his work that the particle size and its distribution exhibit a significant influence on the solid–liquid separation process, thus impacting the behavior of solids during the filtration process. The resistance to the flow of fluid through the filter, i.e., the specific cake resistance, is inversely proportional to filter cake permeability by the equation:
| (3) |
| (4) |
It should be taken into consideration that the selection of the right choice of filter cloth for given particle size and PSD is essential in cake filtration operation as the presence of fine particles may lead to bleeding through the filter cloth in the prior phase of cake formation. Particles can pass within the pores of the formed cake, which tend to consolidate on the adjacent layer of filter cloth, thereby increasing the specific resistance of the filter cake (𝛼av) and consequently slowing down the filtration rate, resulting in higher moisture filter cake. The phenomenon is relevant for mechanically operated industrial filtration units. However, on a microfluidic level, the higher moisture content in the porous cakes is usually governed by the force interactions between the fluids and pore walls, commonly known as the capillary pressure. The porosity of the cake is not singularly dependent on the particle size, but it is greatly influenced by the distribution of particle size. The consequences of particle size for a given porosity on specific cake resistance are shown in Table 1 [11].
Effect of particle size and porosity on specific cake resistance [11]
| Particle size, D32 (μm) | Porosity, 𝜀 | Specific cake resistance, 𝛼av (×1011 m⋅kg−1) |
|---|---|---|
| 1 | 0.4 | 6.7 |
| 2 | 0.4 | 1.7 |
| 10 | 0.4 | 0.068 |
| 100 | 0.4 | 0.00068 |
Table 1 clearly indicates that 𝛼av and particle size are inversely related to each other. Therefore, on decreasing the particle size, resistance increases perpetually. The cake containing larger particles invariably leads to decreases in specific cake resistance. Under these circumstances, the flow rate of wash liquor becomes higher due to openings in the cake, which aids localized agitation, thereby increasing the coefficient of mass transfer. The ratio of the thickness of the cake to the size of particle broadly regulates the outcome of washing for a cake of coarse particles, which means an effective washing state can be anticipated with such a cake. In pressure filtration, as the pressure drop increases, the filtration time decreases; however, altering the particle size also aids in reducing the filtration time. When the particle size of the feed increases, the cake thickness also increases, which gives a more significant solid throughput as well as a higher rate of filtration. Due to this, the water content of the discharged cake is reduced, which means that every stage of the filter cycle is affected by particle size [2, 11]. The mean particle size determines the aforesaid feed characterization. The particle would be nearly spherical and have monosized dispersion, in the case when properties of particles define the filtration.
As particle properties intensely affect the key cake properties such as specific resistance, the largeness or size of the particle should be such that it would decrease the contact at the particle–liquid interface. This would result in a particle effectively reducing the influence of aging and successfully getting rid of filter cloth-related issues like bleeding and the requirement of recurrent cleaning. All these issues described above are caused by the presence of fines in the feed. Very fine particles restrict the flow of fluid through the cake and increase the liquid volume hold-up in the cake. This, along with the effect of capillary pressure within the pores, jointly contributes to the moisture retention in the cake. Therefore, the particle size distribution should be such that it allows high flow rates of the fluid through the cake. Also, it should be noted that if the mechanical pressure is applied at the time of filtration, it may practically overcome the pore-wall force interactions, and the moisture removal process would be a result of squeezing the cake. Chang et al. [12] also worked on the filtration efficiency due to particle size variation on similar lines to that of Wakeman [11]. The particles with a dimension ratio larger than 1:4 positively affected the filtration effectiveness. The filtration improvement was attained more quickly when the ratio of large particles to small particles was more. The reason for this might be a well-known result of the networking effect between the smaller and larger particles, where the smaller particles fill the gaps between larger particles. In another study, Aim et al. [13] chose three different sizes (0.46, 0.825, 2.967 μm) of polystyrene latex molecules as these sizes comprise the movement of the particle by Brownian dispersion and blocking. This study is in line with the other reports demonstrating that the existence of coarser particles assisted tiny particles in suspension and enhanced the filtration potency.
Kinnarinen et al. [14] emphasized on the effect of fine grinding to better understand the consequence of particle size and PSD on specific cake resistance and other filtration properties. The specific cake resistances were correlated to the particle size D10, D50, D90, D32, D43, and specific surface area. For the calculation of volume-based specific surface area, Sv (m2⋅m−3), of spherical particles, Sauter mean diameter was used as:
| (5) |
| (6) |
| (7) |
Effect of particle size on specific cake resistance [14]
| Sr. no. | Sauter mean diameter, D32 (μm) | Specific cake resistance, 𝛼av (×1011 m⋅kg−1) at different 𝛥P | ||
|---|---|---|---|---|
| 2 bar | 4 bar | 6 bar | ||
| 1 | 3.54 | 1.17 | 1.28 | 1.46 |
| 2 | 3.45 | 1.31 | 1.59 | 1.52 |
| 3 | 3.3 | 1.44 | 1.7 | 1.83 |
| 4 | 3.27 | 1.4 | 1.58 | 1.74 |
| 5 | 3.16 | 1.53 | 1.75 | 1.9 |
| Standard deviation | 0.15 | 0.137 | 0.183 | 0.192 |
| Variance | 0.023 | 0.019 | 0.033 | 0.037 |
The occurrence of small particles in the slurry bolsters high 𝛼av, as shown in Table 2. The variation in the Sauter mean diameter is small, and the standard deviation is small. However, this, in fact, indicates that even the smallest changes in the particle size directly influence the 𝛼av when the slurry is filtered. The graphical representation in Figure 1 shows the trend that the smaller the particles in size, the higher the specific cake resistance. In this study, the largest representative particle, D90, did not influence the cake resistance significantly, which might be allied with two describing factors. Firstly, even though there are high D90 size particles, there must also be very fine particles that dominate the separation methods. Secondly, if the amount of coarser particles in the examined sample are very less as compared to fine particles, then there occurs a sampling failure and irregularity in the investigation increases. Also, the diameters D10, D50, and D32, delivered consistent measurement trends as opposed to D43. The volumetric mean diameter did not correlate so smoothly with the specific cake resistance, and therefore our discussions are limited to D32 instead of D43. The particle size affects the processes of formation of cake and thereby influences particle settling rate, cake resistance as well as particle deposition in the cake.
Effect of particle size on specific cake resistance.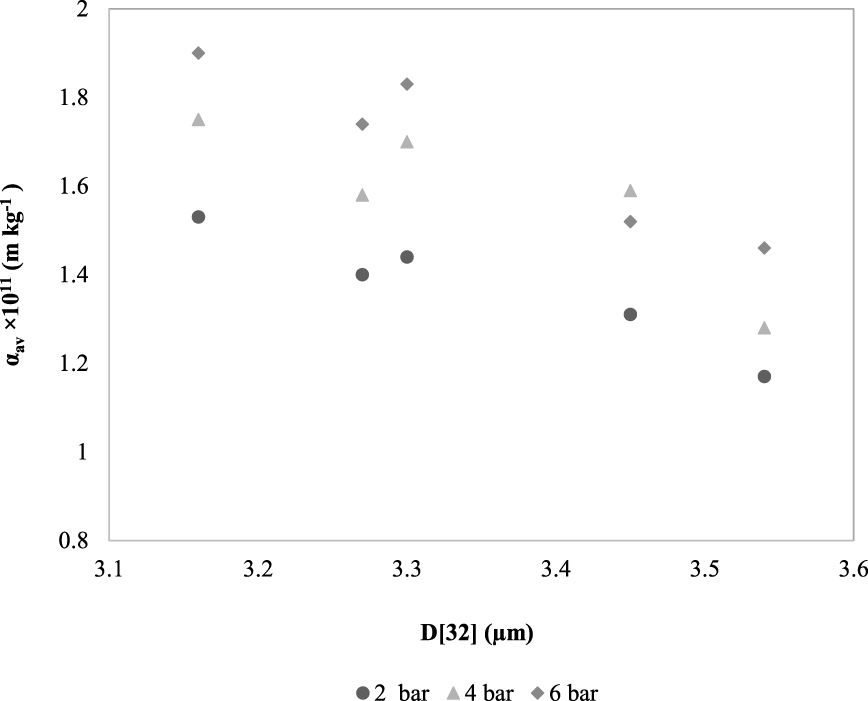
Effect of PSD span on specific cake resistance [15]
| Sample | PSD span (D90 − D10)∕D50 | Specific cake resistance, 𝛼av (×1011 m⋅kg−1) at different 𝛥P | ||
|---|---|---|---|---|
| 2 bar | 4 bar | 6 bar | ||
| 1 | 4.3 | 6.9 | 6.6 | 7.9 |
| 2 | 5.9 | 6.3 | 7.2 | 7.6 |
| 3 | 3.1 | 2.3 | 2.8 | 3.3 |
| Standard deviation | 1.4 | 2.5 | 2.39 | 2.57 |
| Variance | 1.97 | 6.25 | 5.69 | 6.62 |
Effect of PSD span on specific cake resistance.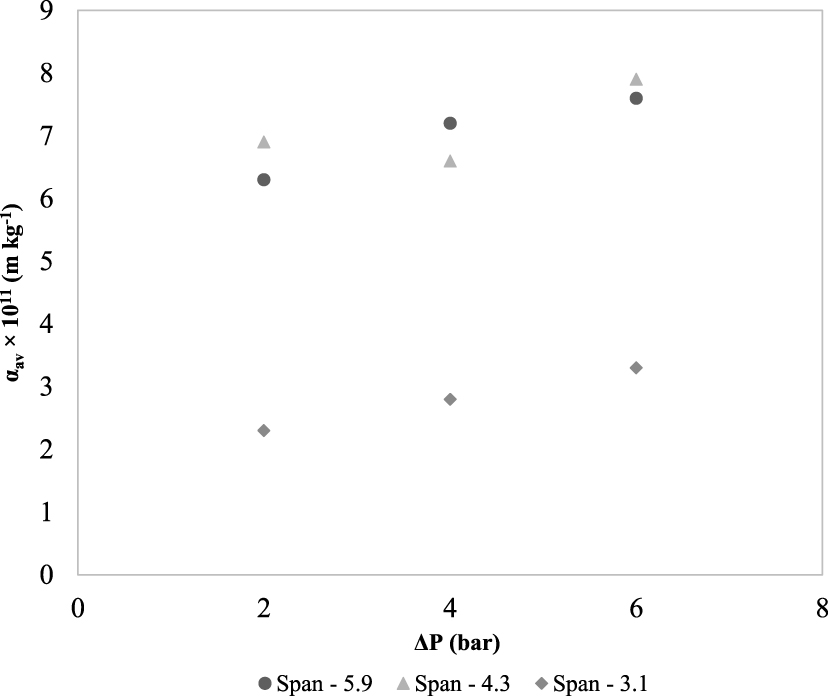
Table 3 and Figure 2 clearly indicate that for narrow span, i.e., for narrow distribution, the 𝛼av decreases because narrow PSD signifies a more alike particle size, which provides the construction of an open cake arrangement with reduced resistance to fluid flow. On the other hand, wider PSD usually causes the filling of gaps within coarser particles in the cake by tiny particles. Therefore, as the randomness between the particles increases, the 𝛼av also increases. It is to be noted that the authors cited in Table 3 further attempted to obtain a correlation between cake resistance and porosity. However, no noteworthy relation could be obtained due to scattered data points.
Kinnarinen et al. [15] further suggested that although a wider PSD assists in the filterability, decreasing the wideness of particle size might help overcome the adverse impact on the flux caused by tiny particles. This is because, for a particularly narrow particle size distribution, the formation of more or less an unrestricted cake structure results in lesser resistance to fluid passage. This study evaluates the effect of the widest and narrowest PSD, in which it was shown that the most substantial values of 𝛼av were acquired regardless of the filtration pressure, while the wideness of distribution of particle size was in the mid-range value, D50. Bourcier et al. [16] also worked on cake filterability and compressibility with respect to particle shape and particle size distribution with the same approach as that of Kinnarinen et al. [15]. The study concluded that the PSD exhibited the most significant impact on 𝛼av and compressibility, thus showing that the smaller the particle in size, the higher the 𝛼av. Further, Kinnarinen et al. [17] proposed four regression models to express the effect of PSD in the form of a variable on specific cake resistance. Correlation of the cake resistance with grinding of the material, by which it was clear that the smaller PSD holds a better relation with 𝛼av, and the relationship becomes limited with the larger end of the PSD. The moisture content of the finer particle filter cake was more considerable than that of the larger particle. The authors specified that 𝛼av presents a significant measure of filterability and hence can be broadly utilized as a crucial calibrating parameter.
3. Effect of particle shape on specific cake resistance
Wakeman [11] proposed that the particle volume and surface area are mainly affected by the particle shape. The particle shape also has an influence on the specific surface and flow rate through the filter cake. The effect of particle shape on 𝛼av is shown in Table 4. The data shows that as 𝛼av increases by a factor of almost 700, the shape of the particles also changes from a fiber to a flake. The author also reported that the particle shape demonstrates an impact on the contact of the cake particles with the opening in the filter medium. Here, it is to be noted that the orientation of the particles in the cake can play a pivotal role while determining the effect of particle shape. For instance, the flaky particles may settle horizontally and present little passage for the fluid flow. In contrast, the flakes may settle vertically and offer a lot more open cake structure with very low cake resistance. In reality, however, completely random settling and cake formation may occur, which may vary the filtration results. Kinnarinen et al. [14] also observed similar results where particle shape affected the specific surface area in pressure filtration. High specific surface area resulting from the particle shape was a typical reason for high average specific cake resistance in their studies.
Effect of particle shape on specific cake resistance [11]
| Particle shape∗ | Specific cake resistance, 𝛼av (×109 m⋅kg−1) |
|---|---|
| Fibrous | 1.6 |
| Cylinder | 1.7 |
| Rectangular | 1.8 |
| Sphere | 3.6 |
| Cube | 3.6 |
| Flake | 1100 |
∗For particle size = 10 μm; porosity = 0.5; solid density = 2000 kg⋅m−3.
Effect of particle shape and size on specific cake resistance and compressibility [16]
| Particles (μm) | Specific cake resistance, 𝛼av (×109 m⋅kg−1) at different 𝛥P | Compressibility | ||
|---|---|---|---|---|
| 1 bar | 3 bar | 5 bar | ||
| Spheres 7 | 11.5 | 17.4 | 22.1 | 0.4 |
| Cubes 10 | 2.7 | 4.6 | 5.8 | 0.47 |
| Needles 17 | 1.4 | 3.8 | 6.4 | 0.93 |
| Platelets 14 | 19.1 | 39.2 | 59.4 | 0.7 |
Bourcier et al. [16] explained that compressibility plays a vital role if the particles are not spherical. This emphasizes that particle shape and compressibility both are critical parameters in the filtration operation. The particle shape can be expressed accordingly by sphericity, 𝜑v, which is given by the equation:
| (8) |
Effect of particle shape and size on specific resistance and compressibility.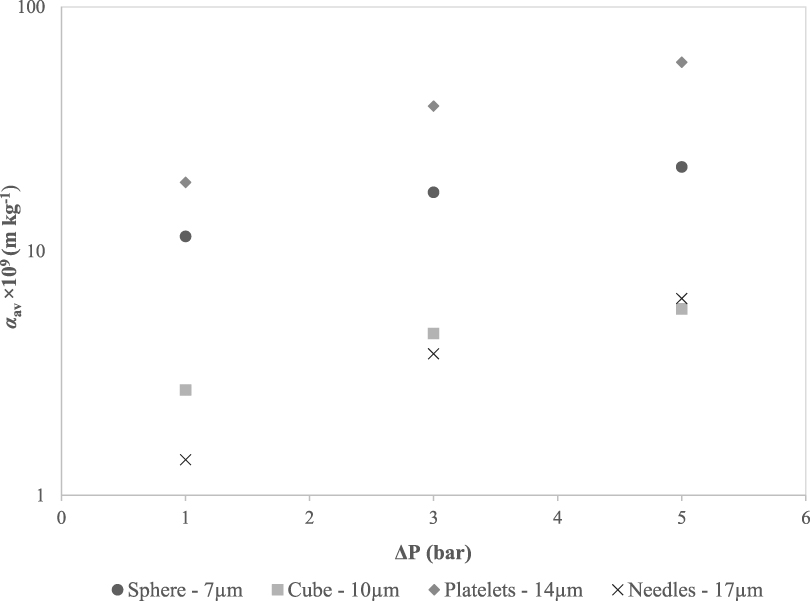
4. Effect of particle size, particle size distribution, and particle shape on porosity
Kinnarinen et al. [14] already stated that the PSD exhibits a profound influence on porosity. In their observations, as the wideness of the distribution of particle size increases, the average cake porosity decreases. The porosity, 𝜀, is calculated by using cake thickness, L, and dry solid mass ms by the equation:
| (9) |
| Sr. no. | PSD span | Porosity, 𝜀 | ||
|---|---|---|---|---|
| 2 bar | 4 bar | 6 bar | ||
| 1 | 2.16 | 0.5 | 0.473 | 0.474 |
| 2 | 2.65 | 0.481 | 0.455 | 0.443 |
| 3 | 2.93 | 0.479 | 0.430 | 0.420 |
| 4 | 3.23 | 0.482 | 0.456 | 0.433 |
| 5 | 3.55 | 0.446 | 0.385 | 0.417 |
| 6 | 4.15 | 0.409 | 0.365 | 0.359 |
| 7 | 4.54 | 0.402 | 0.389 | 0.351 |
| 8 | 5.24 | 0.439 | 0.410 | 0.4 |
| 9 | 6.68 | 0.417 | 0.390 | 0.353 |
| 10 | 7.51 | 0.4 | 0.372 | 0.357 |
| Standard deviation | 1.76 | 0.038 | 0.039 | 0.04 |
| Variance | 3.09 | 0.001 | 0.001 | 0.002 |
Kinnarinen et al. [14, 15] established that the lower the porosity of the cake, the higher the specific cake resistance and vice versa. The researchers also specified that the average cake porosity was independent of the pressure difference. A marginal interdependency of average porosity with PSD width, i.e., the span, can be seen in Table 7. The range of the average cake porosities is 0.5–0.66, as indicated in Table 7 and its corresponding Figure 4. It is typically assumed that in wide particle size distribution, smaller particles occupy the space between the bigger particle in the cake, and densely packed cake is formed. Conversely, narrow particle size distribution shows more even particle size, which creates the open cake structure and reduces the resistance. However, the porosity is not much affected by pressure difference for incompressible cakes. Moreover, it should be noted that the zeta potential of the particles also plays a vital role in defining the cake porosity. The cake structure is strongly influenced by particle agglomeration, which in turn alters the cake porosity and subsequently cake resistance, which inherently is an effect of low zeta potential values. Lower values of cake porosities (∼0.45) are reported in the literature at about 40 mV or higher zeta potential [18]. This is because, at higher zeta potential, the intra-particle repulsion prevents particle agglomeration. The zeta potential values close to 0 mV assist in agglomeration because of the stronger van-der-Waals forces [20].
Effect of PSD span on specific cake resistance and porosity [15]
| Sample | PSD span (D90 − D10)∕D50 | Porosity, 𝜀, at different 𝛥P | Specific cake resistance, 𝛼av (×1011 m⋅kg−1) at different 𝛥P | |||||
|---|---|---|---|---|---|---|---|---|
| 2 bar | 4 bar | 6 bar | 2 bar | 4 bar | 6 bar | |||
| 1 | 4.3 | 0.511 | 0.5 | 0.508 | 6.9 | 6.6 | 7.9 | |
| 2 | 5.9 | 0.596 | 0.581 | 0.571 | 6.3 | 7.2 | 7.6 | |
| 3 | 3.1 | 0.654 | 0.642 | 0.635 | 2.3 | 2.8 | 3.3 | |
| Standard deviation | 1.4 | 0.07 | 0.007 | 0.006 | 2.5 | 2.39 | 2.57 | |
| Variance | 1.97 | 0.005 | 0.005 | 0.004 | 6.25 | 5.69 | 6.62 | |
Effect of PSD span on porosity.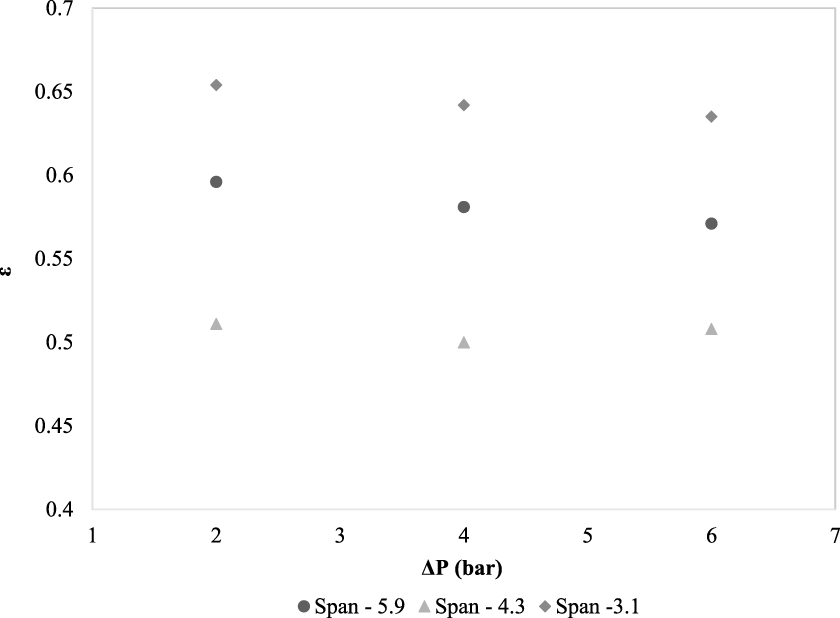
Anlauf and Sorrentino [21] defined the particle shape factor to relate the Sauter mean diameter, D32, and actual specific surface mean size. In their studies, the PSD data alone was not enough because none of the available devices produced measurements based on the specific surface, so they proposed to include particle shape factor, 𝜓SV, and defined the actual Sauter mean diameter as:
| (10) |
| (11) |
Beck and Andreassen [22] worked on the effect of seeding on regulating the size, distribution, and structure of the particles. They concluded that by altering the quantity, size of the seed particles, and concentration, the distribution width of particles and crystal size could be governed. From Table 8, it is evident that the reduction in the Sauter mean diameter, D32, results in a decrease in filterability. This is because the particles show a wide size distribution rather than a uniform size. A perfectly spherical shape leads to lower D32 values, which leads to reduced filterability with increased specific cake resistance. It can also be seen from Table 8 that lower cake porosity is another reason for higher 𝛼av, and porosity could be coherently related to particle shape.
5. Comments
The foregoing discussion and the analysis thereof show that along with particle size and particle size distribution, the particle shape is also an aspect that impacts to a large extent the cake structure and cake deliquoring process. Such data is scant in the literature, and therefore, further research on the effect of particle shape along with the PSD is very much required and strongly recommended. There is an added dilemma in studying another factor which is the effect of the particle size. That is due to the fact that different size measurement devices measure different mean sizes at varying levels of reproducibility [21]. Having supposed that, the instruments are highly accurate in measuring equivalent diameters, which can be correlated by using area, volume, or number to segregate the sizes. The shape factor presented by Anlauf and Sorrentino [21] can be used as a correction to “normalize” the diameters measured by different devices. The method mentioned above can be conveniently used to eradicate the ambiguity in particle size measurement. In conjunction with this, or in isolation, the use of an emerging platform, machine learning, is also encouraged in such scenarios to measure and model complex systems without the detailed knowledge of all the variables [23]. The advantage of employing machine learning is that the accuracy of the estimated results improves over time as more and more data is collected. To illustrate, a large data set may be generated for, say, various particles or particle slurries and correlated for filtration conditions or filter sizes.
Effect of particle shape and size on porosity and specific cake resistance [21]
| Shape | Sauter mean diameter, D32 (μm) | Porosity, 𝜀 | Specific cake resistance, 𝛼av (×1012 m⋅kg−1) |
|---|---|---|---|
| Sphere | 13.22 | 0.53 | 2.9 |
| Plate | 14.27 | 0.7 | 1.8 |
| Cube | 16.18 | 0.65 | 0.94 |
| Needle | 17.16 | 0.86 | 0.34 |
It can thus be said that the research techniques, including only particle size distribution measurements without the information of particle shape, are certainly inadequate to truly determine the overall effect of particle attributes. In the past, researchers laid their emphasis on studying the filtration process in isolation and look for a staggered approach either by focussing on particle packing density, filter size selection, modeling, or filtration techniques. The holistic approach is certainly required, and as an example, in the design of thickeners, the basic mass balance starts from the particle setting in liquid, where its density, size, and distribution are considered thoroughly [24]. Besides, the zeta potential is going to manifest an additional role to play in determining the filterability of the cake, where adding insufficient or excess coagulant dose may also be detrimental to particle agglomeration [25, 21]. One can add additional features without undermining their importance, such as the one highlighted by Anlauf and Sorrentino [21], where, along with the shape factor, a tortuosity factor was recommended to be introduced to correct the deviation in the real flow through the cake. Also, it was taken into consideration that since particles are tightly packed inside the filter cake, the total particle surface is not available as a pore surface. Consequently, an improvement in the classical Kozeny–Carman equation was proposed by including a pore-particle-shape factor [26]. Studies of such types are suggested further to evaluate and correlate cake properties in such a way that the particle properties, specifically size distribution and shape, are included in the filtration equipment design.
6. Summary
The review reveals that the particle characteristics can significantly impact the filterability, which subsequently affects the filtration rate. It seems to be obvious from the literature that the specific cake resistance becomes higher with the reduction in particle size. A narrow particle size distribution for every reason gives more porous cake than the wider distribution. As the porosity decreases, specific cake resistance increases in cake filtration, which in turn is a strong function of PSD width. It is highly desirable to study the effect of particle shape in such scenarios since it largely determines the cake structure formation. From the analysis of the existing literature, it can be said that the cake properties can be defined and controlled by altering the particle size, the width of PSD, and the shape of particles. However, there is no quantitative answer on how to achieve this. To realize this, it should be taken into consideration that, first, not all the particle surface is available as pore surface due to the contact between the particles inside the filter cake. And second, not all the pores are straight and cylindrical capillaries. Both of these issues warrant the determination of the actual pore surface accessible and the real flow through the cake. This necessitates establishing the special shape correction factor, which demands extensive filtration experiments but offers the true Sauter mean diameter. This true Sauter mean diameter can then be employed to fine-tune the filtration model equations. The particles forming agglomerates and compressible filter cakes may present a real challenge in this task since the porosities and the contact surface would be more dynamic over time. Studies on the effect of the zeta potential of the particles should be considered because it influences the cake porosity and compressibility remarkably. There exists no proven method or correlation to accommodate the deviation from filtration models. A systematic approach to set up and validate the general guidelines is needed through further research.