

1 Introduction
The lanthanide contraction, the change in ion size with atomic number, was one of the first structural features of the lanthanides and papers referring to it date back to at least 1926 [1]. Because early diffraction studies were time-consuming, the entire lanthanide series (here defined as La through Lu, excepting the radioactive Pm) was typically not examined and the decrease in ionic radius was usually shown using representative members of the series [2] and the contraction was assumed to be linear with atomic number [3]. Modern advances in structure analysis have yielded a number of whole or near-whole series of structures for isostructural compounds [4–8], generating much more data for a plot of the lanthanide contraction and showing that the contraction is significantly curved, a feature that we and others in the field have generally accepted but not explained.
The early X-ray and neutron diffraction characterization of the series [Ln(H2O)9][CF3SO3]3 was especially significant [6,9], because of its relevance to the solution chemistry of the lanthanide aqua ions. This series is isostructural and the cations have C3h crystallographic site symmetry. Thus, each vertex and each cap H2O is equivalent within its class. In an ionic model, the capping ligands have more ligand–ligand repulsion and so have longer Ln–O distances. This result is mirrored in modern calculations [10]. The authors of the [Ln(H2O)9][CF3SO3]3 papers struggled to explain both the curvature in the Ln–O distances across the series as well as the different curvature seen for the two different water molecules [6]. Subsequently, Quadrelli examined this and the isostructural series [Ln(H2O)9][EtOSO3]3 [8], and found both to be more closely fit by a quadratic expression [11].
More recently, Ibers et al. determined the structure of a series of compounds with the general formula RbLnSe2 [4]. The lanthanide ions lie in octahedral coordination environments, and each coordinating selenium atom is identical. The Ln–Se internuclear distances of the complexes were found to be more closely fit by a quadratic expression, as were the Ln–Te distances in the series CsLnZnTe3 [5].
We earlier presented an explanation of the apparent quadratic nature of the contraction based on the nuclear shielding of the f orbitals [12] and Slater's model for atomic shielding [13–15]. That paper described a structural series for a multidentate ligand. Here we expand upon that model and show its effective explanation of Ln3+ ionic radii for a number of published series of isostructural complexes.
2 Modeling and plotting ionic radius from crystal-structure data
For hydrogen atom wave functions, it is not the average distance of the electron from the nucleus, <r>, that varies linearly with effective nuclear charge but rather the average inverse, <1/r>. This suggests that 1/r(x), the inverse of the lanthanide ionic radius (where x is the number of f electrons in the lanthanide ion of interest, treated as a continuous variable), can be represented by a linear equation:
| (1) |
As will be shown, this is mathematically equivalent to the Slater shielding formula.
Here the intercept
| (2) |
is the inverse of the ionic radius of lanthanum and the slope
| (3) |
is the incremental change in the inverse of the ionic radius from one lanthanide to the next. Thus, the internuclear distance between the lanthanide and the coordinating atom of the ligand, d(Ln-L), is given by
| (4) |
where r(L) is the radius of the coordinating ligand.
Eq. (4) can be expanded through a Maclaurin series [16] to give an equation of the form
| (5) |
which, if terminated at the third term, gives the polynomial described by Quadrelli
| (6) |
where
Equations (1) to (6) suggest that a plot of 1/r(x) as a function of the number of f electrons will be linear.
The ionic packing model, with derived ionic radii, was pioneered by Goldschmidt [17] and Pauling [18], culminating in tabulations such as the widely used values of Shannon [19]. The relevant Ln–L internuclear distances are shown in Table 1. By subtracting the known ionic radii of the ligating atoms from the Ln–L internuclear distances in simple structures, the ionic radii of the Ln ions can be determined for a series of experimentally determined distances.
Internuclear distances (Å) in lanthanide complexes with various ligands.
| Lanthanide | Number of f electrons | [Ln(H2O)9][CF3SO3]3 | CsLnZnTe3 | RbLnSe2 | [Ln(H2O)9][EtOSO3]3 | |||
| Vertex | Capping | Axial | Equatorial | Vertex | Vertex | Capping | ||
| La | 0 | 2.513 | 2.611 | 3.204 | 3.174 | 3.030 | 2.517 | 2.616 |
| Ce | 1 | 2.489 | 2.594 | – | – | 2.999 | 2.491 | 2.600 |
| Pr | 2 | 2.469 | 2.579 | 3.162 | 3.139 | 2.978 | 2.470 | 2.583 |
| Nd | 3 | 2.451 | 2.571 | 3.147 | 3.125 | 2.959 | 2.457 | 2.570 |
| Sm | 5 | 2.418 | 2.548 | 3.119 | 3.103 | 2.935 | 2.430 | 2.55 |
| Eu | 6 | 2.408 | 2.536 | – | – | – | 2.415 | 2.542 |
| Gd | 7 | 2.395 | 2.536 | 3.103 | 3.086 | 2.914 | 2.401 | 2.536 |
| Tb | 8 | 2.378 | 2.527 | 3.087 | 3.078 | 2.893 | 2.382 | 2.527 |
| Dy | 9 | 2.363 | 2.520 | 3.073 | 3.067 | – | 2.371 | 2.517 |
| Ho | 10 | – | – | 3.065 | 3.058 | 2.874 | 2.362 | 2.511 |
| Er | 11 | – | – | 3.053 | 3.046 | 2.85 | 2.352 | 2.503 |
| Tm | 12 | – | – | 3.041 | 3.043 | – | 2.340 | 2.504a |
| Yb | 13 | 2.302 | 2.532a | 3.033 | 3.042 | – | 2.324 | 2.503a |
| Lu | 14 | 2.287 | 2.519a | – | – | 2.837 | 2.318 | 2.497a |
a Values omitted from the refinement due to steric crowding.
A least-squares fit of the crystallographic data to obtain the parameters a, b, and r(L) of Eq. (4) for each ligand was performed by minimizing:
| (7) |
where di(x)obs is the observed internuclear distance and di(x)calc is the corresponding predicted values d(Ln-L) for the ith crystallographic data point. In order to account for differences in lanthanide ionic radius that were due to the different coordination environments, Eq. (8) [20] was used to normalize the values of both a and b for coordination number 6 and 9:
| (8) |
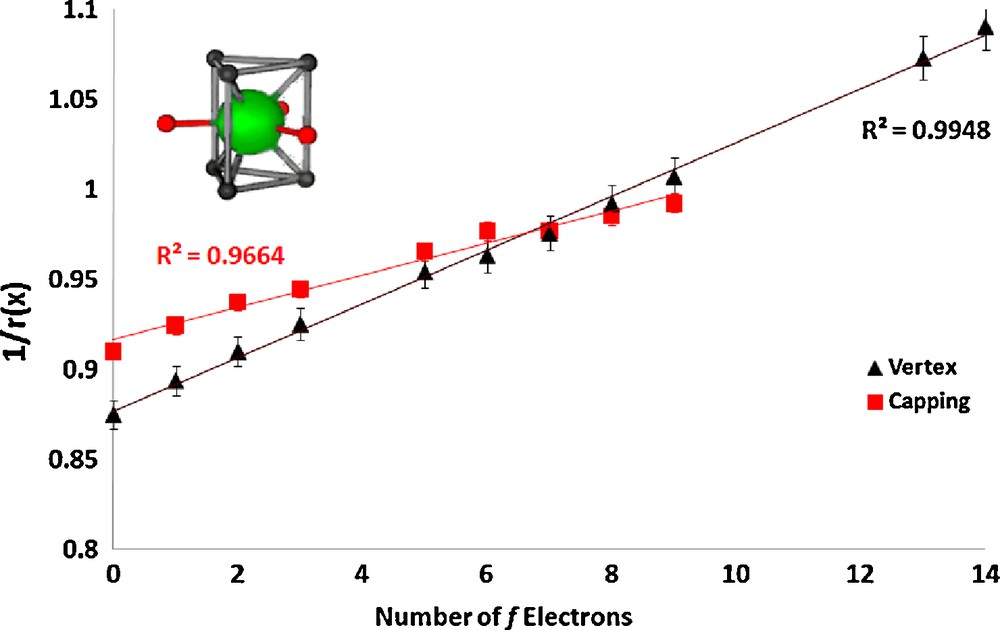
The series RbLnSe2 (Ln = La, Ce, Pr, Nd, Sm, Gd, Tb, Ho, Er, Lu) [4] crystallizes with lanthanide ion site symmetry D3d; the lanthanide ions are nearly octahedral and each coordinating selenium atom is identical. A coordination number of 3 for the selenium atoms was used to fix the ionic radii of the selenium atoms to previously published values [19] for the purposes of the data refinement. A plot of 1/r(x) as a function of the number of f electrons is shown in Fig. 1.
Plot of the inverse of the ionic radius vs. the number of f electrons for the lanthanide complex RbLnSe2.
The series CsLnZnTe3 (Ln = La, Pr, Nd, Sm, Gd, Tb, Dy, Ho, Er, Tm, Yb) [5] crystallizes in the layered KZrCuS3 structure type in the orthorhombic space group Cmcm. The structure is composed of LnTe6 octahedra, with axial and equatorial tellurium atoms in the unit cell. The equatorial atom ionic radii were fixed to the three-coordinate literature value [19], and the axial tellurium ionic radii, due to their different coordination environment, were refined. Fig. 2 shows our results for these complexes.
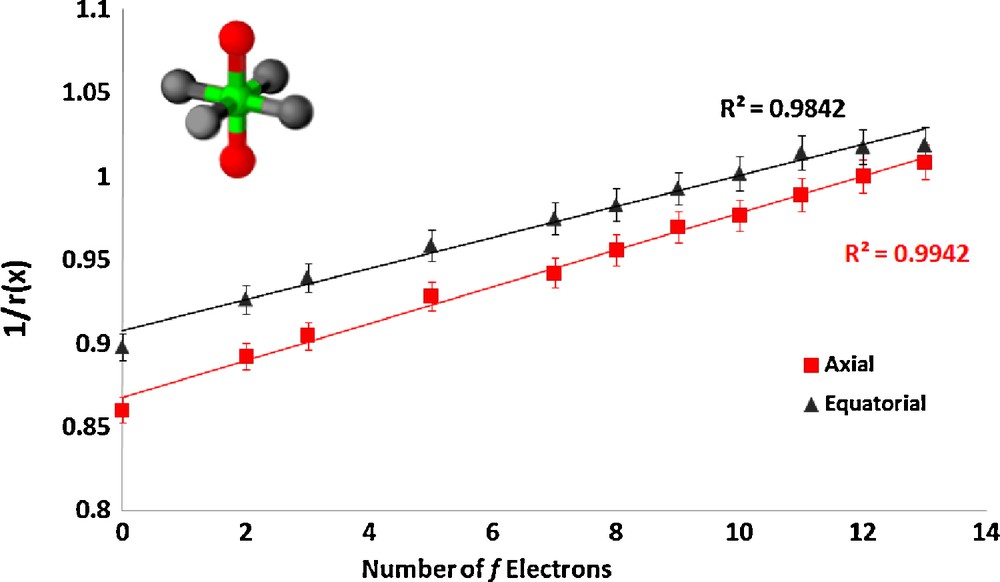
Plot of the inverse of the ionic radius vs. the number of f electrons for the lanthanide complex CsLnZnTe3.
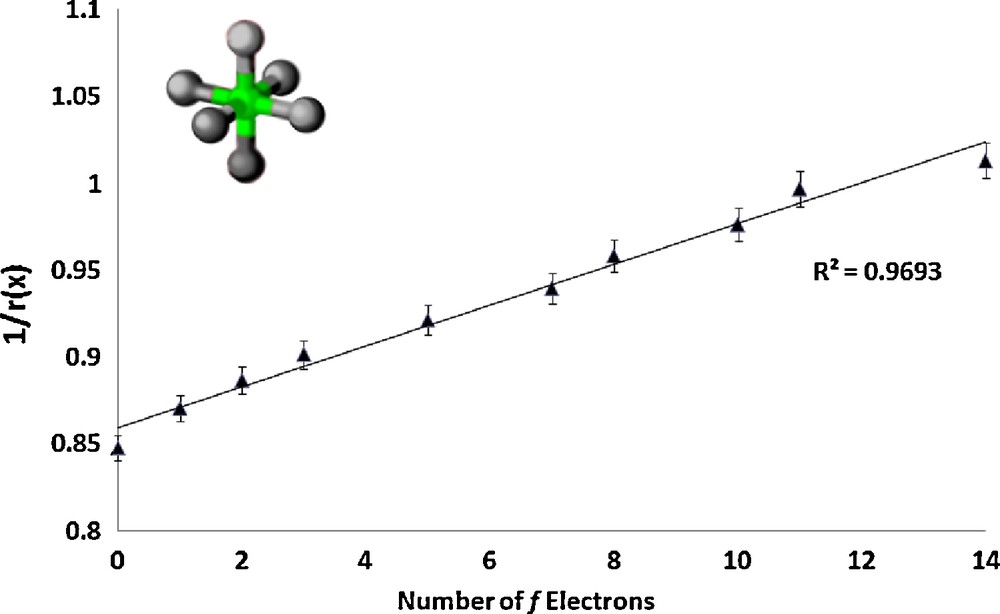
In the lanthanum nonaaqua triflate and ethyl sulfate salts ([Ln(H2O)9][CF3SO3]3, Ln = La, Ce, Pr, Nd, Sm, Eu, Gd, Tb, Dy, Yb, Lu and[Ln(H2O)9][EtOSO3]3, Ln = La, Ce, Pr, Nd, Sm, Eu, Gd, Tb, Dy, Ho, Er, Tm, Yb, Lu) [6,8] the cations are also tricapped-trigonal prismatic in geometry. The vertex ionic radii were fixed to a literature value for water [21] and the capping radii were refined, constrained to a single value (the values for Tm, Yb, and Lu are anomalous, which we attribute to steric crowding, and were omitted). The linear plots are shown in Figs. 3 and 4.
Plot of the inverse of the ionic radius vs. the number of f electrons for the lanthanide complex [Ln(H2O)9][CF3SO3]3.
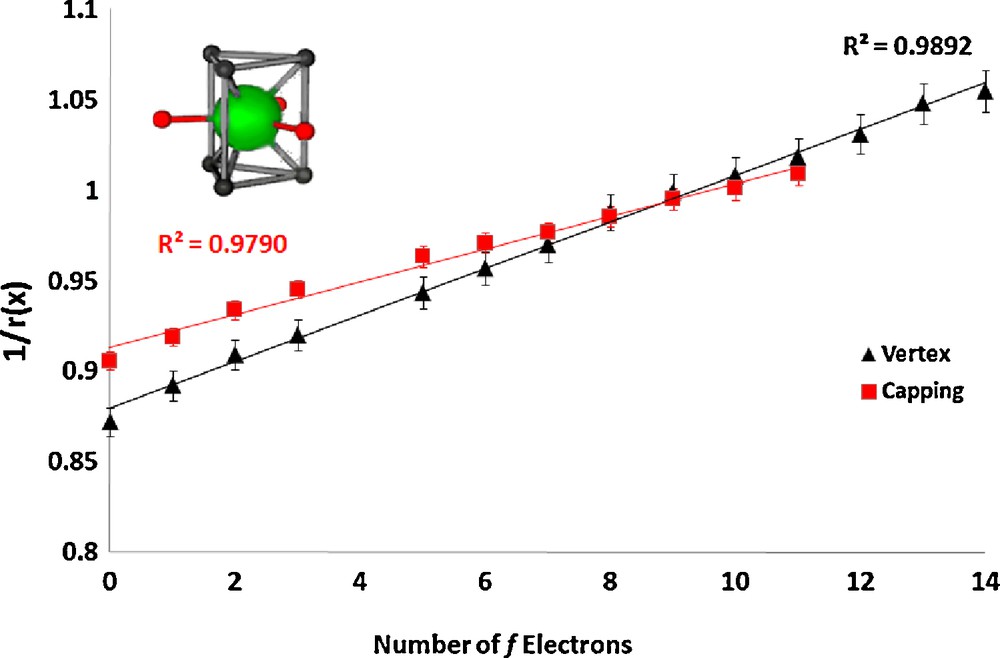
Plot of the inverse of the ionic radius vs. the number of f electrons for the lanthanide complex [Ln(H2O)9][EtOSO3]3.
3 Calculating the screening constant for 4f electrons
Using Slater's revised model [14], the ionic radius of a complexed lanthanide ion can be written in the form:
| (9) |
| (10) |
| (11) |
| (12) |
| (13) |
4 Conclusions
The lanthanide contraction is a topic of considerable history and practical as well as theoretical significance. The increasing number of structures and the more complete sets of data for the entire series of lanthanides in a given structural type show that the change of lanthanide to ligand bond distance does not change linearly with atomic number. The apparent curvature of the ionic radii with atomic number is because it is 1/r that varies linearly with charge. This simple model gives good fits to the data and a useful value of the Slater screening constant.
Acknowledgements
This article is dedicated to Professor Buenzli on the occasion of his retirement from the EPFL. Research was supported by the Director, Office of Science, Office of Basic Energy Sciences, and the Division of Chemical Sciences, Geosciences, and Biosciences of the U.S. Department of Energy at LBNL under Contract No. DE-AC02-05CH11231. We thank Dr. Michael Seitz for helpful discussions.