

1 Introduction
Luminescent Cu(I) complexes have attracted increasing attention recently as alternative candidates for photofunctional noble metal complexes such as photosensitizers for solar energy conversion [1,2], luminescence-based sensor materials [3,4], luminescent materials for organic light-emitting diodes [5–8], and luminescent probes of biological systems [9], because they are highly efficient and inexpensive. In addition, the characteristic emission properties of 3d metal complexes are also interesting. For example, highly luminescent Cu(I) complexes often exhibit thermally activated delayed fluorescence (TADF) from the singlet metal-to-ligand charge transfer (1MLCT) state to the corresponding triplet state (3MLCT) when the singlet–triplet energy difference is small (around 1000 cm−1) [10,11]. Previously, Yersin et al. reported that Cu(I) complexes such as [Cu(POP)(NN)] (POP = bis[2-(diphenylphosphino)phenyl]ether, NN = bidentate pyrazolylborate) were efficient TADF emitters for use in OLEDs [12]. The triplet state of Cu(I) complexes can have longer lifetimes than those of noble metal complexes because of the reduced mixing of singlet components resulting from their smaller spin–orbit coupling constant. On the other hand, a long lifetime for the stable excited state should be advantageous for photochemical reactions and sensing. In this context, Mann et al. reported long-lived 3ππ* luminescence from [Cu(isocyanide)2(dmp)]+ (dmp = 2,9-dimethyl-1,10-phenanthroline) in crystals for oxygen gas sensing [4]. These complexes exhibit almost millisecond emission lifetimes, and are efficient dioxygen sensors. Therefore, Cu(I) complexes exhibit versatile properties necessary for photofunctional materials.
Recently, we found that mononuclear Cu(I)–halide complexes, [CuX(PPh3)2(L)] (X = halide ion, PPh3 = triphenylphosphine, L = N-heteroaromatic ligands) exhibit extremely intense luminescence in spite of their simple structures [13,14]: complexes bearing a 4-methylpyridine (4-Mepy), [CuX(PPh3)2(4-Mepy)] show a strong blue emission derived from the 1MLCT state combined with the singlet halide-to-ligand charge transfer (1XLCT) state (i.e. 1(M + X)LCT) at room temperature. We also reported that the mononuclear complexes can be prepared by simply grinding the materials. Furthermore, changing the N-heteroaromatic ligands (L) on the strongly luminescent Cu(I)-iodide complexes [CuI(PPh3)2(L)] (L = pyridine (py), 1,6-naphthyridine (nap), or isoquinoline (iq)) changed the emission wavelength from blue–green to yellow [14]. Although the effect of N-heteroaromatic ligands (L) on the emission wavelength of Cu(I)–halide complexes is well known [15–17], investigations regarding the origin of significant changes in the emission wavelengths have not been described in detail.
In this paper, we aim to understand the effect of N-heteroaromatic ligands on the emission properties of the mononuclear Cu(I)–halide complexes by systematically preparing a series of complexes [CuX(PPh3)2(L)] (Scheme 1; X = Cl−, Br−, or I−; L = py (1-X), iq (2-X), or nap (3-X)) and investigating their photoluminescence properties in detail. To this end, we prepared complexes that are colorful strong emitters with high quantum yields (0.16–0.99), and with emission colors that changed from blue to red depending on the combination of N-heteroaromatic ligand and halide ion.
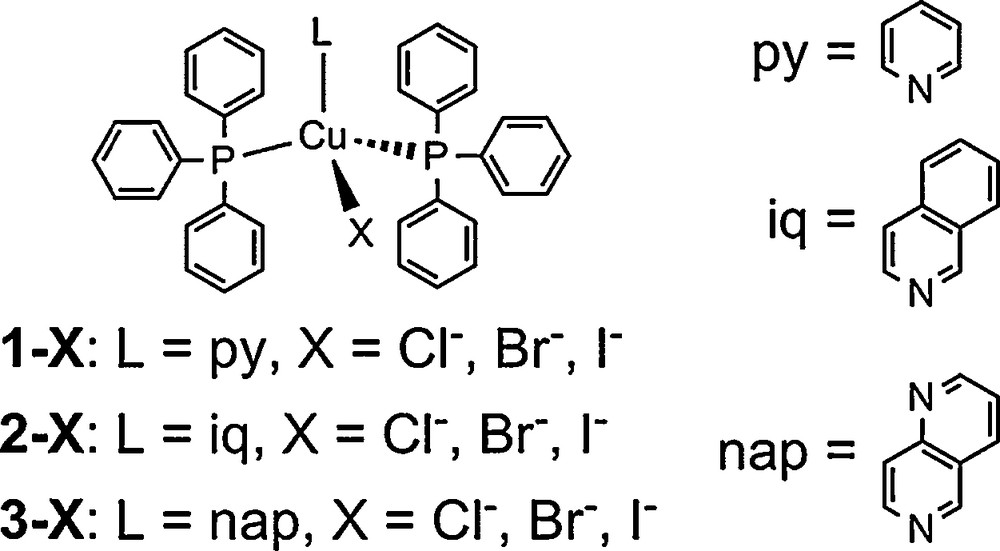
Structure of [CuX(PPh3)2(L)] (X = Cl−, Br−, I−; py = pyridine, iq = isoquinoline, nap = 1,6-naphthyridine).
2 Experimental
2.1 Materials and synthesis
All copper(I) halides, ligands, and solvents available commercially were used as received, without further purification. Unless otherwise stated, all manipulations were conducted in the air. The Cu(I) complexes [CuCl(PPh3)3]·CH3CN [18], [CuBr(PPh3)3] [19], [CuI(PPh3)3] [20] were prepared according to the reported procedures. [CuX(PPh3)2(py)] (1-X, X = Cl−, Br−, or I−) were prepared in the same way and confirmed crystallographically to have the same crystal structures as those reported previously [21]. Synthetic procedures for 3-I are described in our previous report [14]. Although the preparation of [CuI(PPh3)2(iq)] (2-I) is also reported in our previous study [14], we found that polymorphic crystals are produced depending on the amount of PPh3 added (see Section 3.1), which are named as 2-I-α and 2-I-β. The preparation of 2-I-β is described below.
[CuCl(PPh3)2(iq)] (2-Cl). To [CuCl(PPh3)3]·CH3CN (90.4 mg, 0.098 mmol) was added iq (1 mL), and the yellow precipitate was formed. CHCl3 (1 mL) was added to the mixture to dissolve the precipitate. The title compound was obtained as yellow crystals (43.8 mg, 60%) by slow diffusion of diethyl ether vapor into the copper solution for 18 h. Elemental analysis calculated for C45H37CuClNP2: C 71.80, H 4.95, N 1.86; found C 71.86, H 4.74, N 1.91. 1H NMR (270 MHz, CDCl3) δ ppm 7.19–7.44 (m, 30 H) 7.56–7.78 (m, 3 H) 7.82 (d, J = 8.2 Hz, 1 H) 7.94 (d, J = 8.2 Hz, 1 H) 8.53 (s, 1 H) 9.27 (s, 1 H).
[CuBr(PPh3)2(iq)] (2-Br). To a suspension of CuBr (37.5 mg, 0.24 mmol) in iq (1 mL) was added PPh3 (153.8 mg, 0.59 mmol) and the yellow precipitate was formed. CHCl3 (2 mL) was added to the mixture to dissolve the precipitate, and then filtered to remove the green impurity. The title compound was obtained as yellow crystals (128.7 mg, 69%) by slow diffusion of diethyl ether vapor into the copper solution for 14 h. Elemental analysis calculated for C45H37CuBrNP2: C 67.80, H 4.68, N 1.76; found C 67.66, H 4.49, N 1.78. 1H NMR (270 MHz, CDCl3) δ ppm 7.15–7.45 (m, 30 H) 7.57–7.75 (m, 3 H) 7.83 (d, J = 7.9 Hz, 1 H) 7.94 (d, J = 7.6 Hz, 1 H) 8.52 (d, J = 5.6 Hz, 1 H) 9.27 (s, 1 H).
[CuI(PPh3)2(iq)] (2-I-β). To a suspension of CuI (48.9 mg, 0.26 mmol) in iq (1 mL) was added PPh3 (660 mg, 2.5 mmol) and the yellow precipitate was formed. CHCl3 (1 mL) was added to the mixture to dissolve the precipitate. The title compound was obtained as yellow crystals (177.1 mg, 85%) by slow diffusion of diethyl ether vapor into the copper solution for 10 h. Elemental analysis calculated for C45H37CuINP2: C 64.02, H 4.42, N 1.66; found C 64.28, H 4.23, N 1.68. 1H NMR (270 MHz, CDCl3) δ ppm 7.06–7.49 (m, 30 H) 7.58–7.76 (m, 3 H) 7.83 (d, J = 8.2 Hz, 1 H) 7.96 (d, J = 8.2 Hz, 1 H) 8.54 (d, J = 5.9 Hz, 1 H) 9.27 (s, 1 H).
[CuCl(PPh3)2(nap)] (3-Cl) (nap = 1,6-naphthyridine). [CuCl(PPh3)3]·CH3CN (49.6 mg, 0.054 mmol) was dissolved in a CHCl3 solution (1 mL) of nap (100 mg, 0.77 mmol). The title compound was obtained as yellow crystals (20.5 mg, 52%) by slow diffusion of diethyl ether vapor into the copper solution for 3 days. Elemental analysis calculated for C44H36CuClN2P2: C 70.12, H 4.81, N 3.72; found C 70.17, H 4.67, N 3.76. 1H NMR (270 MHz, CDCl3) δ ppm 7.20–7.43 (m, 30 H) 7.56 (dd, J = 8.2, 4.3 Hz, 1 H) 7.93 (d, J = 5.9 Hz, 1 H) 8.26–8.37 (m, 1 H) 8.75 (d, J = 5.9 Hz, 1 H) 9.13 (dd, J = 4.3, 2.0 Hz, 1 H) 9.32 (s, 1 H).
[CuBr(PPh3)2(nap)] (3-Br). [CuBr(PPh3)3] (56.8 mg, 0.061 mmol) was dissolved in a CHCl3 solution (1 mL) of nap (100 mg, 0.77 mmol). The title compound was obtained as yellow crystals (43.1 mg, 89%) by slow diffusion of diethyl ether vapor into the copper solution for 38 h. Elemental analysis calculated for C44H36CuBrN2P2: C 66.21, H 4.55, N 3.51; found C 66.10, H 4.47, N 3.48. 1H NMR (270 MHz, CDCl3) δ ppm 7.13–7.46 (m, 30 H) 7.56 (dd, J = 8.6, 4.3 Hz, 1 H) 7.92 (d, J = 5.9 Hz, 1 H) 8.25–8.36 (m, 1 H) 8.75 (d, J = 5.9 Hz, 1 H) 9.13 (dd, J = 4.3, 2.0 Hz, 1 H) 9.32 (s, 1 H).
2.2 Luminescence measurements
The luminescence spectrum of each sample was measured using a JASCO FR-6600 spectrofluorometer at room temperature. The luminescence quantum yield was recorded on a Hamamatsu Photonics C9920-02 absolute photoluminescence quantum yield measurement system equipped with an integrating sphere apparatus and a 150-W CW xenon light source. An A10095-03 non-luminescent quartz sample holder (Hamamatsu Photonics) was used for the absolute photoluminescence quantum yield measurement in the air. The accuracy of the instrument was confirmed by the measurement of the quantum yield of anthracene in ethanol solution (0.27) [22]. Emission lifetime measurements were conducted by using a Hamamatsu Photonics C4334 system equipped with a streak camera as a photo detector and a nitrogen laser as an excitation light source (λex = 337 nm). A liquid N2 cryostat (Optistat-DN optical Dewar and ITC-503 temperature controller, Oxford Instruments) was used to control the sample's temperature.
The emission decays were analyzed using two exponentials, i.e., I = A1 exp(−t/τ1) + A2 exp(−t/τ2), where τ1 and τ2 are the lifetimes, and A1 and A2 are the pre-exponential factors. For the determination of the radiative and non-radiative rate constants, we used the averaged lifetimes (τav), which were estimated based on equation (1) for the two exponential decay components [23]:
| (1) |
2.3 Single-crystal X-ray diffraction measurements
All single-crystal X-ray diffraction measurements were conducted using a Rigaku Mercury CCD diffractometer with graphite monochromated Mo Kα radiation (λ = 0.71069 Å) and a rotating anode generator. Each single crystal was mounted on a MicroMount using paraffin oil. The crystal was then cooled using a N2-flow-type temperature controller. Diffraction data were collected and processed using the CrystalClear software [24]. Structures were solved by the direct method using SIR-2004 [25]. Structural refinements were conducted by the full-matrix least-squares method using SHELXL-97 [26]. Non-hydrogen atoms were refined anisotropically, and hydrogen atoms were refined using the riding model. All calculations were conducted using the Crystal Structure crystallographic software package [27]. Crystallographic data obtained for each complex are summarized in Table 1.
Crystal parameters and refinement data.
| 2-Cl | 2-Br | 2-I-α [14] | 2-I-β | |
| T/K | 200 (1) | 200 (1) | 200 (1) | 200 (1) |
| Formula | C45H37ClCuNP2 | C45H37BrCuNP2 | C45H37ICuNP2 | C45H37ICuNP2 |
| Formula weight | 752.74 | 797.19 | 844.19 | 844.19 |
| Crystal system | Triclinic | Monoclinic | Monoclinic | Monoclinic |
| Space group | P21/n | P21/c | P21/n | |
| a/Å | 9.694(3) | 9.9964(7) | 10.313(3) | 10.0363(10) |
| b/Å | 13.320(4) | 36.138(2) | 18.345(5) | 35.870(4) |
| c/Å | 15.401(4) | 11.2964(8) | 20.464(5) | 11.5526(10) |
| α/° | 83.360(9) | 90 | 90 | 90 |
| β/° | 79.997(9) | 114.671(2) | 93.496(3) | 114.936(3) |
| γ/° | 77.599(9) | 90 | 90 | 90 |
| V/Å3 | 1906.4(9) | 3708.4(5) | 3864.3(16) | 3771.2(7) |
| Z | 2 | 4 | 4 | 4 |
| Dcal/g·cm−3 | 1.311 | 1.428 | 1.296 | 1.487 |
| Reflections collected | 15589 | 22,699 | 27,817 | 21,108 |
| Unique reflections | 8633 | 8252 | 8328 | 8416 |
| Rint | 0.0542 | 0.0398 | 0.0450 | 0.0377 |
| GOF | 1.004 | 1.088 | 1.109 | 1.193 |
| R1 (I > 2σ(I))a | 0.0514 | 0.0422 | 0.0541 | 0.0353 |
| wR2b | 0.1271 | 0.0915 | 0.1450 | 0.0944 |
| 3-Cl | 3-Br | 3-I [14] | ||
| T/K | 200 (1) | 200 (1) | 200 (1) | |
| Formula | C44H36ClCuN2P2 | C44H36BrCuN2P2 | C44H36ICuN2P2 | |
| Formula weight | 753.73 | 798.18 | 845.18 | |
| Crystal system | Monoclinic | Monoclinic | Monoclinic | |
| Space group | P21/n | P21/n | P21/n | |
| a/Å | 9.8962(8) | 9.906(2) | 9.9705(7) | |
| b/Å | 36.755(2) | 36.302(8) | 35.823(2) | |
| c/Å | 11.1003(10) | 11.286(3) | 11.5829(7) | |
| α/° | 90 | 90 | 90 | |
| β/° | 114.926(4) | 114.563(2) | 114.770(2) | |
| γ/° | 90 | 90 | 90 | |
| V/Å3 | 3661.5(5) | 3691(2) | 3756.5(4) | |
| Z | 4 | 4 | 4 | |
| Dcal/g·cm−3 | 1.367 | 1.436 | 1.494 | |
| Reflections collected | 39,704 | 22,761 | 23,121 | |
| Unique reflections | 8323 | 8137 | 8355 | |
| Rint | 0.0346 | 0.0304 | 0.0425 | |
| GOF | 1.078 | 1.263 | 1.193 | |
| R1(I > 2σ(I))a | 0.0377 | 0.0396 | 0.0358 | |
| wR2b | 0.0857 | 0.1049 | 0.0864 |
a R1 = Σ||Fo| − |Fc||/Σ|Fo|.
b wR2 = [Σw(Fo2 − Fc2)/Σw(Fo)2]1/2, w = [σc2(Fo2) + (xP)2 + yP]−1, P = (Fo2 − 2Fc2)/3.
2.4 Characterization measurements
The 1H NMR spectrum of each sample was measured using a JEOL EX-270 NMR spectrometer at room temperature. Elemental analysis was conducted at the analysis center at Hokkaido University.
2.5 Theoretical calculations
DFT calculations were performed with the B3LYP functional [28,29] and the LANL2DZ basis [30,31] set using Gaussian 03 [32] for 1-Cl, 1-Br, 2-Cl, 2-Br, 2-I-β, 3-Cl, and 3-Br. As for the calculations of 1-I, 2-I-α, and 3-I, we have already reported the results using the same functional and basis set [14]. The atomic coordinates determined for the individual molecular structures by X-ray crystallographic analysis were used for the DFT calculations. The drawing of molecular orbitals for the complexes were made using Avogadro 1.10 [33].
3 Results and discussion
3.1 Crystal structures
Figs. 1 and 2 show the molecular structures of 2-X and 3-X (X = Cl−, Br−, I−), respectively. Crystal structures of 1-X prepared herein were identical to those reported by Engelhardt et al. [21]. All complexes adopt a tetrahedral coordination geometry occupied by one halide, one N atom of the N-heteroaromatic ligand, and two P atoms of the PPh3 ligands. Selected bond lengths and angles around the copper(I) atom of 2-X and 3-X are listed in Table 2. For complex 2-I, two polymorphic crystal structures (2-I-α and 2-I-β) were obtained. Structure 2-I-α was crystallized from the isoquinoline/chloroform solution including a 1:2 ratio of CuI and PPh3 [14], while 2-I-β was obtained from the isoquinoline/chloroform solution including 1:10 ratio of CuI and PPh3. The important difference between the polymorphic forms of 2-I-α and 2-I-β is the cell volume. The volume of 2-I-α (3864(2) Å3) is larger by about 100 Å3 than that of 2-I-β (3771.2(7) Å3) in spite of both polymorphs having the same chemical formula. The larger cell volume of 2-I-α, with a loosely packed structure, is expected to allow structural relaxation in the excited state more effectively than 2-I-β (see 3.2.2.). There can be seen another notable difference between the conformation of the iq ligand for 2-Cl and the other complexes 2-X (X = Br− and I−). The C37 carbon atoms at 3-position of iq are oriented in the direction of the halide anion for 2-Br and 2-I, while 2-Cl adopts an inverted orientation, which is probably a steric effect of the larger halides of 2-Br and 2-I. Interestingly, the complexes of 3-X, 2-Br, and 2-I-β were found to be isomorphous to each other. Although 3-Cl has a similar molecular structure to 2-Cl, the crystal structure of 3-Cl is different from that of 2-Cl. The Cu-X bond of 3-Cl is shorter than that of 2-Cl (2.3330(9) Å for 2-Cl, 2.312(1) Å for 3-Cl) and the Cu-N bond of 3-Cl is longer than that of 2-Cl (2.091(3) Å for 2-Cl, 2.125(3) Å for 3-Cl). The shorter Cu-X and longer Cu–N bonds of 3-Cl indicate steric repulsion between the Cl ion and nap ligand. Thus, the steric repulsion between the chloride ion and nap ligand likely causes the differences in the crystal structures between 2-Cl and 3-Cl.
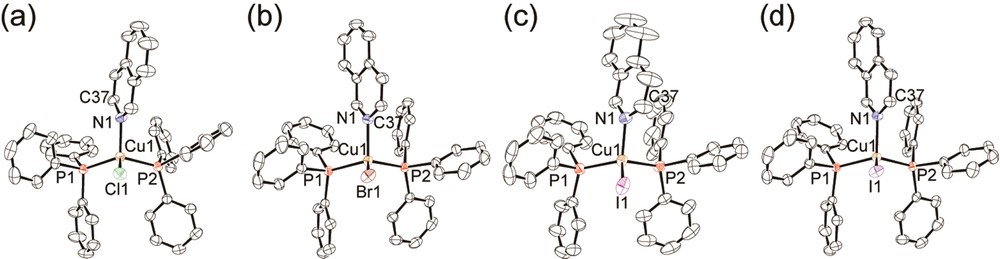
(Color online.) ORTEP drawings of 2-Cl (a), 2-Br (b), 2-I-α (c) [14], and 2-I-β (d). Hydrogen atoms are omitted for clarity. Displacement parameters are drawn at the 50% probability level.
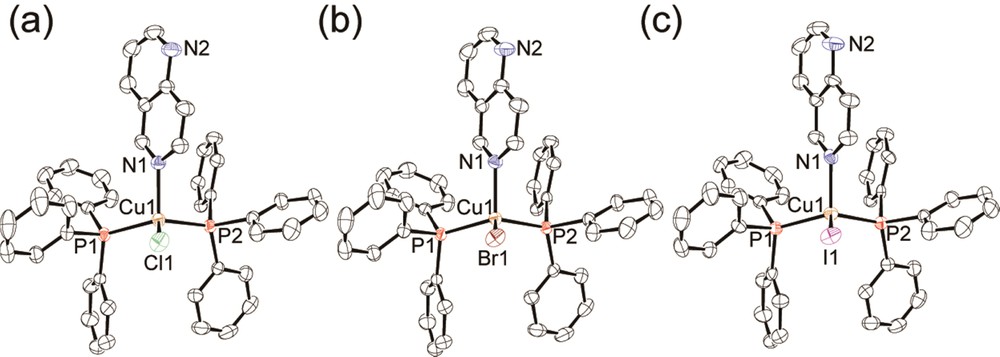
(Color online.) ORTEP drawings of 3-Cl (a), 3-Br (b), and 3-I (c) [14]. Hydrogen atoms are omitted for clarity. Displacement parameters are drawn at the 50% probability level.
Selected bond distances (Å) and bond angles (°) around copper(I) ions in the complexes 2-X and 3-X.
| 2-Cl | 2-Br | 2-I-α [14] | 2-I-β | |
| Cu–X | 2.3330(9) | 2.4546(6) | 2.6514(8) | 2.6288(5) |
| Cu–N | 2.091(3) | 2.122(2) | 2.125(4) | 2.120(2) |
| Cu–P1 | 2.249(1) | 2.2830(8) | 2.271(1) | 2.2858(8) |
| Cu–P2 | 2.2671(8) | 2.2781(8) | 2.287(1) | 2.2807(8) |
| X–Cu–P1 | 104.32(3), | 104.85(3) | 101.50(4) | 103.90(3) |
| X–Cu–P2 | 106.79(3) | 116.11(3) | 113.50(4) | 116.42(3) |
| X–Cu–N | 99.01(7) | 101.78(8) | 108.2(1) | 101.93(8) |
| X–Cu–N–C (L) | 25.5(2) | 34.7(2) | 40.2(3) | 32.3(2) |
| 3-Cl | 3-Br | 3-I [14] | ||
| Cu–X | 2.312(1) | 2.4520(8) | 2.6307(5) | |
| Cu–N | 2.125(3) | 2.123(2) | 2.122(2) | |
| Cu–P1 | 2.2712(9) | 2.2758(9) | 2.2819(7) | |
| Cu–P2 | 2.2709(9) | 2.2741(9) | 2.2821(8) | |
| X–Cu–P1 | 105.27(3) | 104.27(3) | 103.58(3) | |
| X–Cu–P2 | 115.92(3) | 116.33(3) | 116.93(3) | |
| X–Cu–N | 102.43(6) | 102.22(8) | 102.14(7) | |
| X–Cu–N–C (L) | 40.8(1) | 37.3(2) | 32.3(2) |
3.2 Emission properties
3.2.1 Complexes 1-X (X = Cl−, Br−, I−)
Fig. 3 shows the emission spectra of 1-X at 298 K and 77 K in the crystals, and the photophysical parameters of 1-X are summarized in Table 3. Complexes 1-X exhibit blue-green light emissions when they are excited with UV light, and the emission maxima at 298 K were observed at 498, 483, and 485 nm for 1-Cl, 1-Br, and 1-I, respectively. All spectra of 1-X at both 298 and 77 K are broad without vibronic progressions, indicating that the emissive excited states have a charge-transfer character in this temperature range. Each emission spectrum measured at 77 K shifted to lower energies by ca. 540–850 cm−1 than the corresponding spectrum measured at 298 K. Interestingly, the luminescence quantum yields of 1-X in crystals were found to be extremely high (0.98, 0.95, and 0.99 for 1-Cl, 1-Br, and 1-I, respectively) although the measurements in solution were difficult because of the ligand-dissociation and/or the dimerization as usual for mononuclear Cu(I) complexes [13]. The emission lifetimes of complexes 1-X in the crystals were estimated to be in the range from several microseconds to several tens of microseconds by least-square fitting of the emission decays (see Experimental). These emission properties of complexes 1-X are similar to those of [CuX(PPh3)2(4-Mepy)], whose emission properties were characterized as delayed fluorescence at room temperature [13]. Therefore, the luminescence of complexes 1-X could have a similar origin. The different radiative rate constants (kr) at 298 K and 77 K, kr values at 298 K are several times larger than that at 77 K, suggest that luminescence of 1-X may be assigned to delayed fluorescence at room temperature.
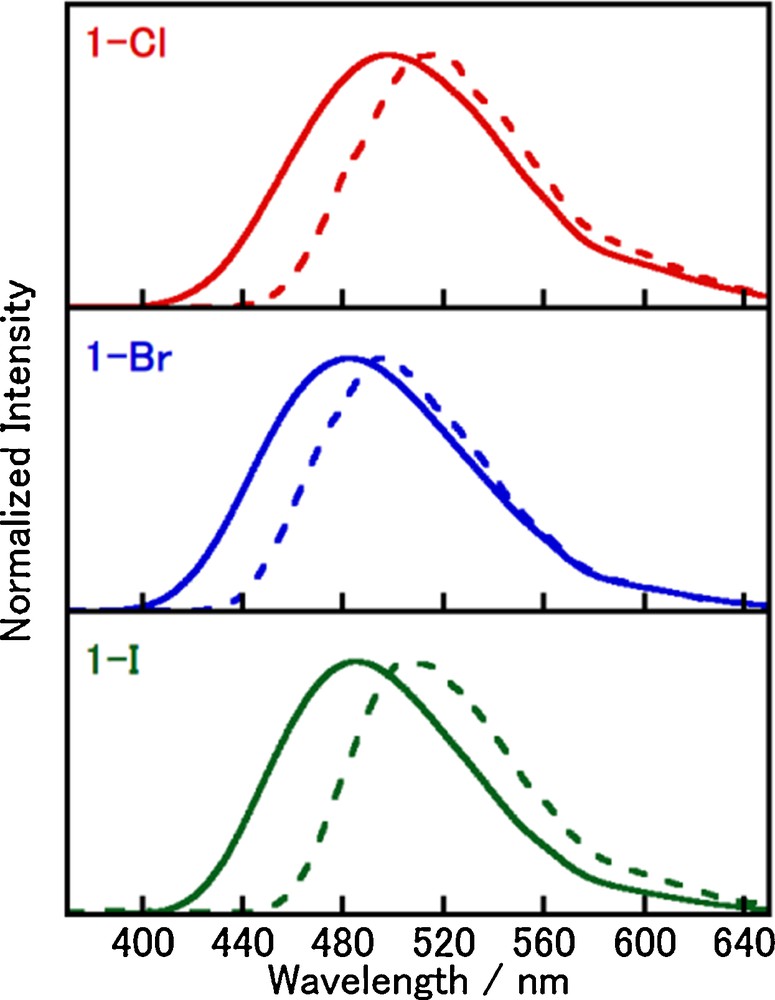
(Color online.) Luminescence spectra of 1-X in the crystals (λex = 350 nm) at 298 K (solid line) and 77 K (dotted line).
Luminescence properties of complexes 1-X, 2-X, and 3-X in the crystals at 298 K and 77 K.
| Compound | 1-Cl | 1-Br | 1-I | |||||
| 298 K | 77 K | 298 K | 77 K | 298 K | 77 K | |||
| λmaxa(nm) | 498 | 516 | 483 | 496 | 48g | 506 | ||
| τ (μs (An))b | 3.3 (0.13) 12.5 (0.89) | 7.5 (0.12) 27.4 (0.88) | 21.1 (0.84) 27.0 (0.14) | 40.0 (0.43) 53.6 (0.57) | 10 (0.21) 20 (0.82)g | 28 (0.14) 94 (0.84) | ||
| Φc | 0.98 | 0.89 | 0.95 | 0.93 | 0.9g | 0.99 | ||
| τavd(μs) | 12 | 27 | 22 | 49 | 19 | 91 | ||
| kre(s−1) | 8.0·104 | 3.3·104 | 4.3·104 | 1.9·104 | 5.2·104 | 1.1·104 | ||
| knrf(s−1) | 1.6·103 | 4.1·103 | 2.2·103 | 1.4·103 | 5.3·102 | 1.1·102 | ||
| Compound | 2-Cl | 2-Br | 2-I-α | 2-I-β | ||||
| 298 K | 77 K | 298 K | 77 K | 298 K | 77 K | 298 K | 77 K | |
| λmaxa(nm) | 491, 515, 553 | 476, 488, 511, 522, 549 | 554 | 486, 497, 507, 520, 532, 561 | 53g | 486, 521, 561, 610 | 487, 520, 558 | 484, 496, 520, 532, 561, 607 |
| τ (μs (An))b | 154 (0.60) 616 (0.48) | 227 (0.49) 1436(0.54) | 73 (0.58) 165 (0.47) | 152 (0.84) 825 (0.23) | 27 (0.54) 78 (0.52)g | 123 (0.94) 534 (0.18) | 79 (0.74) 493 (0.30) | 126 (0.86) 777 (0.23) |
| Φc | 0.77 | 0.56 | 0.46 | 0.20 | 0.6g | 0.51 | 0.65 | 0.50 |
| τavd(μs) | 506 | 1285 | 132 | 553 | 65 | 310 | 376 | 528 |
| kre(s−1) | 1.5·103 | 4.4·102 | 3.5·103 | 3.6·102 | 9.8·103 | 1.6·103 | 1.7·103 | 9.5·102 |
| knrf(s−1) | 4.5·102 | 3.4·102 | 4.1·103 | 1.4·103 | 5.7·103 | 1.6·103 | 9.3·102 | 9.5·102 |
| Compound | 3-Cl | 3-Br | 3-I | |||||
| 298 K | 77 K | 298 K | 77 K | 298 K | 77 K | |||
| λmaxa(nm) | 636 | 674 | 608 | 634 | 571g | 585 | ||
| τ (μs (An))b | 0.32 (0.12) 1.5 (0.91) | 3.8 (0.20) 14.4 (0.84) | 1.6 (0.29) 3.6 (1.6) | 21.9 (0.033) 61.9 (0.97) | 4.7 (0.87)g 6.3 (0.14) | 46.2 (0.16) 62.7 (0.84) | ||
| Φc | 0.16 | 0.08 | 0.44 | 0.25 | 0.7g | 0.63 | ||
| τavd(μs) | 1.5 | 14 | 3.5 | 38 | 5.0 | 73 | ||
| kre(s−1) | 1.1·105 | 5.8·103 | 1.2·105 | 6.6·103 | 1.5·105 | 8.9·103 | ||
| knrf(s−1) | 5.7·105 | 6.7·104 | 1.6·105 | 2.0·104 | 5.3·104 | 5.2·103 |
a Emission maximum.
b Emission lifetime. Emission decays were analyzed with two components: I = A1 exp(−t/τ1) + A2 exp(−t/τ2).
c Photoluminescence quantum yields in the solid states.
d Average emission lifetimes were determined by using Eq. (1).
e Radiative rate constants kr were estimated by Φ/τav.
f Nonradiative rate constants knr were estimated by kr(1 − Φ)/Φ.
g Ref. [14].
To clarify the emission properties in detail, the temperature dependence of the emission lifetimes of complexes 1-X was investigated. As shown in Fig. 4, the lifetimes of complexes 1-X changed gradually in the low-temperature region. However, a sharp decrease in the lifetime was observed with increasing temperature above 170 K. Assuming a two-state model involving the lowest excited singlet state (S1) and the lowest excited triplet state (T1), the observed lifetime can be expressed as a Boltzmann average by using equation (2) [11,34–36],
| (2) |
| (3) |
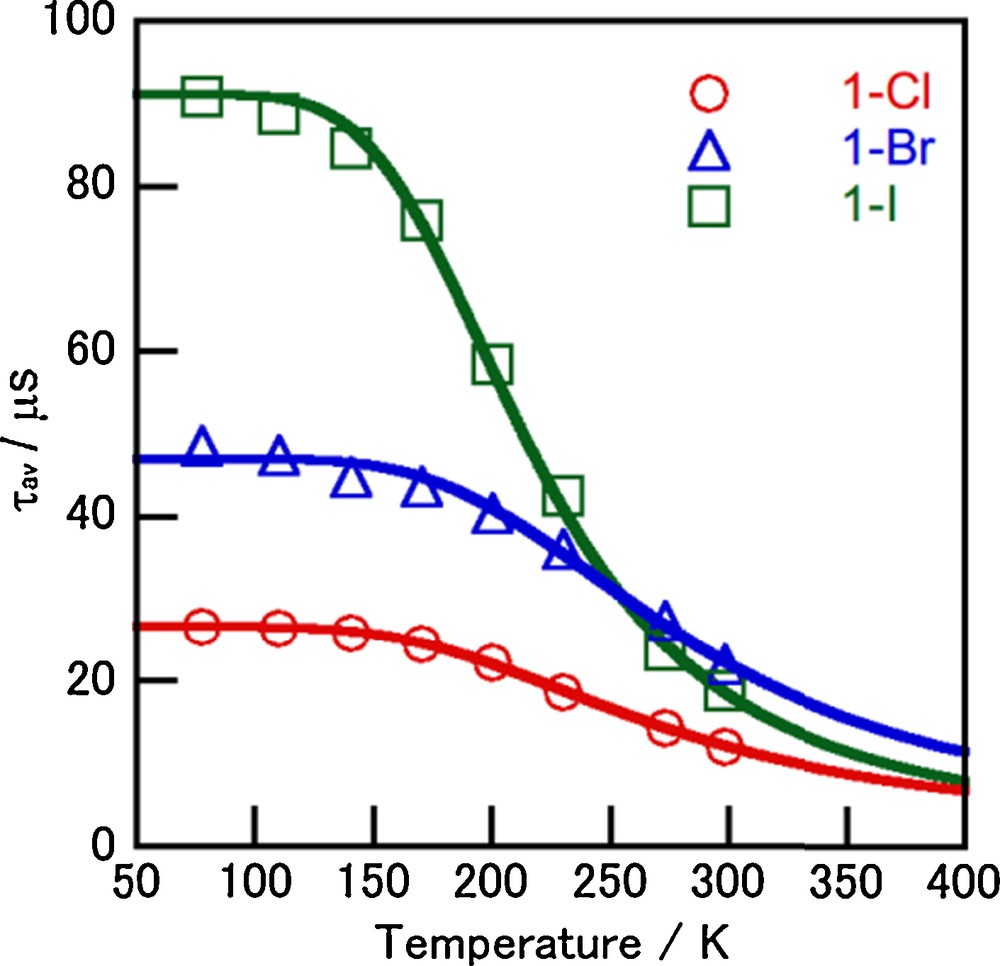
(Color online.) Temperature dependence of the average emission lifetimes of complexes 1-X in the crystals (λex = 337 nm). The solid lines were calculated by using Eq. (2).
3.2.2 Complexes 2-X (X = Cl−, Br−, I−)
Fig. 5 shows the emission spectra of 2-X at 298 K and 77 K in the crystals. In contrast to the spectra of 1-X, those of 2-X exhibit vibronic structures except for those of 2-Cl and 2-I-β at 298 K, which suggests 3ππ* character of the luminescence. The longer lifetimes (300–1300 μs at 77 K) for 2-X compared to those found for 1-X support this assignment. The order of kr at 77 K ([4.4, 3.6, 9.5, and 16] × 102 s−1 for 2-Cl, 2-Br, 2-I-β, 2-I-α, respectively) show a normal trend of the heavy atom effect of the halide ions. Furthermore, complexes 2-Cl and 2-I-β exhibit rather long lifetimes even at room temperature (506 and 376 μs, respectively), which is consistent with the spectral profiles of the vibronic structures. On the other hand, the broad spectra of 2-Br and 2-I-α can be assigned to an emission from the triplet CT state because of their shorter lifetimes (132 and 65 μs, respectively) compared to those of 2-Cl and 2-I-β at 298 K. Thus, the complexes 2-X bearing an isoquinoline are interesting systems with competitive emission states between the triplet CT and 3ππ*. It is noteworthy that the two polymorphic forms 2-I-α and 2-I-β provide different emission spectra at 298 K, although the structured spectra at 77 K are essentially the same. As discussed in the crystal structures section, the cell volume of 2-I-α is ca. 100 Å3, which is larger than that of 2-I-β, which suggests that structural relaxation could occur more effectively in the excited state. Structural relaxation in the excited state probably stabilizes the CT excited state more effectively than in the ππ* state, because the MLCT excited state for tetrahedral Cu(I) complexes is liable to flattening distortion resulting in the broad emission spectrum observed for 2-I-α at 298 K. The emission wavelength of 2-Br is longer than that of 2-I, indicating that the emission energy depends on the halide anion as observed for the charge-transfer type emissions of halide-bridged dinuclear complexes [15]. Therefore, the CT excited state of 2-Br is more stabilized than the excited state of 2-I, which results in the broad emission spectrum of 2-Br. In addition, 1-X and 2-X also exhibit relatively high luminescence quantum yields (0.44–0.73) at 298 K; however, the values decreased to 0.20–0.51 at 77 K. The reverse trend in the quantum yields supports the contribution to the emission from different emission states (i.e. 3ππ* and 3(M + X)LCT) at 298 K, although the emission occurs from only 3ππ* state at 77 K.
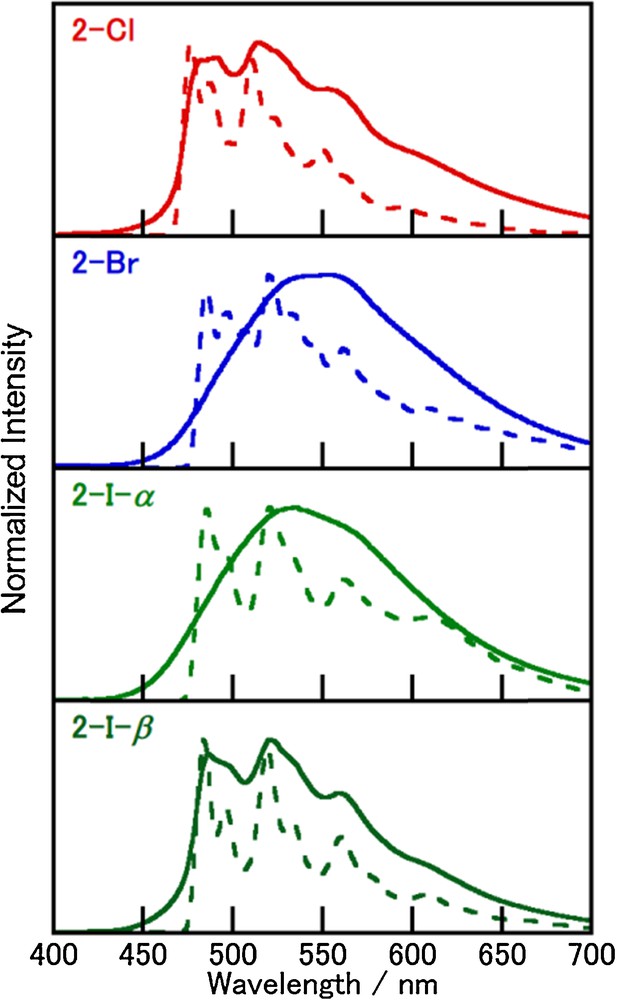
(Color online.) Luminescence spectra of 2-X in the crystals (λex = 370 nm) at 298 K (solid line) and 77 K (dotted line).
3.2.3 Complexes 3-X (X = Cl−, Br−, I−)
Fig. 6 shows the emission spectra of 3-X at 298 K and 77 K in the crystals. The spectral profiles of 3-X are similar to those of 1-X, suggesting that the emission occurs from the triplet CT state, although the emission maxima appear at much longer wavelengths (571, 608, and 636 nm for 3-I, 3-Br, and 3-Cl, respectively). In contrast to 1-X and 2-X, the emission wavelengths of 3-X clearly show the halide-ligand dependence. The order of the emission wavelengths is consistent with the increasing ligand field strength of the halide ion in the complexes (I− < Br− < Cl−). This trend is similar to that observed for the charge-transfer type emissions of halide-bridged dinuclear complexes [8,17,35]. Lower energy shifts (420–890 cm−1) in the emission spectra at 77 K again suggest the contribution from delayed fluorescence at 298 K.
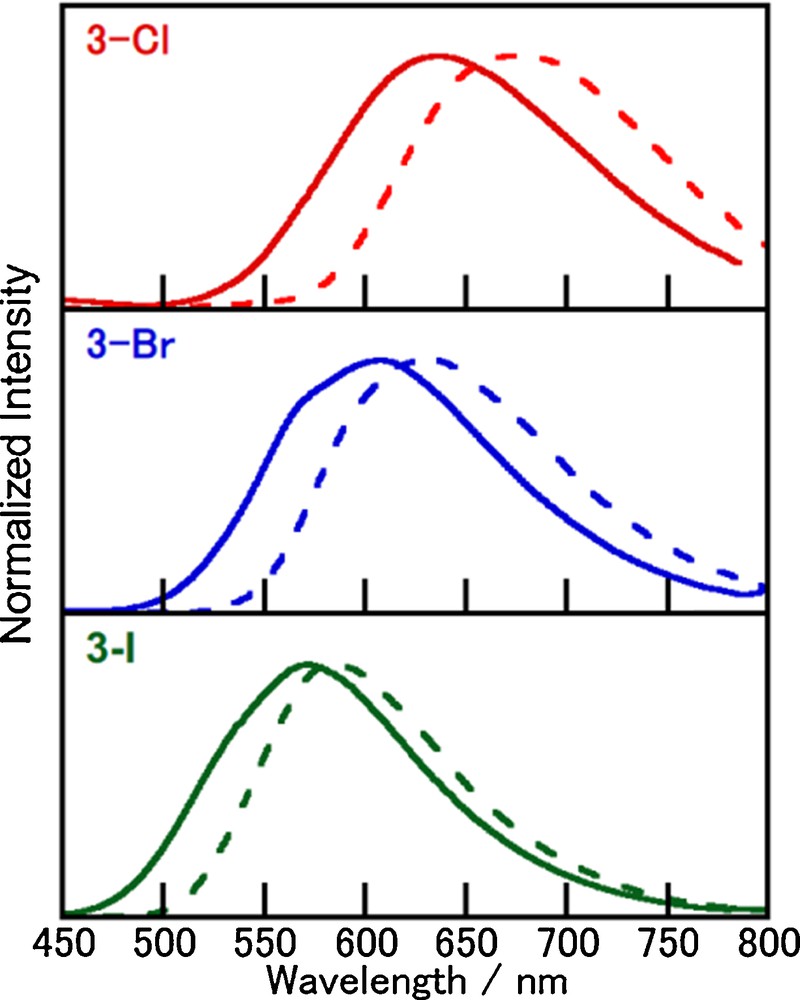
(Color online.) Luminescence spectra of 3-X in the crystals (λex = 400 nm) at 298 K (solid line) and 77 K (dotted line).
One additional characteristic found for 3-X is the trend of the emission quantum yield decreases drastically in the order of 3-I, 3-Br, and 3-Cl (0.77, 0.44, and 0.16, respectively), which may be explained by the energy gap law [37,38]. As shown in Fig. 7, the plots of ln(knr) vs. wavenumber at the emission maxima roughly exhibit a linear relation. The decrease in emission quantum efficiency with decreasing emission energy is interesting since competing nonradiative processes become more relevant (vide infra). The lower luminescence quantum yields at 77 K (0.08 for 3-Cl, 0.25 for 3-Br, and 0.63 for 3-I) compared with those at 298 K suggest that the emissive states at room temperature and low temperature are different than in the case of 1-X.
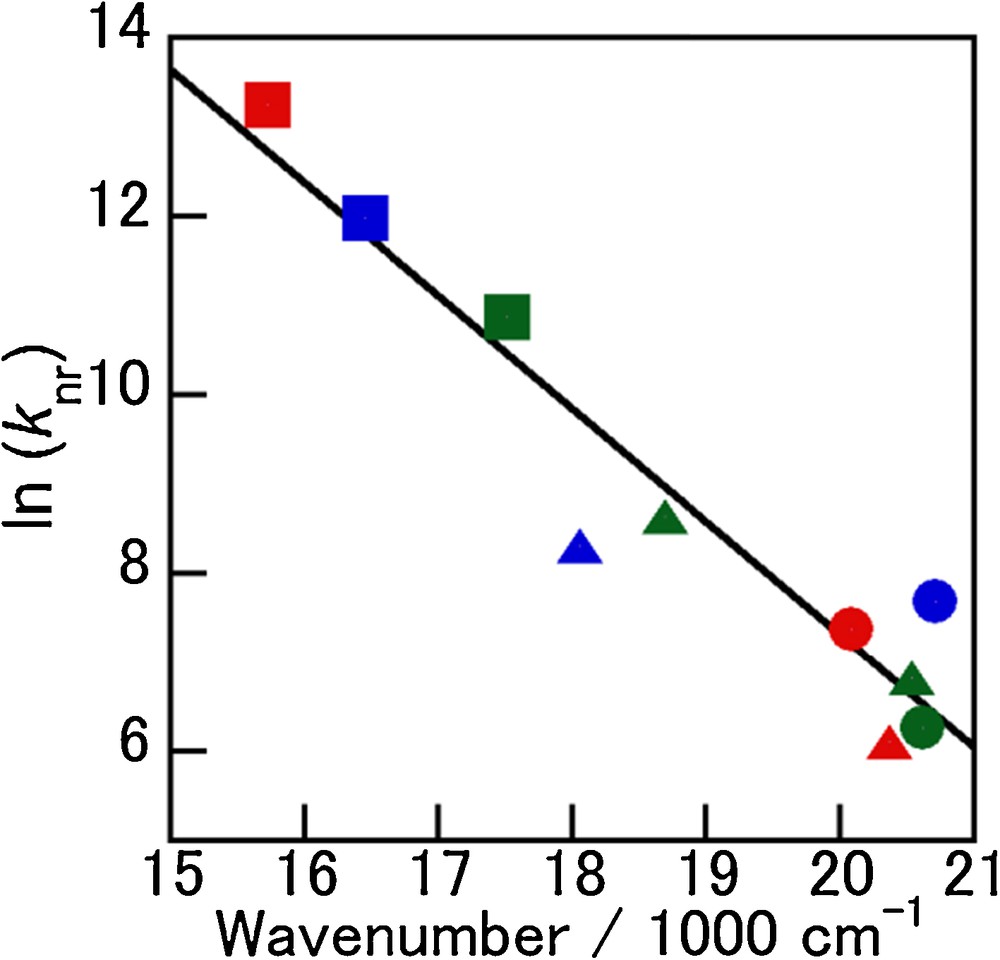
(Color online.) Plots of ln(knr) vs. the wavenumber of 1-X − 3-X at the emission maxima; circle: L = py, triangle: L = iq, square: L = nap, red: X = Cl−, blue: X = Br−, green: X = I−.
As shown in Fig. 8, a two-state analysis of the temperature dependence of averaged emission lifetime for 3-X is presented in the same way as that described for 1-X. The results for 3-X as well as 1-X are summarized in Table 4. The ΔE values (550–710 cm−1) for 3-X are roughly consistent with the spectral shifts of ∼1000 cm−1 between 298 and 77 K, which indicates that the two-state model is reasonable for this temperature region. The luminescent singlet components of 3-X were estimated to be 93–94% at 298 K by using equation (3), which indicates that 3-X emit mainly from the singlet state at room temperature.
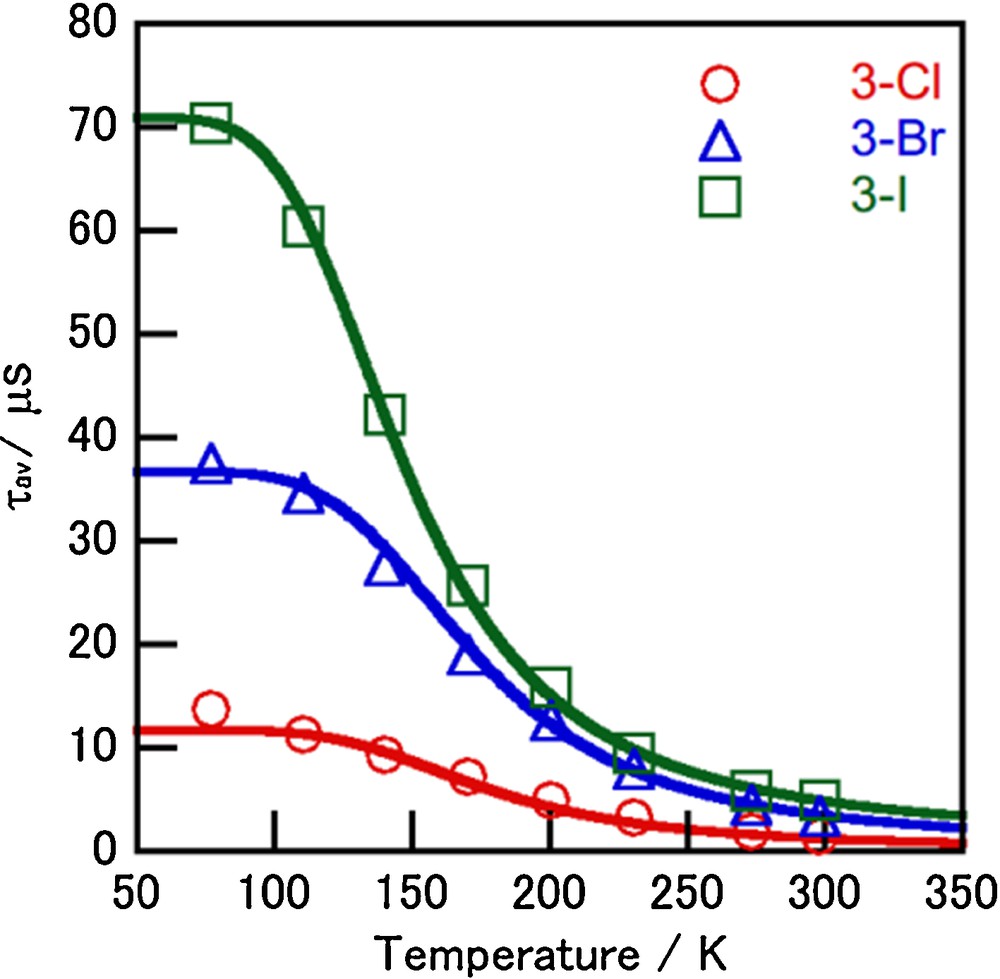
(Color online.) Temperature dependence of the average emission lifetime of complexes 3-X in the crystals (λex = 337 nm). The solid lines were calculated by using Eq. (2).
3.3 Luminescence mechanism
Scheme 2 shows the schematic energy level diagram of complexes 1-X–3-X. For 1-X, the 1(M + X)LCT state is easily thermally accessible from the 3(M + X)LCT emissive state at room temperature because the ΔE between these states is small. However, the luminescent singlet components of 1-X are only 53–80%. This is probably due to the large phosphorescent rate constant of 1-X; thus the delayed fluorescent process competes with the phosphorescent process. Therefore, 1-X emits light from both the 1(M + X)LCT and 3(M + X)LCT states at room temperature. At low temperatures, on the other hand, complexes 1-X emit phosphorescence from the 3(M + X)LCT state because the thermally activation to 1(M + X)LCT state is suppressed. Complexes 3-X also exhibit similar emission behavior and the luminescent singlet components of 3-X are almost 100%. Therefore, complexes 3-X mainly emit delayed fluorescence from the 1(M + X)LCT state at room temperature. In contrast to 1-X and 3-X, the origins of the emission of 2-X are different. The emission studies clearly indicate the involvement of the 3ππ* state in the emission states of 2-X, although the TD-DFT calculations corresponding to the light absorption process suggest that the lowest singlet excited states are all the (M + X)LCT state, including those of 2-X (see Supporting Information). It is interesting to note that the ππ* (L) transition energies of 1-I − 3-I (HOMO-20 to LUMO, HOMO-5 to LUMO, and HOMO-13 to LUMO for 1-I, 2-I, and 3-I, respectively) are different from each other (6.512, 4.804, and 4.900 eV for 1-I, 2-I, and 3-I, respectively). Thus the ππ*(L) transition energies are relatively small for 2-X, which are consistent with those of the free ligand L [39–42]. The small energy difference for 2-I suggests that the (M + X)LCT state and the ππ* state of 2-I are more accessible to each other than those of 1-I and 3-I. Experimentally the phosphorescence maximum of the iq ligand is observed at 520 nm [41,42] and the emission maxima of 2-I is 520–530 nm, which proves that the 3(M + X)LCT and 3ππ* states of 2-I should be close in energy and can be thermally accessible to each other, although the 3ππ* levels of 1-I and 3-I are much higher than the 3(M + X)LCT levels. The characteristic properties of 2-I appeared as the different emission spectra between the two morphs of 2-I (α and β) at room temperature. The difference in the flexibility between them in the crystal could give rise to the different spectral features as discussed in section 3.2.2; more flexible 2-I-α can be relaxed structurally forming more stabilized 3(M + X)LCT state.
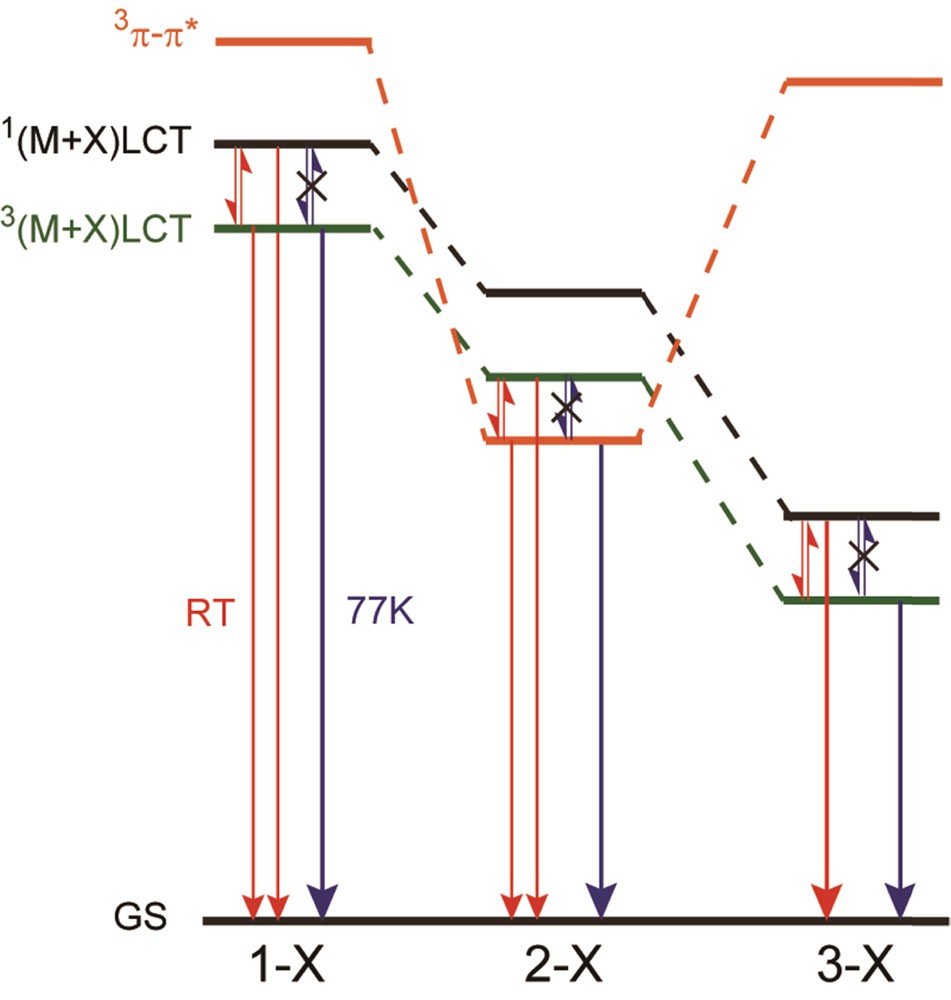
(Color online.) Schematic energy diagram for the emissive excited states of 1-X, 2-X, and 3-X.
4 Conclusion
The luminescent properties of mononuclear copper(I)–halide complexes with a N-heteroaromatic ligand, [CuX(PPh3)2(L)] (X = Cl−, Br−, I−; L = py, iq, nap), were investigated in detail. All of the synthesized complexes exhibit high luminescence quantum yields (0.16–0.99), and the emission color varies from red to blue by changing L and the halide ligands. Our emission studies, including lifetime analysis, revealed that the emissions of complexes 1-X occur from both the singlet and triplet (M + X)LCT states, and those of complexes 3-X occur mainly from the singlet state at room temperature. In contrast to 1-X and 3-X, emissions of complexes 2-X occur from both the 3ππ* excited state and the 3(M + X)LCT state at 298 K. At 77 K, the emissions of complexes 2-X occur from only the 3ππ* ligand excited states because repopulation of 3(M + X)LCT from the 3ππ* ligand excited states are suppressed. This study elucidated that the mononuclear Cu(I) complexes with the ternary ligand system provide simple but highly luminescent materials that can easily change the emission color by the choice of halide and N-heteroaromatic ligands. Further studies concerning the functionalities of these complexes are in progress.
Acknowledgements
This work was partially supported by Grants-in-Aid for Scientific Research (B) (23350025), Artificial Photosynthesis (No. 2406), Young Scientists (B) (24750049) from the Ministry of Education, Culture, Sports, Science and Technology (MEXT), Japan.