

1 Introduction
In the textile dyeing process, a significant amount of the dye is remaining in the discharged colored effluents [1–3]. Textile dyeing industries use mainly reactive dyes, which have various chemical structures and compositions, and are not easily degradable [4]. Therefore, to preserve the environment, it is essential to treat textile effluents by using the low cost processes.
Dye removal from polluted water was carried out by various methods such as biological treatment [5], coagulation/flocculation [5,6], ozone treatment [6,7], chemical oxidation and photocatalytic processes [8], membrane processes [6,9,10], and adsorption [6,11]. The adsorption is the most commonly used method because of its easy handling and because it allows one to remove pollutants even from solutions having low pollutant concentration. Furthermore, adsorption is a widely used method, and many researches are devoted to design innovative adsorbent materials that are efficient and less expensive. Clays are abundant, develop large surface areas, and are inexpensive. These material characteristics make the clays suitable adsorbents for sustainable treatment of the textile effluents. Furthermore, owing to their surface charges and their porous and layered structures, the clays were found to be efficient adsorbents for the removal of the organic or inorganic pollutants from wastewater [12,13]. It should be noted that aqueous dispersions of clay may be tuned to neutral, negatively, or positively charged particles, and they may be used for the treatment of wastewater containing neutral or ionic species such as metals, cationic, anionic, and neutral molecules. Recently, we have shown that clay particles, despite their negative permanent structural charge, are able to remove negatively charged dyes from water, and consequently to discolor effluents [14,15a]. Moreover, upon the adsorption of dye molecules from water onto the clay surface, an alteration of the solid wettability may be expected [16–18]. Such molecular additive adsorption on the clay surface may in turn affect the phase behavior, rheology, and floatability of the aqueous dispersion of clay [19]. Moreover, various parameters can be tuned to control the dye adsorption onto clay particles, such as the dye concentration, temperature, nature, concentration of the electrolyte, and pH of the medium. It should be emphasized that in aqueous medium the dye adsorption on the clay surface is controlled mainly by the structure of electrical double layer (EDL) occurring at the solid–water interface. Therefore, it is important to take into account the factors affecting surface charge development at the solid–water interface.
The aim of the present work was to study and compare the decolorizing potential of clays of different species by focusing on an anionic dye used in the textile industry. We carried out both batch adsorption experiments of an anionic dye from water onto the clay surface and electrokinetic behavior measurements of the clay covered by the dye molecules' aqueous dispersions.
1.1 Development of surface charges and EDL at clay–water interface
When a solid phase is put in contact with a liquid phase, a distribution of electrical charges occurs between the two phases. For instance in an organic medium, the charge development at interfaces results from the differences in the affinity of the two phases for the electrons [20]. However, in aqueous medium, the charge development at interfaces results from selective adsorption of organic or inorganic ions, ionization of surface groups (inorganic oxides), or isomorphous substitutions in the lattice (aluminosilicate clay minerals). The arrangement of charges on the solid surface phase and in the water phase is referred to as the EDL for a solid negatively charged in contact with water. Various models of the EDL at solid–aqueous interfaces have been proposed [20,21]. In these models, the electrolyte ions are regarded as point charges and the solvent is considered as a structureless dielectric of constant permittivity. Furthermore, the electrostatic potential is assumed to obey Poisson's equation and short-range interactions occur near the solid surface between the ions, the wall, and the adjoining water dipoles. Moreover, in these models the local ions density are calculated by using Boltzmann equations. The Stern model is more appropriate for studying the adsorption of molecules at solid–water interface [22]. According to this model, the space charge in the electrolyte solution is divided in two regions:
- (1) An inner region near the wall (compact Stern layer) where adsorbed ions interact specifically with the wall. The Stern layer is situated at distance δ out from the solid surface to yield a potential Ψδ.
- (2) A layer, which starts at Stern plane d and goes out from this plane to the bulk solution (diffuse layer). The thickness of this layer is given by 1/κ, where Ψδ falls to Ψδ/e, where e is the base of natural logarithms at a distance of 1/κ out from the plane δ.
The shear plane, that is, the plane that gives rise to the electrokinetic or zeta (ζ) potential occurs at the interface between the compact and the diffuse layers.
1.2 Electrophoresis, ζ potential, and streaming-induced potential
In solid–liquid dispersions such as clay aqueous dispersions, the electrophoresis is defined as the induced movement of the charged particles by applying an electric field across the dispersion filled capillary. Hence, the measurement of the velocity of the charged particles under a known value of the applied electrical field allows the determination of the ζ potential. Instead of applying an external electrical field across the capillary to cause the charged particles to move, one can apply a mechanical force to the system causing the particles to flow. The perturbation of the electrical diffuse layer of the adsorbed particles on the capillary wall causes almost the counterions to be sheared off the particles and a streaming potential is induced.
In the present work, various electrokinetic potentials (ζ and streaming electrokinetic potentials) of the aqueous clay dispersions were measured to understand the mechanism of adsorption of an anionic dye from water onto clay solid surfaces.
2 Materials and methods
2.1 Dye and clays
In the present work, the adsorbate used, Reactive Red 120 (RR 120), is the same dye used elsewhere [15a,b]. The adsorbents used are four natural clays, two of them, Tabarka and Fouchana, are originating from the Northeast region in Tunisia, and two are standard clays. The Tabarka clay is a mixture of kaolinite (62%) and illite (38%), whereas the Fouchana clay contains smectite (60%), kaolinite (30%), and illite (10%). The standard clays are a kaolinite (KGa-2) and a palygorskite (PFl-1) having a fibrous structure. They were purchased from the Source Clay Repository of the Clay Minerals Society and their purities were assessed elsewhere [15a,b]. Table 1 presents the values of the cation exchange capacity (CEC), the specific surface area, the pore volume and diameter, the point of zero charge, and the mineralogical composition obtained from X-ray diffraction analyses of various clays. The proportions of each clay type were estimated by the reference intensity ratio method using the software HighScore. The specific surface area and CEC were measured according to the Brunauer–Emmett–Teller (BET) theory and Metson method, respectively (AFNOR NF X 31-130), and the chemical composition was obtained after borate fusion by Inductively Coupled Plasma-Atomic Emission Spectroscopy (ICP-AES), (Jobin Yvon JY 124). The point of zero net proton charge of Fouchana and Tabarka clays was determined from potentiometric titrations at different ionic strengths.
Physical and chemical characteristics of Fouchana, Tabarka, Palygorskite, and KGa-2 clays.
| Parameter | Unit | Palygorskite (PFl-1) | Fouchana clay | Tabarka clay | Kaolinite (KGa-2) |
| Specific surface | m2/g | 136.4 | 80 | 47 | 23.5 |
| CEC | mequiv/100 g | 19.5 | 34.3 | 14.96 | 3.3 |
| Micropore volume | mm3/g | 47a | 7b | – | 7.4b |
| Mean pore diameter | Å | 6.1 | 50 | – | 50 |
| Point of zero charge | – | 4.3 | 3.4a | 3.7a | 4.2 |
| Kaolinite | % | – | 30 | 62 | 99c |
| Illite | % | – | 10 | 38 | 1c |
| Smectite | % | 11c | 60 | – | – |
| Palygorskite | % | 89c | – | – | – |
| SiO2 | wt % | 60.9 | 52.1 | 55.25 | 43.9 |
| CaO | wt % | 1.98 | 1.01 | 0.16 | – |
| Na2O | wt % | 0.06 | 0.02 | 0.19 | <0.005 |
| Al2O3 | wt % | 10.4 | 22.7 | 24.17 | 38.5 |
| MgO | wt % | 10.2 | 2.17 | 5.39 | 0.03 |
| Fe2O3 | wt % | 2.98 | 9.15 | 1.15 | 0.98 |
| K2O | wt % | 0.8 | 2.46 | 1.78 | 0.065 |
| TiO2 | wt % | 0.49 | 0.916 | – | 2.08 |
2.2 Adsorption experiments
Batch experiments were carried out to study the dye adsorption from water onto various clays. Factors influencing the dye adsorbed amount, such as the contact time between adsorbent–adsorbate, t, the ionic strength, I, the aqueous phase pH, the initial dye concentration C0, and the temperature T, were also investigated. Thus, the adsorption temperature was varied from 20 to 50 °C, whereas the adsorbent amount (3 g) and the total volume of the solution containing the dye and the clay mixture (100 mL) were maintained constant. The dye adsorbed amount was determined by centrifuging the sample at 3600 rpm during 15 min, and analyzing the supernatant absorbance at λmax = 535 nm. Finally, the dye adsorbed amount at time t, qt, as expressed in milligrams of the dye per gram of the clay was calculated by taking into account the initial and the equilibrium liquid phase concentrations of dye solution (g L−1), according to Eq. 1:
| (1) |
2.3 Adsorption kinetics
The kinetic study was undertaken to examine the factors that influence the adsorption rates, and understand the dynamics of the adsorption process. Several kinetic models are available such as pseudo-first-order, pseudo-second-order, Elovich equation, and intraparticle diffusion models, which were applied for the experimental data to evaluate the effectiveness of adsorption on clay and the rate constants of dye removal from the solution [23–26].
The pseudo-first-order model, Eq. 2 [23], was widely used in the literature but has a limitation: it is found suitable for many adsorption processes for the initial 20–30 min of interaction time but does not always fit for the whole range of contact time [27].
| (2) |
The pseudo second-order equation, Eq. 3, describes the process over the whole period of adsorption, and this model is based on the assumption of chemisorption controlling the rate of the adsorbate.
The linear form is [28]
| (3) |
The equilibrium adsorption capacity (qe) and the second-order rate constant K2 (g/mol min) can be determined experimentally, respectively, from the slope and intercept of plot of t/qt versus t, if the initial adsorption rate is Eq. 4 [25]
| (4) |
The Elovich equation is widely used to describe the kinetics of chemisorption and assumes that the solid surfaces are energetically heterogeneous. Moreover, desorption or interactions between the adsorbate do not affect the kinetics of adsorption at low surface coverage [23].
The linear form of Elovich Eq. 5 is
| (5) |
The intraparticle diffusion model is to taken into account if the diffusion (internal surface and pore diffusion) of dye molecules inside the adsorbent is the rate-limiting step. It describes the following three consecutive steps:
- (1) the transport of adsorbate from the bulk solution to the outer surface of the adsorbent by molecular diffusion;
- (2) the internal diffusion; the transport of adsorbate from the particle surface into interior sites;
- (3) the adsorption of the solute particles from the active sites into the interior surface of the pores.
The effect of intraparticle diffusion resistance on adsorption can be determined by the following relationship (6):
| (6) |
2.4 Zeta potential measurements
Electrokinetic effects refer to the movement of one phase (solid particles) tangentially past a second immobile phase (aqueous solution of the electrolyte) and result from the development of the electrical forces at the boundary between the solid particles and the aqueous solution of an electrolyte.
The solid particle movement can be caused by applying an external electrical field and the zeta potential (ζ), which is the electrical potential at the share plane between the Stern and diffuse layers, is obtained. According to Jacobasch et al. [29], the adsorption processes can be investigated directly with the help of electrokinetics and make it possible to recognize reactions on the surface during measurements [30–32].
It should be noted that we deal with electrokinetic measurements of colloidal particles; the measurable parameter is the electrophoretic mobility, Ue, obtained according to Eq. 7:
| (7) |
| (8) |
In the present work, we have considered the zeta potential instead of the mobility data to describe the electrophoretic behaviors of various clays in the absence and presence of the RR 120 dye molecules. The experimental part describing the electrokinetic mobility measurements of the clay aqueous dispersion is described elsewhere [33].
2.5 Streaming-induced potential measurements
This electrokinetic method based on the titration of clay aqueous dispersion by the dye molecules has been described in detail elsewhere [34]. Here, the initial concentrations of the titrant (RR 120 dye aqueous solution) and the titrated solid (clay aqueous suspension) are equal to, respectively, 0.48 , and 100 mg L−1.
3 Results and discussion
The information obtained in this study relates primarily to the effect that several parameters have on the amount of the adsorbed dye from water onto clay particles. As previously mentioned, these parameters are the contact time between adsorbate–adsorbent, the initial dye concentration, the aqueous phase pH, the clay nature, the ionic strength, and the temperature.
3.1 Effect of contact time and ionic strength
Fig. 1 shows the effects of the contact time and the ionic strength on the adsorption of RR 120 dye onto KGa-2, Tabarka, Fouchana, and PFl-1 clays.
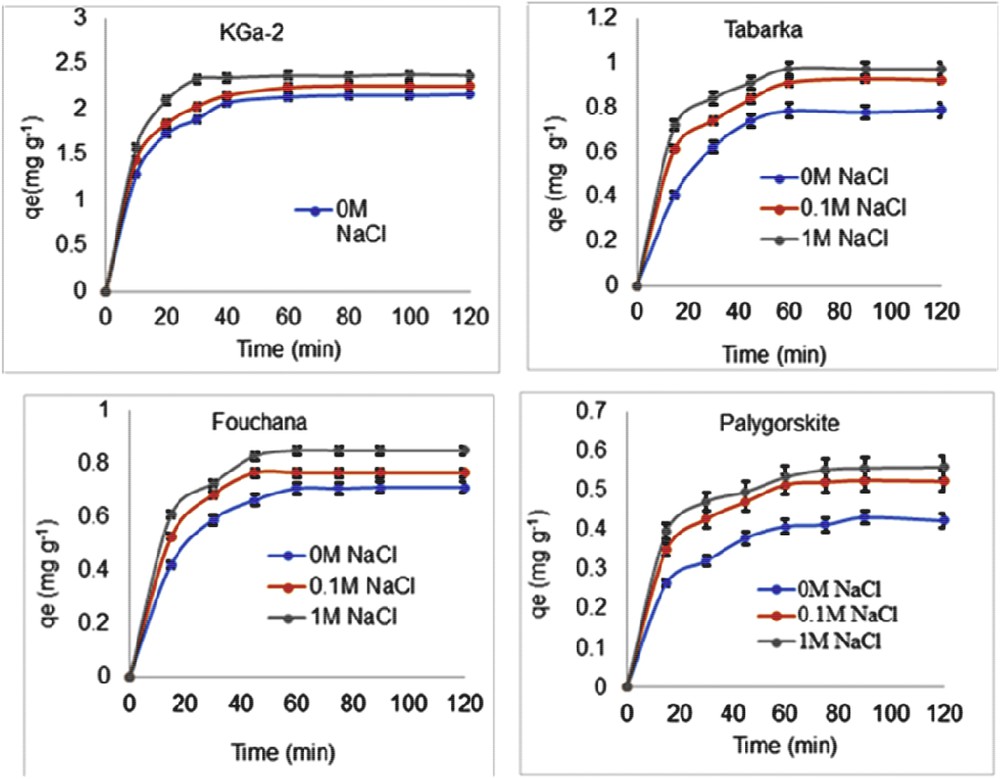
Effect of ionic strength and contact time on the adsorption of RR 120 dye onto various clays, KGa-2, Tabarka, Fouchana, and palygorskite (PFl-1) (Initial dye aqueous solution concentration, C0 = 30 g L−1).
As can be seen in Fig. 1, in all instances, at natural solution pH and ambient temperature, the adsorbed amount of the dye RR 120 (qe) increases, when the ionic strength increases from 0 to 1 M because of screening of the clay particles' surface charge by the presence of many nearby cations, mainly Na+ cations. Ionic strength is an important parameter to study in adsorption experiments because pollutants such as inorganic salts are usually present in industrial wastewaters. Anirudhan and Ramachandran [35] have argued that the presence of such inorganic salts in the wastewater leads to high ionic strength and affects in turn the removal and/or the adsorption processes of the dye from water onto the adsorbent.
The increase in the adsorbed dye amount with an increase in the ionic strength as observed in the present work (Fig. 1) is in agreement with the reported work [36] dealing with similar salt effect on the adsorption of the natural organic material onto activated carbons. These authors have found that at high surface concentration where lateral electrostatic repulsion between adsorbed natural organic material molecules predominate, an increase in the ionic strength reduced these repulsive interactions leading hence to an increase in the adsorbed amount.
Furthermore, whichever clay is investigated, Fig. 1 also shows a rapid increase in qe with the initial contact time ranging between 10 and 60 min, resulting from the abundant availability of active sites on the clay surface. Note that at clay–dye contact times exceeding 60 min, the adsorbed dye amount qe reaches a plateau value, qm, which is dependent on the nature of the clay and the concentration of NaCl salt. Hence, as can be seen in Fig. 1, at 1 M ionic strength, higher amount of the adsorbed dye (qe = 2.4 mg g−1) is found on the KGa-2 clay surface as compared with Tabarka (qe = 1 mg g−1), Fouchana (qe = 0.9 mg g−1), and PFl-1 (qe = 0.6 mg g−1). These qe values are attributed to lack of the available active sites required for further uptake after attaining equilibrium. Furthermore, the optimum contact time to reach the equilibrium, which is about 60 min, for almost all adsorbents, is higher than the contact time of 40 min found by others authors [37] for their investigations dealing with the adsorption of anionic dyes onto pillared bentonite, using silica or silica-zirconia pillars. Such difference in the contact time may result from the difference in the nature of the adsorbents used by Aguiar et al. [37], which consist of two pillared bentonite samples and the nonpillared natural clay samples used in the present work. Thus, the insertion of pillars in the bentonite clay structure improves the dye adsorption capacity and reduces the equilibrium contact time. Other researchers have carried out adsorption experiments to investigate any relationships that may exist between the amounts of dye adsorbed onto a fixed adsorbent mass and the agitation/contact time [38–40]. These authors have observed fast adsorption of the solute onto the adsorbent occurring within the first few minutes of contact and then the adsorption proceeds gradually until equilibrium is reached after which the dye percentage removal remains constant. It should be noted that at laboratory scale, the contact time is a parameter, which allows the determination of the optimum time at which the equilibrium is reached. This parameter in comparison to the other adsorption parameters does not have a definite general trend.
3.2 Effect of the initial dye concentration
Fig. 2 shows the adsorption isotherms (T = 20 °C) of the RR 120 dye onto various clays.
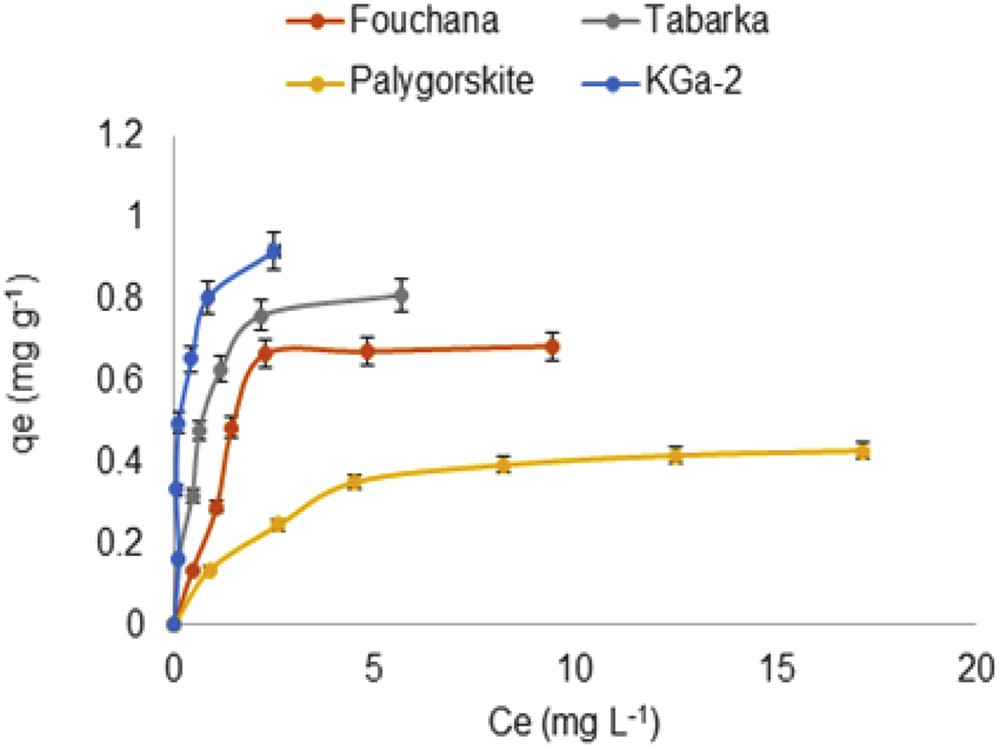
Effect of the initial dye concentration on the adsorbed amount from water onto various clays.
In these experiments the initial dye concentration (C0) varied from 10 to 120 mg L−1 resulting in an equilibrium concentration (Ce) ranging from 0 to 20 mg L−1. As can be observed in Fig. 2 for all of the clays investigated, there is a rapid increase in the dye adsorbed amount, qe, for low Ce followed by a plateau value reached at high dye concentration. Several authors using various dye molecules and adsorbents also observed similar trends. Hence, Akgul [41] has used raw and iron-grafted zeolites as adsorbents to study the removal of Congo Red (CR) from water, and he has shown that in all instances, the adsorbed dye amount increases with the initial dye concentration up to the saturation of the adsorbent active sites available for the adsorption. In the work reported by Gupta et al. [42] dealing with the use of sustainable and biodegradable lignocellulosic fiber to detoxify the noxious Cr(VI) from wastewater, the sorption capacity of the biosorbent was found to increase up to a maximum value with an increase in the initial metal concentration. Aguiar et al. [37] carried out adsorption experiments of reactive dyes onto porous clay heterostructures. They have found that the amount of dye adsorbed increased with its initial concentration in water and leveled out at a high solute content resulting from chemical interaction occurring between the dye molecules and the porous clay surface functional groups. Fig. 2 also shows that for the four clays investigated, the Ce value at which a plateau is reached increases in the following order:
This indicates that KGa-2 offers more active sites available for the adsorption, and the clay surface saturation occurs in the presence of higher amounts of the dye molecules. On the contrary, in the case of PFl-1, the clay surface saturation occurs in the presence of a lower amount of the dye molecules, due to less active sites or a less efficient process because of less accessibility of the sites to the dye molecules. These results show clearly that the dye adsorption efficiency depends not only on the structure of the dye molecules but also on the adsorbent nature [37,41].
3.3 Effect of the aqueous phase pH on RR 120 adsorption on the clay surface
We have carried out adsorption experiments by varying the aqueous phase pH in the range 3–9. The data indicate that whichever is the clay investigated, the decrease in the pH value from 9 to 3 leads to an increase in the dye adsorbed amount by several folds. For instance in the case of PFl-1 clay, when the pH decreases from 7 to 3, qe increases, respectively, from 0.26 to 0.78 mg g−1. The observed increase in the amount of dye adsorbed, qe, upon the decrease in pH is because of the change in the clay electrical properties with the pH. Thus, in the case of KGa-2, the clay isoelectric point (IEP) is 4.8, indicating that the surface charge of clay becomes more positive at pH values near and at below the IEP, hence leading to enhanced electrostatic attraction forces that occur between the anionic dye molecules and the clay positively charged surface sites. The same change in the electrostatic attraction forces with the pH may also explain the increase in qe with the decrease in pH, in the case of Fouchana, Tabarka, and PFl-1, despite the fact that these clays have no IEP values in the pH range 3–9 investigated. It should also be noted that at low pH values (pH < pKa), the dye molecule is subject to protonation of one of the diaminochlorotriazine groups (pKa = 4.4), which could also lead to attraction between the positively charged dye molecules and the negatively charged clay surface [43], hence enhancing the adsorbed amount onto the clay.
Our results are in good agreement with the work reported [44], dealing with solution condition effects on sulforhodamine G, rhodamine B, orange II, and methylene blue (MB) adsorption on montmorillonite. These authors have concluded that the dye adsorption may occur either on the basal (pH insensitive) or on the edge (pH sensitive) surfaces of clay. Thus, the amount of rhodamine B adsorbed on the edge surfaces of clay decreased with the increase in the pH, whereas the amount of MB adsorbed at the basal surface of clay was not affected by the pH change. It should be noted that the aqueous phase pH plays an important role in the whole adsorption process as previously reported [39,45–47]. The pH influences the dye adsorption because of the change in the electrical surface charge of the adsorbent and/or that of the dye chemistry. Therefore, it is obvious that the dye–clay surface interaction force and/or the adsorption capacity of the adsorbent will depend on the aqueous phase pH. The data obtained in our work have shown an increase in the amount of dye adsorbed with the decrease in the pH in the range 3–9, whichever is the clay used, which is in a good agreement with earlier works reported [48,49]. These studies have shown that under acidic conditions (low pH value) a higher amount of the anionic dye removal is observed, resulting from the electrostatic attraction occurring between the anionic dye and the positively charged surface of the adsorbent. However, under basic conditions (high pH value), authors of various studies [48,49] have observed a low amount of the anionic dye removal because of the electrostatic repulsion occurring between the negatively charged adsorbent surface and the anionic dye. In the reported work [35], dealing with the adsorptive removal of cationic dyes (MB, Rhodamine Blue, and Crystal Violet) from aqueous solutions by surfactant-modified bentonite clay, it has been shown that, contrary to what has been observed for adsorption of anionic dyes on clays, increasing the pH increases the adsorption capacity.
These findings can be explained by the fact that an increase in pH decreases the positive charges on the clay surface, thereby increasing its negatively charged sites, which will favor the uptake of cationic dye molecules due to electrostatic attraction. On the other hand, the decrease in cationic dye adsorption in acidic conditions is due to the electrostatic repulsion, occurring between the cationic surfactant-modified bentonite and the cationic dye molecules. The overall data indicate that the adsorbate–adsorbent electrostatic interaction forces could be tuned by varying the aqueous phase pH, as shown in Ref. [50], in their work dealing with the removal of Malachite Green (MG) dye from wastewater by different organic acid-modified natural adsorbent (sawdust).
3.4 Effect of the clay nature on the adsorbed dye amount
The overall data indicate that the dye adsorbed amount from water onto various clays increases in the following order:
It appears that KGa-2 and PFl-1 are, respectively, the most and the less efficient adsorbents, resulting from the structural nature of the clay. Such data indicate that the kaolinite mineralogical species play a major role in the adsorption of anionic dye, whereas illite (in Tabarka) and smectite (in Fouchana) are more limited and do not enhance the adsorption capacity of the clay material when mixed with kaolinite. Palygorskite, which is widely used as adsorbent of pollutant because of its high structural porosity and high specific surface, shows the lowest efficiency. These different clay behaviors toward the anionic dye show that even a clay having both high porosity and specific surface do not enhance the adsorption of RR 120 dye. Therefore, the different clay behaviors toward the anionic dye result from the nature of the surfaces and the surface charges that are different between the KGa-2 (pure kaolinite) and the other clays.
3.5 Comparison of the experimental adsorption data to the theoretical predictions
To elucidate the adsorption mechanism of the dye from water onto the clay surface, we have compared the adsorption data to the theoretical predictions of the Langmuir, Freundlich, Dubinin-Radushkevich, Harkins-Jura, and Halsey isotherms models. These models were selected because they are suited to describe the data, and they are widely applied to investigate the adsorption mechanistic aspects [51,52]. For instance, the Langmuir adsorption isotherm model [53] assumes that sorption takes place at specific homogeneous sites on the adsorbent surface, and the adsorbed layer is one molecule in thickness. Furthermore, the strength of intermolecular attractive forces is believed to fall off rapidly with distance. Contrary to the Langmuir model, the Freundlich adsorption isotherm model considers adsorbent having heterogeneous surfaces and nonuniform distribution of adsorption heat [54,55], as well as multilayer sorption. Moreover, this model predicts that the dye concentrations on the adsorbent will increase so long as there is an increase in the dye concentration in the liquid.
The Langmuir, Freundlich, Dubinin-Radushkevich, Harkins-Jura, and Halsey equations are presented in Table 2.
Isotherm equations, constants, correlation coefficients (R2), and sum of squared errors (SSE) for RR 120 adsorption onto Tabarka, Fouchana, KGa-2, and Palygorskite clays.
| Isotherm model | Clays | Model parameters | ||||
| Langmuir | qe experimental (mg g−1) | qm (mg g−1) | b (L mg−1) | R2 | SSE | |
| Tabarka | 1.2 | 1.0 | 0.53 | 0.98 | 0.041 | |
| KGa-2 | 2.4 | 2.1 | 1.004 | 0.97 | 0.26 | |
| Fouchana | 0.8 | 0.6 | 0.049 | 0.99 | 0.12 | |
| Palygorskite | 0.4 | 0.45 | 0.04 | 0.99 | 0.22 | |
| Freundlich | qe experimental (mg g−1) | qF (mg g−1) | n | R2 | SSE | |
| Tabarka | 1.2 | 0.5 | 1.17 | 0.84 | 0.24 | |
| KGa-2 | 2.4 | 0.7 | 3.16 | 0.91 | 0.77 | |
| Fouchana | 0.8 | 1.03 | 0.6 | 0.95 | 0.09 | |
| Palygorskite | 0.4 | 1.53 | 1.34 | 0.97 | 0.13 | |
| Dubinin–Radushkevich | qe experimental (mg g−1) | qm (mg g−1) | β | R2 | SSE | |
| Tabarka | 1.2 | 2.3 | −2 × 10⁻⁵ | 0.89 | 0.22 | |
| KGa-2 | 2.4 | 3.4 | −8 × 10⁻⁷ | 0.71 | 0.17 | |
| Fouchana | 0.8 | 2.3 | −2 × 10⁻⁵ | 0.91 | 0.31 | |
| Palygorskite | 0.4 | 1.8 | −1 × 10⁻⁵ | 0.93 | 0.18 | |
| Harkins–Jura | qe experimental (mg g−1) | A | B | R2 | SSE | |
| Tabarka | 1.2 | 2.25 | 1.39 | 0.82 | 0.18 | |
| KGa-2 | 2.4 | 2.4 | 1.32 | 0.87 | 0.12 | |
| Fouchana | 0.8 | 1.53 | 1.37 | 0.79 | 0.23 | |
| Palygorskite | 0.4 | 0.0001 | 0.0001 | 0.84 | 0.22 | |
| Halsey | qe experimental (mg g−1) | nH | KH | R2 | SSE | |
| Tabarka | 1.2 | 1.08 | 0.64 | 0.98 | 0.17 | |
| KGa-2 | 2.4 | 1.25 | 0.72 | 0.96 | 0.12 | |
| Fouchana | 0.8 | 1.17 | 0.55 | 0.95 | 0.14 | |
| Palygorskite | 0.4 | 1.53 | 0.61 | 0.99 | 0.13 |
In Table 2, the calculated parameters from these models, the regression coefficients (R2), and the sum of squared errors of the prediction are presented. Considering, for instance, the Freundlich model, the parameters qF and n were calculated, respectively, from the intercept and the slope of the Freundlich plots (log (qe) vs log (Ce)). For the Langmuir model, the parameters qm and b were calculated, respectively, from the slope and the intercept of the linear equation Ce/qe versus Ce, where Ce (mg L−1) is the equilibrium concentration, qe (mg g−1) is the adsorbed amount at equilibrium, qm (mg g−1) is the adsorption capacity, and b (L mg−1) is the adsorption energy (Langmuir constant).
The best fits of the experimental data to the theoretical predications of all models were assessed by considering first the highest R2 values, and second, the smallest sum of squared errors of the prediction values. By taking into account such criteria and the good correspondence between the calculated and the experimental qe values, as can be seen in Table 2, the overall data indicate that the Langmuir model is the best model to describe the adsorption of RR 120 onto all clays, indicating monolayer coverage of the surfaces.
3.6 Adsorption kinetics for RR 120 dye adsorption on various clays
The kinetics of RR 120 adsorption onto Tabarka, KGa-2, Fouchana, and Palygorskite clays was investigated using four models: the pseudo-first-order, pseudo-second-order, Elovich, and intraparticle diffusion models, which were applied for the experimental data to evaluate the effectiveness of adsorption on clay, and the rate constants of dye removal from the solution. The calculated kinetic constants (K1, K2, α, and Kip) of the four kinetic models and the calculated amount of dye adsorbed at equilibrium (qe) along with R2 values are presented in Table 3.
Parameters of the pseudo-first-order, pseudo-second-order, Elovich, and intraparticle diffusion kinetic models for adsorption of RR 120 dye onto Fouchana, Tabarka, Palygorskite PFL-1, and KGa-2 clays (T = 25 °C).
| Clays | Pseudo-first-order | Pseudo-second-order | Elovich | Intraparticle diffusion | |||||||||
| qe (mg g−1) | K1 (min−1) | R2 | qe (g mg−1 min−1) | K2 (mg g−1 min−1) | H (mg g−1 min−1) | R2 | α (mg g−1 min−1) | β (g mg−1) | R2 | C (mg g−1) | Kip (mg g−1 min−1/2) | R2 | |
| Tabarka | 0.8 | 0.05 | 0.92 | 0.9 | 0.004 | 0.84 | 0.99 | 1.31 | 1.84 | 0.89 | 3.66 | 0.42 | 0.79 |
| KGa-2 | 2.0 | 0.07 | 0.89 | 2.3 | 0.007 | 3.74 | 0.99 | 0.29 | 1.73 | 0.87 | 12.55 | 0.97 | 0.73 |
| Fouchana | 0.65 | 0.58 | 0.67 | 0.78 | 0.092 | 0.98 | 0.99 | 1.05 | 1.95 | 0.92 | 0.74 | 0.192 | 0.72 |
| Palygorskite | 0.3 | 0.04 | 0.98 | 0.42 | 0.15 | 0.04 | 0.99 | 0.23 | 0.89 | 0.94 | 6.29 | 0.36 | 0.87 |
From this table, we can note that whatever the nature of the clay, the best fit is observed with the pseudo-second-order model as shown by the high correlation coefficients (R = 0.99). Moreover, for each clay, the calculated amount of dye adsorbed at equilibrium (qe) with the pseudo-second-order model was very close to the experimentally obtained value (qe experimental shown in Table 2).
3.7 Thermodynamic parameters of adsorption
Several researchers have investigated that temperature plays an important role in the adsorption process [35,56,57]. In fact, the adsorption of molecules on a solid adsorbent is accompanied by changes in the Gibbs energy, ΔG. The later is composed of two terms, an enthalpic term (ΔH), which expresses the interaction energies between the molecules and the adsorbent surface, and an entropic term (ΔS), which expresses the modification and the arrangement of the molecules in the liquid phase and on the surface. In general, the adsorption phenomenon is always accompanied by a thermal process that can be either exothermic (ΔH < 0) or endothermic (ΔH> 0). According to Chen et al. [58], the thermodynamic parameters ΔS and ΔH dealing with the adsorption of dye on clay particles are usually obtained from the experimental data acquired at different temperatures. In the course of a chemical reaction process, the increase in the temperature leads to the increase in the reaction rate [59]. In the adsorption process, if the adsorbed amount increases or decreases with temperature then the adsorption is, respectively, endothermic or exothermic [60–62].
Thus, in the present work, the changes in the free energy of sorption reaction (ΔG0) were calculated for different temperatures ranging from 293.15 to 323.15 K (Table 4). Eq. 9 gives ΔG0 [63]. ΔG0 is the standard free energy change (J mol−1), R is the universal gas constant 8.314 (J mol−1 K−1), T is the absolute temperature (K), and K0 is the equilibrium constant given by Eq. 10 [63]. ΔH0 and ΔS0 are the enthalpy and entropy of sorption reaction, respectively.
| (9) |
| (10) |
Standard free energy (ΔG0), at different temperatures, enthalpy (ΔH0), and entropy (ΔS0) for adsorption of RR 120 dye onto the Tabarka, KGa-2, Fouchana, and Palygorskite clays.
| T (K) | 293.15 | 303.15 | 313.15 | 323.15 | |
| ΔG0 (kJ mol−1) | KGa-2 | −4.779 | −4.386 | −3.993 | −3.600 |
| Tabarka | −4.314 | −3.987 | −3.659 | −3.333 | |
| Fouchana | −1.000 | −0.693 | −0.386 | −0.079 | |
| Palygorskite | 0.643 | 0.931 | 1.219 | 1.507 | |
| ΔH0 (kJ mol−1) | KGa-2 | −16.3 | |||
| Tabarka | −13.9 | ||||
| Fouchana | −10 | ||||
| Palygorskite | −7.8 | ||||
| ΔS0 (J mol−1) | KGa-2 | −39.3 | |||
| Tabarka | −32.7 | ||||
| Fouchana | −30.7 | ||||
| Palygorskite | −28.8 |
In all instances, the data show that when the temperature increases from 293 to 323 K, ΔG0 becomes less negative, resulting from the decrease in the adsorption capacity of RR 120 dye, indicating that ambient temperature is more favorable to adsorption of RR 120 dye on the studied clays. Furthermore, the negative values of ΔG0 in case of KGa-2, Tabarka, and Fouchana in the studied temperature range indicate that the adsorption is still feasible and spontaneous at higher temperature [64]. However, in the case of PFl-1 the ΔG0 values are always positive, which indicates that the adsorption process is not as feasible and spontaneous as for the other clays (Table 4). The ΔH0 and ΔS0 values are all negative, which indicates that the process is exothermic and it induces more order at the liquid–solid interface. A positive ΔS0 value relates to an increase in the adsorbed species degree of freedom [65]. It should also be noted that ΔS0 value for KGa-2 is the most negative, thus the dye molecules adsorbed onto kaolinite are more organized at the solid–liquid interface than in the case of palygorskite. The decrease in the adsorption capacity with the increase in the temperature, as observed in the present work, is in a good agreement with the work reported by others authors [66,67], in their investigation on the CR adsorption on clay materials at various temperatures. They concluded that lower temperatures gave more negative ΔH0 values and favored the adsorption process. Furthermore, the decrease in the CR adsorption by bentonite with the increase in the temperature was explained by the interaction weakness (hydrogen bonds and van der Waals) occurring between the CR and the clay particles and resulting in physisorption of the dye instead of chemisorption [40]. Others authors observed similar trends [68] on their use of modified natural bentonite for the removal of diazo dye from water. Furthermore, the temperature effect on the use of Moroccan clays to adsorb MB, MG, and Methyl Orange (MO) from aqueous solutions was examined by others researchers [69]. Accordingly, they have investigated five temperatures ranging from 10 to 50 °C. These authors have found that as the temperature increased the adsorbed amounts on the clays of MG and MO increased and decreased, respectively, whereas the temperature less influenced the adsorbed MB amount. Therefore, taking into consideration the fact that the adsorption of MO was more influenced by the change in solution temperature, our data dealing with the adsorption on clays of an anionic dye are in a good agreement with those reported by Elmoubarki et al. on the MO dye. From the data, the adsorption of anionic dyes onto clays decreases as the solution temperature increases.
3.8 Zeta potential
Fig. 3 shows the variation in the ζ potential of the various clay particles as a function of the aqueous phase pH in the absence and in the presence of RR 120 dye molecules.
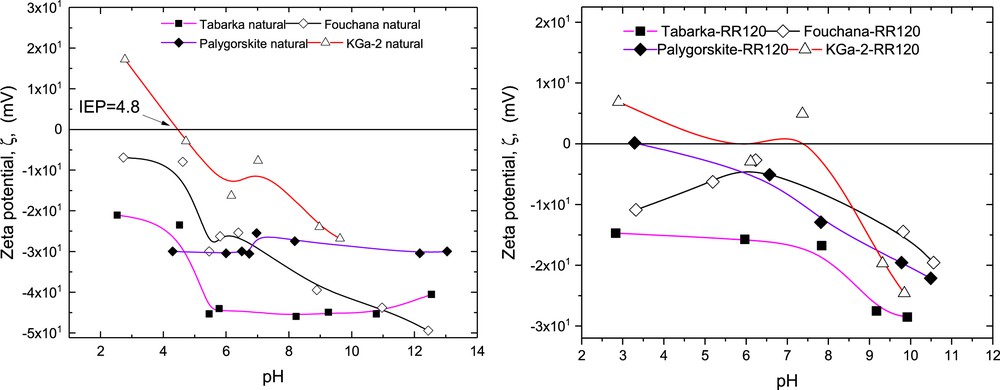
Variation of the zeta potential, ζ, of the various clay aqueous dispersions with the aqueous phase pH, in the absence and in the presence of RR 120 dye molecules.
In the absence of RR 120 dye molecules, the evolution of ζ with the pH for the kaolinite KGa-2 sample indicates the presence of an IEP = 4.8, which is in agreement with the IEP values varying in the range 2–6 as found in the literature. Furthermore, the data show that for KGa-2 clay, ζ becomes more and more negative with the increase in the pH to reach a maximum value at pH 10, resulting from the increase in the ionization of the clay silanol groups (-SiOH, permanent charge) and the decrease in the surface density of the positively charged aluminol groups (-AlOH, lateral charges). These changes in the surface densities of silanol and aluminol groups with the pH also occur with the increase in ζ with the pH, as observed for Fouchana, and Tabarka clays. At high pH values, the maximum ζ potential value observed for KGa-2 (-30 mV) was lower as compared with other clays. Such differences in the magnitude of ζ potential, at high pH, between KGa-2 and the others clays is due to the low CEC and the electrical surface charge of the kaolinite. In the case of the palygorskite having fibrous structure, the small variation in the ζ with the pH seems to be related to the little contribution of the lateral surface charges (-AlOH) to the ζ potential. The clay surface charge in this case results mainly from its permanent charge (-SiOH), in accordance with the lowest Al2O3 (10.4 wt %) and the highest SiO2 (60.9 wt %) contents of the clay [15a,b].
In the presence of the adsorbed dye molecules (Fig. 3), an increase in the aqueous phase pH leads to an increase in the magnitude of zeta potential, which at pH ≥ 9 reaches its maximum values in the range -15 to -30 mV for all clays investigated. Such increase in the magnitude of ζ, with the pH, results from the contribution due to the clay surface group (-SiOH groups) and the contribution resulting from the sulfonate group of the adsorbed dye molecule.
Note that the RR 120 dye molecule contains mainly aromatic, amine, and sulfonate groups. Thus, the adsorption of the dye molecules on the clay surface can involve electrostatic interactions and noncovalent π interactions occurring between the adsorbate and the adsorbent. All of these interactions involved in the dye adsorption from water onto the clay solid surface can be tuned by varying various parameters such as the aqueous phase pH, the ionic strength, the temperature, the initial dye concentration, the nature of the electrolyte, and so forth.
As can be seen in Fig. 3, in all instances, the clays covered with the dye molecules as compared with the bare clays have lower zeta potential magnitudes, resulting from the clay surface charge screening by the adsorbed dye molecules. The comparison of the zeta potential data of the clay aqueous dispersions in the absence and in the presence of the dye leads to the following two hypotheses:
- (1) The RR 120 dye molecules may adsorb on the clay surface via their ammonium groups (positively charged groups), which are deprotonated at pH values >9.
- (2) The RR 120 dye molecules may adsorb on the clay surface via their sulfonate (SO3−, negatively charged groups) groups, which interact with the clay surface positive sites, hence reducing the surface charge of this latter.
3.9 Streaming-induced potential
Fig. 4 shows the variation in the normalized values of the streaming-induced potential (SIP) of various clays upon the addition of increasing amounts of the RR 120 dye molecules.
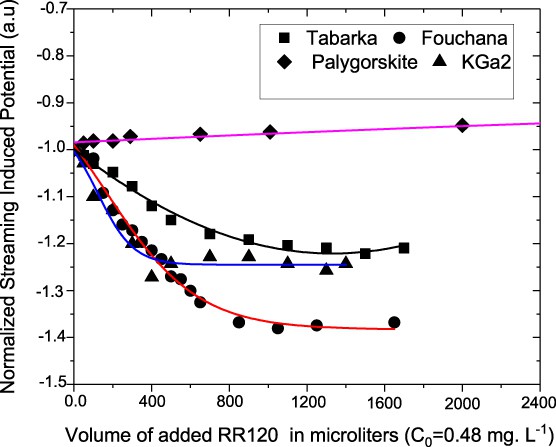
Variation in the SIP with the volume of the added RR 120 dye molecules to the various clay particles in aqueous dispersions.
It should be noted that the evolution of the SIP value as a function of the added RR 120 dye reflects the modification of the electrical double layer around the adsorbed clay particles on the cylindrical container wall [34], occurring during the titration. Such SIP measurements are a tool to monitor the adsorption of dye molecules onto the clay surface. Initially, that is, before any addition of the dye molecules to the aqueous clay dispersions, the measured SIP values were negative, resulting from the negatively charged surfaces for various clays. However, upon the addition of increasing amounts of the dye solution to the clay aqueous dispersion, the SIP magnitudes increased, that is, become more negative (Fig. 4), and then leveled out, in the case of Fouchana, KGa-2, and Tabarka, whereas a slight decrease in the SIP magnitude is observed in the case of palygorskite clay. The increase in negative charge, for Fouchana, KGa-2, and Tabarka clays, indicates that the anionic dye molecules accumulate and bring additional negative charges by their adsorption on the positive clay amphoteric sites, which are gradually neutralized. Such neutralization of the positive clay amphoteric sites results from the electrostatic interactions occurring between these sites and the dye's sulfonate groups (SO3−), hence enhancing the net negative surface charge of the clay particles. At the plateau values, as shown in Fig. 4, the SIP becomes constant because of the complete neutralization of all of the positive sites of the clay minerals and/or due to the formation of barrier by the dye molecules, hence limiting the adsorption process. The SIP magnitudes for Fouchana, KGa-2, and Tabarka samples are higher than that observed for the palygorskite clay in the whole range of the added RR dye solution, hence reflecting higher adsorption amounts, for the former clays in accordance with the adsorption experiments. These differences in the dye removal from water among Fouchana, KGa-2, and Tabarka, on one hand, and the palygorskite on the other hand, are related to the nature of the surfaces and the composition of the clay.
3.10 Desorption studies
Desorption experiments were performed after the adsorption of RR 120 dye on various clays to check the strength of the bonds between the adsorbent and the adsorbate. The desorption experiments were carried out by immersing the adsorbent after adsorption of dye and additive in deionized water for 2 h at room temperature. The desorbed amount of RR 120 from the clay was calculated relative to the maximum adsorption amount observed, as depicted in Fig. 5.
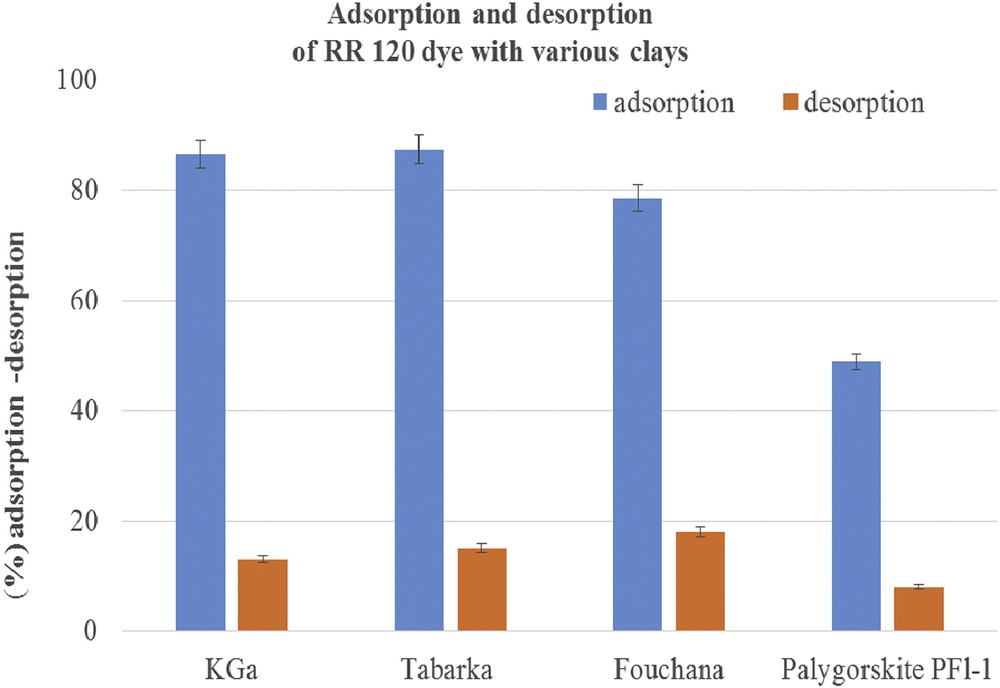
Adsorption and desorption of RR 120 dye with various clays.
The desorbed dye amount from the clays varied from about 10% to 18% as a function of the clay nature (Fig. 5). As can be seen in Fig. 5, the lowest desorption rate of the RR 120 dye is obtained with Palygorskite, whereas the highest rate is obtained by using Fouchana as adsorbent. These differences in the behavior of various clays in the presence of the RR 120 dye are in a good agreement with the SIP data (see above) and can be explained by the strong interaction occurring between the dye SO3− groups and the positive amphoteric sites of the Fouchana, Tabarka, and KGa-2 clays.
4 Conclusions
The present work has shown that the removal of anionic dye from polluted water can be tuned by varying various parameters such as the aqueous phase pH, the ionic strength, the temperature, and the nature of the clay used as an adsorbent. The overall data indicate the porosity, the surface area, and the cationic exchange capacity of the clay, are not the key points, but the clay nature is the dominant factor controlling the efficiency of the dye removal from water. Thus, the data show that although palygorskite provides a large surface to the adsorption, it has the lowest capacity for adsorption of RR 120 dye, contrary to the pure kaolinite KGa-2, which exhibits the lowest specific surface and shows the highest adsorption capacity for anionic dye. Tabarka also shows a better adsorption capacity than Fouchana and palygorskite. A good correlation was found among the amount of dye adsorbed, the magnitude of the zeta potential, and the SIP value. The zeta potential and SIP measurements indicate that the dye adsorption from water onto the clay surfaces indeed occurs, despite the difficulty arising from the negative surface charge of the clays and the anionic character of the dye. From the analysis of the thermodynamic parameters for the dye adsorption, it was concluded that the process is spontaneous, feasible, and exothermic according to ΔG0 and ΔH values, although not favored at high temperature. In case of palygorskite, the positive values of ΔG confirm that the adsorption process is difficult, which indicates again that porosity and specific surface are not relevant parameters in the adsorption of anionic dye. Moreover, isotherm modeling indicates that the coverage of the dye molecules on the clay surfaces is limited. All of the results showed that the kaolinite-rich clay is a better effective adsorbent for removal of the anionic dye in aqueous solution at ambient temperature, a low pH, and a high ionic strength, and that the process without treatment of the clay may be a sustainable alternative for the treatment of dyeing wastewaters. To establish general trends dealing with the electrophoretic behaviors and adsorptive properties of the clays, work is in progress to investigate another adsorbate different from the reactive red dye RR.
Acknowledgments
This work was done in the frame of two projects: the ERANETMET SETPROpER project (2016–2019) with the support of the funding agencies of France (National Research Agency, ANR) and Tunisia (Tunisian Ministry of Higher Education Scientific Research, and TIC TUNISIA). The French–Tunisian PHC UTIQUE project (12G21002), with the support from the French Ministries of Foreign Affairs (MAE) and Ministry of Education and Research (MESR), and the Tunisian Minister of Higher Education and Scientific Research.
List of symbols
Symbol DefinitionCEC
cation-exchange capacity of the clay
Rgas constant
Ttemperature
tcontact time between adsorbate–adsorbent
Iionic strength
qeamount of adsorbate in the adsorbent at the equilibrium
qmmaximum amount of adsorbate in the adsorbent
C0initial concentration of the solute (the dye)
Ceresidual or equilibrium concentration of the solute (the dye)
K0equilibrium constant given by Eq (10)
K1pseudo-first-order rate constant
K2pseudo-second-order rate constant
Kipintraparticle diffusion rate constant
KLLangmuir constant
qFFreundlich's constant
nexponent of non-linearity in Freundlich's equation
mmass of the adsorbent
badsorption energy (Langmuir constant)
Vvolume of the solute (the dye) solution
Ueelectrophoretic mobility of the clay particle
ζzeta potential of the clay particle
αElovich model parameter, initial adsorption rate constant
βElovich model parameter related to the extent of the surface coverage and activation energy for chemisorption
ηviscosity of the aqueous medium
εpermittivity of the aqueous medium
δdistance separating the Stern layer from the solid surface
κreverse of the layer thickness, which starts at the Stern plane and goes out to the bulk solution
ΨδStern potential
vclay particle velocity
Eelectrical field
R2regression coefficient
SSEsum of the squared errors when comparing the data to the models