

1 Introduction
Playa or “inland Sebkha” is roughly defined as an intra-continental arid zone basin with a negative water balance and with a capillary fringe close enough to the surface that evaporation will cause water discharge, usually resulting in evaporites (Briere, 2000). These landforms where vegetation is entirely lacking, described as “self-contained within their own watershed”, are dependent on precipitation or run-off for surface water from surrounding uplands. They have been attractive research subjects worldwide because they are valuable sedimentary archives for climate changes. In fact, stratified thin sediment layers in a Sebkha may result from sediment deposition accompanying rainfall run-off from surrounding uplands (Brostoff et al., 2001) or from aeolian deposition (Pelletier and Cook, 2005). In addition, where evaporation predominates, salts may accumulate in sediments over time; and when inundation periods are prolonged, anaerobic conditions may prevail. Both of these may influence the composition and pattern of sedimentary deposits.
In Tunisia, despite the increased geographical extension of the Sebkha basins to the detriment of agricultural land and urban areas, there are very few high-resolution records of temperature and humidity variability over the last two millennia. Relying on the scarce records, many recent studies have examined major climatic changes in these environments during the Holocene (e.g., Chairi, 2005; Jaouadi et al., 2016; Lakhdar et al., 2006; Perthuisot, 1975; Schulz et al., 2002; Zaibi et al., 2012). However, detailed history of past climatic changes remains ambiguous and the scarce records based on charcoal and pollen proxies document anthropogenic influence (Jaouadi et al., 2016; Marquer et al., 2008; Schulz et al., 2002). In this paper, we reconstructed a climate change from 2100 yr BP, and then focused on extreme events within each episode using geochemical, sedimentological, magnetic susceptibility (MS), and microtexture of quartz grains records. The analysis of the Sebkha Mhabeul sediment archives allowed us to infer that flood events occurred throughout this 2100-yr period, and sandstorm events were more frequent during the warm periods than the cold or less warm periods.
2 Local setting and climate
The Sebkha Mhabeul, is a small depression located in the central part of the “Jeffara coastal plainˮ (limited to the west by the Matmata and the Dahar Mountains and to the east by the Gulf of Gabes and the Mediterranean Sea, Fig. 1). It is oriented roughly east–west with a maximum length of 3 km and width of 1.5 km. Since the Wadi Bou Ahmed deviation in the mid-Holocene, continental Sebkha Mhabeul has been fed by the surrounding small local wadis (Abichou, 2002).
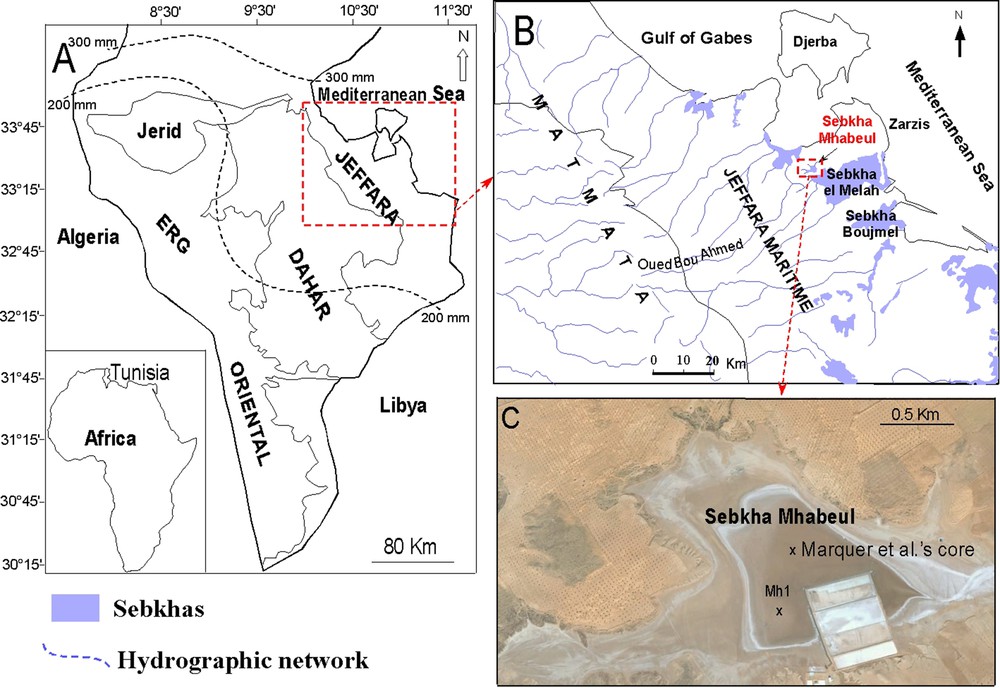
Geographical settings (A) Map of Southern Tunisia; the red square denotes the location of the study area (outlined in red in map B and shown in detail in C) and isoprecipitation lines mark the annual rainfall (B) Map showing main regional setting for Sebkha Mhabeul and other sites mentioned in the text (C) displays the position of the Mh1 and Marquer et al.’s cores.
The coastal Jeffara is characterized by a pre-Saharan and arid to semi-arid climate. On a seasonal basis, the Saharan wind called sirocco (locally known as chehili or ghibli) is most frequent in the spring and the summer (Bousnina, 1990). It blows from the south and southwest or deviates to the southeast. Its turbulent movement is frequently responsible for suspending fine sand in the atmosphere (Azri et al., 2002).
3 Materials and methods
In order to analyze the sedimentary properties of successive sand horizons, and to reconstruct the paleoclimate history of Sebkha Mhabeul, the core Mh1 (33°24′46.27"N, 10°50′51.68"E) was sampled at 0.5-cm intervals and dried completely at room temperature. A multi-proxy approach including particle-size, magnetic susceptibility measurements, geochemical analysis and scanning electronic microscope (SEM) images was implemented (Supplementary Data S1).
4 Results
4.1 Lithofacies and depositional environments inferred from the chronology, geochemistry, magnetic and surface microtextures of quartz grains
In the present study, two discrete tephra layers were detected in the Mh1 core sediments at depths of 26 cm and 82 cm (Fig. 2A). Based on XRD analysis (Fig. 2B), we distinguished a volcanoclastic fraction that consists mainly of augite, diopside, olivine, hornblende, sanidine, and titanite. According to these mineralogical results, the two tephra layers can be correlated with reliably dated volcanic events of Mount Vesuvius in Italy (Abichou, 2002; Cioni et al., 2008; Marquer et al., 2008; Narcisi et al., 1999; Pomel et al., 2004) in AD 1631 and AD 79. Moreover, a correlation with the greyscale curve of Marquer et al. (2008) has hardened the dating of the core Mh1 (Fig. 4).
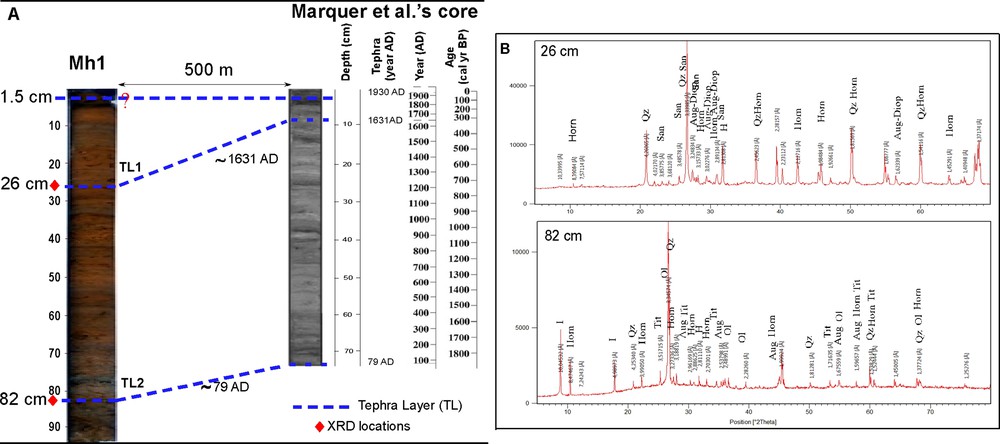
(A) Correlation between the tephra layer levels of the Mh1 and Marquer et al.’s cores (2008); (B) X-ray diffraction pattern for bulk sediment at 26 and 82 cm depths. I, Illite; Aug, augite; Diop, diopside; Qz, quartz; H, halite; Horn, hornblende; Tit, titanite; San, sanidine; Ol, olivine.

Magnetic susceptibility and greyscale variability-based correlation between the Mh1 and Marquer et al.’s cores (2008).
The Ca, K and Na (g/kg) concentrations throughout the core are displayed in Fig. 3. The sediments indicate higher concentrations of sodium and low concentrations of calcium, except for depth intervals of 8–15, 35–42, 76–83, 90–93.5 cm, and the bottom level. High Ca concentrations in the lower and the upper centimeters are mostly followed by an increasing trend of halite concentration (0–16 and 66–78 cm in depth). Potassium reveals low concentration variability along the core, but significantly lowers in the bottom part.

Climatic subdivision according to the variations of salt concentrations and magnetic susceptibility along the Mh1 core.
Magnetic susceptibility measurements of sediment samples (Fig. 4) varied from 12 × 10−6 SI to 167 × 10−6 SI along the Mh1 core. The highest records were at depths of 80–86, 40–65, 15.5–27.5, and 0–8 cm, and the values were fairly low at depths of 86–93, 65–80, and 8–15.5 cm. The maximum MS values are associated with increased detrital terrigenous material showing abundance of magnetic minerals such as magnetite, hematite, ilmenite and garnet, called para- and ferromagnetic minerals (Fig. S2 in Supplementary Data S2). The minimum MS values are associated with large amounts of evaporites, either halite or gypsum, called diamagnetic minerals (e.g., Thompson and Olifield, 1986).
Fig. 4 presents a synthetic stratigraphic log of core Mh1, magnetic susceptibility (MS) and greyscale (GS) curves of both Mh1 and Marquer et al. (2008) cores. Indeed, the maximum values of GS (~ 100) coincide perfectly with highest MS peaks. This similarity implies that the major part of facies 3 and 4 (see Table 1) is supplied by significant wadi flow activity. However, the reverse correlation is detected in the uppermost part of core Mh1 and in its lower part, between depths of 75 and 93 cm. This anomaly is due to the presence of a microbial mat between depths of 4 and 5 cm (dark sediments are associated with minimum greyscale values but high MS signals) and the high evaporitic mineral concentration between depths of 6 and 16 cm and between depths of 83 and 93 cm (lighter sediments are associated with maximum greyscale values but low MS signals).
Lithofacies and depositional environments.
| Facies Name | Description | Interpretation/depositional environment |
| Facies F1 | Moderate sorted fine-to-medium sands (bimodal), MS values are low (from 20 to 40·10−6 SI units), quartz grains are mainly rounded and sub-rounded with crescentic percussion marks and high gypsum concentration | Detrital input from intense aeolian deposition processes in warm conditions |
| Facies F2 | Poorly sorted very fine sands, MS values are generally higher than those of F1 (from 20 to 70·10−6 SI units), salt and gypsum crystals are small and quartz grains are mainly sub-rounded with bulbous edges. Tephra layer from the AD 1631 Vesuvius eruption in Italy was identified at 26 cm in depth. | Aeolian sediments with low-energy transportation |
| Facies F3 | Very poorly sorted silts well laminated, quartz grains are formed by angular to sub-angular shape with conchoidal fractures and V-shaped percussion cracks, MS values are quite high (between 80 and 120·10−6 SI), and evaporite minerals dominate. The second tephra layer was identified at 82 cm in depth, suggesting a basal age of 2000 yr BP. | Detrital input from low-energy oued deposit |
| Facies F4 | Very fine sand very poorly sorted, characterized by a few millimeters of light-brown deposits alternating with red sediment laminae; the evaporite mineral contents are low, the MS values are very high (between 70 and 160·10−6 SI) and the quartz grains have commonly a subangular-angular shape with V–shaped percussions | Detrital input from low-energy oued |
| Facies F5 | Blackish microbial mat interbedded within very poorly sorted silty fraction containing evaporitic minerals, MS values are very high | Cyanobacterial structures formed after a high sedimentation rate caused by stronger flood (e.g., Noffke et al., 1997; Lakhdhar et al., 2006) |
The core sediments from Sebkha Mhabeul contain 46–92% of sand, 7–50% of silt, and less than 7% of clay (Fig. 5). The shape of the silt–sand boundary curve is consistent with the standard deviation, grain-size distribution, and skewness curves. When the silt proportion is more important, the sediment is often poorly sorted, and better sorted with decreasing silt contents.
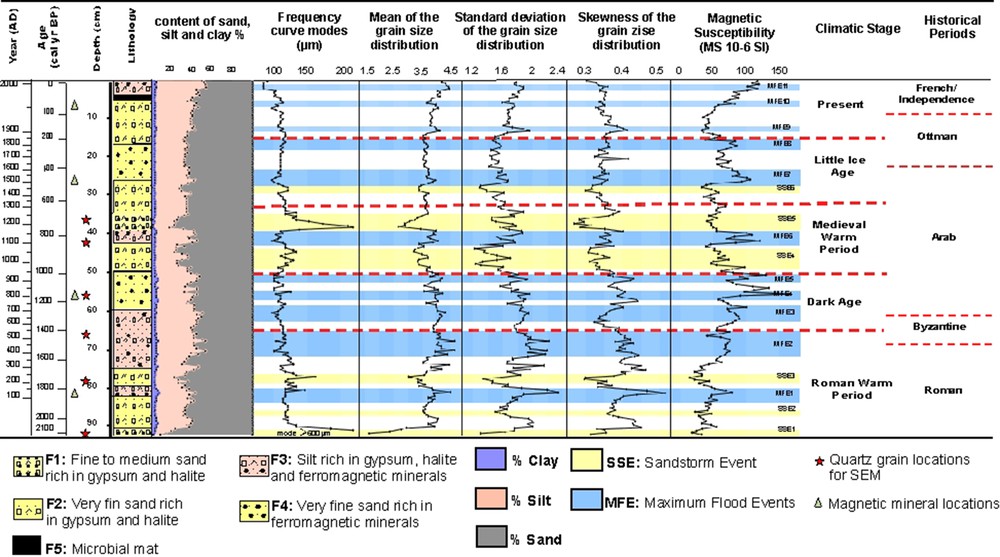
Chronology, lithology, granulometry parameters, magnetic susceptibility and climatic stages of the Mh1 core.
The majority of grain-size distributions indicate a single dominant mode at 110–120 μm, except for a few levels (95, 79, and 39 cm in depth) which are peaked at a modal size ranging from 150 to 650 μm. These coarse modes correspond to fine-medium sand showing a smaller skewness and a trend towards better sorting.
Wide varieties of mechanical and chemical textures that illustrate both depositional and pre-/post-depositional processes have been identified. Three main groups of microtextures that differ in aeolian action, wadi transport, and evaporate periods are characterized along the core (Figs. S2-1, S2-2, and S2-3 in Supplementary Data S2).
Based on the sedimentological data as on mean grain size distribution, MS signals, evaporite mineral concentrations, and surface microtextures of quartz grains, five facies (F1 to F5) were recognized from the bottom to the top of Mh1 (Fig. 4), Table 1.
4.2 Surface temperature variations and climatic periods over the last two millennia
In order to establish climatic intervals during the last two millennia, we first focused on evaporite peaks along the core, which coincide with surface temperature maxima phases. We then divided the core sedimentary record between 0 and 93 cm according to alternating high and low concentrations of evaporite minerals, which testifies to climatic cyclicity. Five climatic intervals were recognized and correlated with those of Marquer et al. (2008) for accurate dating (Figs. 3 and 5). At the Mh1 core's bottom, the great peaks of gypsum and the increasing concentrations of halite and potassium define an initial interval of very warm conditions that ended at ~1400 cal yr BP. This interval is attributed to the Roman Warm Period (RWP), which extended for more than 700 yr. After these warm centuries, a progressive diminution of the surface temperature took place, testified by decreasing evaporite minerals in sediments and leading to the cold episode of the Dark Age (DA), which lasted for ~400 years (1400–1000 yr BP: the end of the Byzantine era and the early Arab period). At 1000 cal yr BP, a new warming trend led to the Medieval Warm Period (MWP), which lasted until 600 cal yr BP. The end of the MWP was marked by a rapid decrease in gypsum and therefore an abrupt change of temperature (Fig. 3). That cooling interval (at the end of Arab-Muslim and early Ottoman eras), known as Little Ice Age (LIA), covered many areas in the world (e.g., Bradley, 2003; Magny et al., 2010). From the last 200 year to the present time, a net elevation of temperature is recognized by a rapid and intense increase in potassium and sodium concentrations.
5 Interpretation and discussion
5.1 Paleo-flood events
Along the Mh1 core, the high MS signals, which coincide with subangular aspect, conchoidal fracture and V-shaped percussion cracks of quartz grain microtextures, indicate that many flood events have occurred throughout the last two millennia in Sebkha Mhabeul. Moreover, for each hydrological event (Maximum Flood Event: MFE), the components were partitioned according to their grain size in order to investigate the way they were transported and to explain the complexity of their polymodal distribution (Table S3 in Supplementary Data S3).
Since 2100 yr BP, eleven maximum flood events (MFE) were recorded from high MS proxy. The flood deposits are made up of silt and sand with an average grain diameter (Mz) mostly ranging from 3.5 to 5 ∅ (very fine sand and very coarse silt). Skewness (Sk) is most frequently close to 0.4. These deposits are very poorly sorted (σ > 1.6 ∅), which indicates that the transport involved a wide range of grain sizes (see Fig. S2-3).
In the MFE1 to MFE11 deposits (Fig. 6), the grain-size distribution curves are polymodal and indicate that (1) the first very small component (C1) is clayed (0.6–0.8 μm), which does not exceed 4%, (2) the second mode (C2) consists of very poorly sorted fine silt (3–8 μm) representing 5–22% of material, (3) the third mode (C3) corresponds to well-sorted very coarse silt showing an average proportion of 14–30%, and (4) the fourth mode (C4) is the main population (45–71%) made up of well-sorted fine sand (100–135 μm).
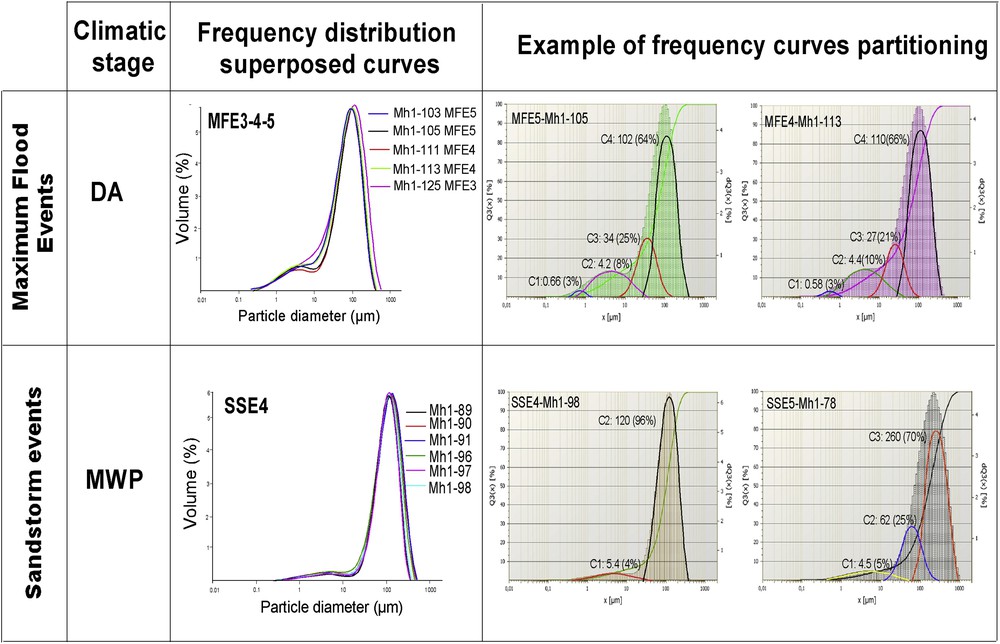
Recognition of flood events (MFE) and sandstorm events (SSE) from frequency distribution superposed and partitioning curves of the Mh1 core.
The MFE1, 2, 3, and 7, dated respectively to ~1840 yr BP, ~1500 yr BP (RWP), ~1280 yr BP (DA) and ~450 yr BP (LIA), represent the major MFE found from the thickness of sediments deposits (between 4 and 6 cm). However, MFE 4,5,6, 8, 10 and 11 are small and of short time (3–1.5 cm in thickness).
5.2 Paleo-sandstorm events (SSE) from the Roman Warm Period to the present time
In the standard deviation curve, the peaks showing a trend towards better-sorted sands are commonly correlated with the MS curve troughs. In fact, the best sorting, the decrease or the absence of heavy minerals in sediments reflecting low magnetism and rounded-to-subrounded quartz grains with bulbous edges, crescentic percussion marks, and upturned plates testify to the prevailing aeolian transport. Indeed, the material blown by the wind ranges from very fine to medium sand, as shown in the values of Mz, and the main mode reaches 120–640 μm, respectively (Fig. 6). The coarsening of sand grains in these aeolian deposits suggests a dominant wind, corresponding likely to sandstorm events. Thus, six paleo-sandstorm events were reconstructed, relying on the above sedimentary proxies.
The most marked sandstorm, as indicated by the coarser modal size reaching 640 μm at the SSE1 and 260 μm at the SSE5, occurred during the RWP and the late MWP, which took place at ~2100 and ~750 yr BP, respectively. The trimodal pattern of grain-size distribution is made up of three components: a first one, C1, in very small proportions, corresponding to very poorly sorted fine silt with a modal size varying from 2 to 5 μm; a second one, C2, ranging from very coarse silt (40 μm) to fine sand (180 μm), representing 25–35% of the sediments; a dominant (64–71%) component, C3, comprised of fine (150 μm) to coarse sand (640 μm).
Regarding the less strong storms (Mz = 3.5 ∅) (SSE2, SSE3, SSE4 and SSE6), they occurred at ~1970, ~1750, ~950 and ~520 yr BP during RWP, MWP, and LIA, respectively. Grain-size distribution curves are often bimodal, showing a minor silty population (4–7 μm) and a main narrow sandy peak (120 μm).
5.3 Sebkha Mhabeul as a paleo-hydroclimatic gauge between the eastern and western Mediterranean
The alternation of flood and aeolian sedimentary deposits in the Mh1 core documents the change of moisture conditions in Sebkha Mhabeul during the last two millennia. In each climatic age, some hydrological pulsations are more important than others.
5.3.1 Roman Warm Period: agreement between the Sebkha Mhabeul records and Eastern Mediterranean results
For the last two millennia, the thick gypsum deposit at the bottom of the Mhabeul core defines an initial interval of broad warm conditions corresponding to the Roman Period. This warm interval should correspond to the well-known Roman Warm Period, an interval which has been correlated with a phase of relatively high solar flux (e.g., Bond et al., 2001; Usoskin et al., 2007).
The paleo–hydrological activity reconstructions in Sebkha Mhabeul indicate that the RWP included two flood events, from 1910 to 1800 yr BP and from 1640 to 1400 yr BP (Fig. 6). The first flood (MFE1) is compatible with a stabilization phase of vegetation around Lake Ichkeul, probably due to more humid conditions at ~1900 yr BP (Stevenson et al., 1993). From 1700 to 1520 yr BP, the Sebkha Mhabeul sedimentary record is marked by a lack of strong inundation episodes or dust storms, suggesting stable climatic conditions, with a strong increase in the arid/saline Chenopodiaceae pollen type, indicating local arid conditions (Marquer et al., 2008). From AD 430 onwards, a progressive increase in flood event intensity and/or frequency in Sebkha Mhabeul with a local increase in aquatic plants was observed by Marquer et al. (2008), which is in good agreement with our results corresponding to the MFE2. In southern Tunisia, there was a deficit in the hydrological balance due to increased temperature and evaporation during the RWP.
When comparing the paleo-floods inferred from Sebkha Mhabeul with the flood reconstructions of the Mediterranean region, we found a consistent correlation with drought periods of the eastern part and an inverse correlation with a moisture climate of the western part during the RWP. This comparison showed that the second hydrological pulsation (MFE2) recorded in the Sebkha was concomitant with extremely high sediment accumulation rates in the Southeast of the Mediterranean Sea (Schilman et al., 2001). In addition, this flood activity, contemporary with high evaporation in Tunisia, was almost synchronous to the lowering of the sea level in the Dead Sea (Neumann et al., 2010) and Nar Gölü-Turkey levels (Jones et al., 2006), whereas in the western Mediterranean, historical floods showed moisture and the most humid conditions for the 2.5–1.7 cal yr BP period in the Alboran Sea (Puertas et al., 2010) and in the East Iberian Peninsula (Aguilera et al., 2011).
5.3.2 Dark Age: wet climate in Tunisia and in the eastern Mediterranean
The relative DA thermal minimum, showing a fall in the concentrations of mineral salts, took place from ~1400 to ~1000 cal yr BP. This period coincides with decreasing solar insolation in the Northern Hemisphere (Steinhilber et al., 2009).
The DA is characterized by two main flood events, as shown by the sedimentary records of the Sebkha Mhabeul. The increased humidity is consistent with the enhanced fluvial dynamics phase in northern Tunisia (Faust et al., 2004; Zielhofer and Faust, 2008). Around 1300 cal yr BP, a small flood event was recorded by Marquer et al. (2008) and in this study (Fig. 5). Furthermore, the timing of flood-frequency periods associated with high precipitation rates for the Kairouan region (central Tunisia) (Saadaoui, 1982) is similar to that shown by the MFE4 records of Sebkha Mhabeul.
Historical data for extreme flood events in the eastern Mediterranean are similar to the Sebkha Mhabeul sediment records during DA. In the Southeast of the Mediterranean Sea, the maximum precipitation was recorded at ~1300 yr BP (Schilman et al., 2001), with high-stand levels of the Dead Sea (e.g., Lev-Yadun et al., 1987; Issar, 1990) and of the Turkish lakes (Lemcke and Sturm, 1996). In the central Mediterranean Sea, Dragoni (1998) showed high lake levels in central Italy from AD 750 to AD 850. However, in the southern Mediterranean, a gradual decrease in precipitation and drier conditions have been recognized in the northwestern Iberian Peninsula (Bernárdez et al., 2008) and in the Alboran Sea (Puertaset al., 2010).
5.3.3 Medieval Warm Period: precipitation/evaporation (P/E) balance deficit in Tunisia and in the western Mediterranean
The new warm conditions, perfectly outlined by the gypsum deposits, particularly during the end of the MWP, lasted ~350 years. Hence, the MWP has been described as the most recent preindustrial warm period noted in Europe and over the Northern Hemisphere (Mann and Jones, 2003), which led to prolonged droughts and exceptional rains (Bradley et al., 2003; Till and Guiot, 1990).
The Sebkha Mhabeul paleoflood reconstruction for the MWP, which is contemporary with the Arab-Muslim era, reveals that the MFE5 and short-term periods of intense inundation events FE2, FE3 and FE4, determined from ~AD 1000–1200 by Marquer et al. (2008), are almost synchronous. In addition, the MWP corresponds to a period of geomorphic stability, which is shown by fine-grained sedimentation, low humidification and gypsum crystals referring to relatively dry conditions within the Medjerda floodplain (Faust et al., 2004).
A pattern of hydrological deficit has been broadly found in other records of western Mediterranean regions. Lower lake levels and higher salinities were reconstructed from Spain and the island of Pantelleria (Italy) (Álvarez et al., 2005; Julià et al., 1998; Moreno et al., 2008; Puertas et al., 2008). Moreover, Lehner et al. (2012) explained that, during the medieval times, the European region was dominated by a persistent positive phase of the North Atlantic Oscillation (NAO). Slightly towards the south, Puertas (2010) showed a gradual decrease in precipitation and the driest conditions during the MCA (1.4–0.7 cal kyr BP) in the Alboran Sea. On land, the cedar tree-ring sequence from Morocco's Middle and High Atlas mountains provides a highly resolved late winter to early summer hydroclimatic records for the last 950 years (Esper et al., 2007) and gives support to the hypothesis that the MCA has been climatically drier than the subsequent LIA.
In contrast, in the eastern Mediterranean, the Nar and Van lake records show similar overall trends for the last 1100 years, with a generally wetter phase during the MCA (AD 950 to AD 1300; Roberts et al., 2012). This pattern is shown by higher water levels of the Dead Sea at AD 1100–1300 (Migowski et al., 2006; Roberts et al., 2012). Moreover, marine records in the Southeast of the Mediterranean Sea (Schilman et al., 2001) indicate a wet phase during the latter part of the MCA at AD 1200–1400.
5.3.4 Little Ice Age: synchronous temperature decline and precipitation increase in Tunisia and in the western Mediterranean
The cold period (LIA) started at 650 cal yr BP and lasted until the second half of the 19th century. That cooling interval was broadly reported many areas in the world (e.g., Bradley, 2003; Magny et al., 2010).
Fig. 6 shows that the LIA is not homogeneous and is characterized by a succession of high (MFE7 dated at 500-400 yr BP) and weak (MFE8 elongated from 265 to 200 yr BP) flood activities in the Sebkha Mhabeul. These events are consistent with Marquer et al. (2008) and Saadaoui (1982) results. Furthermore, Faust et al. (2004) demonstrated that a set of disastrous flood events started at 400 cal yr BP in the mid-Medjerda basin.
A preliminary comparison of the climate evolution in the Mediterranean showed a contrast between western and eastern regions. Indeed, research has shown higher flood activity in large rivers in southern Europe, notably in France (e.g., Arnaud et al., 2005; Debret et al., 2010), Italy (Belotti et al., 2004; Giraudi, 2005) and Spain (e.g., Fletcher and Zielhofer, 2011; Moreno et al., 2008). However, a decreased freshwater input was mentioned by most of the studies, meaning the establishment of dry conditions in the eastern Mediterranean (e.g., Bar-Matthews et al., 1998; Jones et al., 2006).
Therefore, the comparison of the humid climatic conditions during the LIA in southeastern Tunisia with these in the Mediterranean region indicates a consistent correlation with the western part of the Mediterranean region.
5.3.5 Present time: latitude position-relative effects on the precipitation distribution in the Mediterranean regions
For the last 200 years, the temperature increase is related to the increase of solar activity (Scafetta, 2012) and the increasing global average temperature by ~1 °C over the past century (Van Wijngaarden, 2014).
The climate of Sebkha Mhabeul is characterized mainly by low annual precipitation and relatively high multi-decennial variability showed by spaced and very low thickness of flood deposits during the 20th and 21st centuries. There is a good agreement between the MFE 9, 10 and 11 in Sebkha Mhabeul and two inundation events: the first one occurred in 1902, affecting all the Tunisian territory (Fehri, 2014), whereas the other one took place in 1969 (Poncet, 1970) and 1990 (Hamza, 1993; Hmercha, 2010), extending to central and southern Tunisia, respectively.
Louis et al. (2010) detected an absolute rainfall decrease in the Iberian Peninsula (except in autumn) that can be explained by the climate subtropicalisation. Climate records from the eastern Mediterranean lake sediments showed dry conditions during the first half of the 20th century and wet conditions in the second half of this century, as in Turkey (Jones et al., 2005).
5.4 Sandstorm events in Sebkha Mhabeul and their equivalent proxies in the Mediterranean regions
An increase in the Saharan sand input pulses or decrease in wadi detrital input have been previously analyzed at some depths of the Mh1 core using a variety of proxies such as grain-size parameters, granulometric frequency curve partitioning, MS and surface microtextures of quartz grains. In the present study, Mh1 core indicates that sedimentation was characterized by an enhanced supply of Saharan sand during warmer periods (RWP and MWP) and a decreased supply or absence of Saharan effects during colder or less warmer periods (DA and LIA) (Fig. 5).
In Sebkha Boujmel (Jaouadi et al., 2016), the abundance of Artemisia pollen in sediment from 1000 to 600 cal yr BP can be used as a climate proxy that attests arid climate, and a frequent sandstorm input phase corresponding to the SSE 4, 5, and 6.
The aeolian input contribution to the Mediterranean sediments is extremely high in comparison with other regions, as it is located next to the major dust source of the globe, which is the Sahara–Sahel region (e.g., Washington et al., 2009 in Martinez-Ruiz et al., 2015). Thereby, high-resolution studies (e.g., Martin-Puertas et al., 2010; Moreno et al., 2012; Nieto-moreno et al., 2013) on marine sediments cores from the westernmost Mediterranean have provided a detailed aeolian input based on element ratio proxies. It has been shown that the Medieval Climate Anomaly is punctuated by a high increase of the influx of Saharan dust and a reduction in fluvial particles. The sandstorm events determined in the Sebkha Mhabeul at 1000-600 yr BP are consistent with these studies.
The fifth sandstorm event was contemporaneous with gypsum precipitation when warmer conditions characterized the Medieval Maximum. This period includes a phase of increased solar irradiance and high levels of explosive volcanism (Zicheng and Ito, 2000).
6 Conclusions
In this study, paleoclimate reconstruction based on MS signal with grain-size data and scanning electron microscopic observations of quartz grains gives evidence of a climatically variable Late Holocene in southeastern Tunisia. The studies of the Sebkha sediment core identify changes in the temperature, wadi input, and aeolian pulsation in sedimentary records.
The geochemical data, which present the variability of Ca, K, and Na concentrations throughout the Mh1 core, allow identifying alternative periods of warm episodes (RWP, MWP and Present), characterized by high evaporite mineral concentrations and cold or less warm episodes (DA and LIA) represented by silty sequences that register low salt contents in Sebkha Mhabeul.
Important wadi input peaks have been detected from high MS values and were recorded during both warm and cold periods. However, the frequency and intensity of flood events are different from one climatic age to another, as shown by the MS curve peaks, which coincide with the abundance of magnetic mineral grains found in detrital sediments transported by floods. This flood signature is supported by surface microtexture on quartz grains, characterized by subangular appearance, conchoidal fracture, and V-shaped percussion cracks.
The strongest and frequent aeolian pulsations have been identified from the granulometric index showing a trend towards better-sorted sands, low magnetism due to a decrease or an absence of heavy minerals in sediments, the abundance of rounded to sub-rounded quartz grains with bulbous edges, crescentic percussion marks, and upturned plates suggesting an aeolian origin during warm periods.
Combining the results derived from the present study and paleo-climate spatial variability, the previous studies show variations in precipitation in the Mediterranean region during the last 2100 yr. Flood events recorded in southern Tunisia seem to be related to climate change in the Mediterranean basin. In fact, we demonstrate that, during the RWP, a drought period with some flood activities have affected southern Tunisia as well as the eastern part of the Mediterranean. However, a wet climate in both Tunisia and the eastern Mediterranean was recognized during the DA. Since the MWP, there has been a strong similarity in flood behavior with the western Mediterranean, with more frequent flood events, especially during the LIA.
Acknowledgements
The authors would like to thank Mr. Moncef Saiidi from the “Entreprise tunisienne d'activités pétrolières” (ETAP, Tunisia) for providing us with the SEM analysis of quartz grains, and Mohamed Sghair Ben Reguiga for his technical assistance. Special thanks are due to Prof. Xiaoguang Qin (Key Laboratory of Cenozoic Geology and Environment Institute of Geology and Geophysics, Chinese Academy of Sciences) for providing the software applied to the lognormal distribution of the function method. This study was financially supported by the GEOGLOB Laboratory, “Géoressources, environnement naturels et changements globaux” (03UR10-02) and the University of Sfax. We also thank Pr. Soussi, and Pr. Oueslati for critically reviewing the manuscript and providing helpful comments for its improvement.