

1 Introduction
The chemotaxonomic assessment of phytoplankton populations in natural waters requires good biochemical markers and efficient analytical tools. The analysis of photopigments by high-performance liquid chromatography (HPLC) has fulfilled the above requirements, since its application to marine [1] and shelf waters [2,3]. Analysis of natural phytoplankton extracts allowed identification of taxon-specific algal pigment concentrations and profiles [4] (chlorophylls and xanthophylls). The taxon-specific pigments were first used as qualitative biomarkers of phytoplankton composition [5,6]. In a second step, HPLC methods have been used to quantify phytoplankton seasonal succession and composition in a variety of aquatic ecosystems, including lakes [7,8], estuaries [9] and oceanic systems [10].
To estimate the biomass of phytoplankton groups from the pigment concentrations, various approaches have been used: linear regression between the different marker pigments and chlorophyll a with calculation of a ratio considered as constant [11], or abundance of individual phytoplankton groups determined from concentrations of the different marker pigments using multiple linear regression equations [12,13]. These studies were based on chlorophyll a (chl a)/marker pigment ratios and provided a chemotaxonomic assessment of phytoplankton population composition.
Despite this advance in quantitative estimations, variation in estimated biomass or abundance led to predictions of unrealistic concentrations for these classes, or often to large variations around 100% of the theoretical total abundance [2,14]. These weak estimations were essentially explained by variation in concentrations of carotenoids relative to chlorophyll a content in cells exposed to light-harvesting or nutrient depletion or both [15,16]. Other estimations could be biased by catalysis of chlorophyll a into chlorophyllides and phaeopigments when cells are senesce [17], exposed to stress [18,19], to nutrient limitation [20], or grazing [21,22].
The various photopigments analysed by HPLC have been defined as ecological or physiological markers of phytoplankton populations. Some of these pigments were not integrated into the chemotaxonomic assessment due to their ubiquity in several algal groups, even though these pigments may present high concentrations, sometimes greater than measured chlorophyll a. On one hand, xanthophylls or carotenoids are often considered as marker pigments for algal groups, whereas they are known to be better conserved in water and correspond not only to living cells but also to senescent or dying algae. On the other hand, for the chemotaxonomic approach, chlorophyll a breakdown products, which may concur with non-degraded marker pigments, have rarely been considered in calculating the individual phytoplankton class abundances.
In our experiment, we used a HPLC method to analyse and identify the phytoplankton population composition and succession, under a variety of environmental conditions.
This method was chosen together with microscopic counts. The distribution and relative importance of micro- and nano-plankton measured with this method highlight their importance in our experimental ecosystems. Accurate assessments of phytoplankton populations were limited mainly by preservation and identification problems, as already observed in ecosystems [23,24]. The pigment profiles obtained showed that the quantities of chlorophyll a degradation products and the chemotaxonomic assessment resulted in poor biomass and total abundance predictions for the major algal groups. Because of the specificity of our experimental ecosystems (i.e., lentic and shallow mesocosm) and previous observations of deviations of chemotaxomic estimations, we propose an improvement of the estimation of the phytoplankton group abundance calculation with the integration of chlorophyll a breakdown products, especially with the addition of chlorophyllide a, the main degradation product to chlorophyll a. We tested this improvement in one mesocosm and extended it to the 11 other experimental ecosystems. This improvement was applied to analyse our phytoplankton populations, through an estimation of global microalgal biomass including living and senescent or degrading cells.
2 Materials and methods
2.1 Mesocosms
A one-year study was conducted in twelve artificial ecosystems. These mesocosms were designed in order to study potential impacts of two xenobiotics on the dynamics of a lentic and shallow freshwater ecosystem. These simplified experimental ecosystems were located outdoors and exposed to natural climatic conditions, i.e. the temperate oceanic climate of Western Europe in Brittany (France).
The mesocosm dimensions were 6-m long by 4-m wide and 1.2-m deep, with a 10-cm thick layer of artificial sediment (51% of sand, 17.5% of clay and 31.5% of natural sediment), covered by 18 m3 of dechlorinated water to obtain a water depth of 90 cm. Organisms such as macrophytes (Scirpus lacustris) and macroinvertebrates (Lymneae palustris, Chironomus sp., Anisus rotundatus, Asellus aquaticus, Tubificidae) were introduced. Other organisms (Zanichellia sp. and Myriophyllum sp.) colonized the mesocosms naturally during the one-year period of maturation. Two inocula of plankton from a nearby lake were mixed into each mesocosm before the beginning of the study (summer 1998). The experiment started in April (1999) and lasted for one year. Measurements of biotic and abiotic parameters used as indicators for phytoplankton community dynamics were carried out either on a monthly basis or every two weeks depending on the season. Chlorophyll a and photopigment concentrations were measured on bi-monthly basis from April 1999 to November 1999, and then monthly until the beginning of March 2000.
2.2 Plankton sampling and pigment processing
Water samples for pigment analysis were collected in a Niskin modified sampler, in the water column of each mesocosm. Each sample (0.5 to 4.5 l) was filtered onto a 47-mm-diameter glass fibre filter Whatman, GF/C, for pigment processing. Filters were then immediately wrapped in aluminium foil and stored at −70°C until pigment extraction (without exceeding 10 months of conservation). Storage in ultracold freezer was proved to cause minor degradations of phytopigments, for chlorophylls and xanthophylls [25]. Phytopigment extractions were completed on the basis of common methods [26–29]: (1) extraction was conducted by adding 10 ml of 90% acetone to the thawed filters in 20 ml vials, (2) filters were broken into pieces and stirred gently, (3) vials were sealed with Teflon caps and kept overnight in the dark at 4°C, (4) acetonic extracts were centrifuged for 5 min at 8000 g to remove cellular debris and glass filters (Jouan, MR 1822, France) and (5) supernatant was then filtered through a 25-mm glass-fibre filter (Whatman GF/C, 1.2-μm pore size) to remove fine particles, (6) samples were stored at 4°C until injection into the chromatograph (within a few hours). All procedures were conducted under subdued light or in dark in order to prevent photo-degradation.
2.3 HPLC measurements and pigment analysis
The system used for HPLC analysis consisted of a Spectra Physics 8800 ternary pump (TSP, USA), a Rheodyne 7125 injector with a 20-μl-injection loop, a 3-μm C18 Chromsep column (100×4.6 mm, 28076, Chrompack) and a Spectra Focus photodiode array detector (TSP, USA), for screening absorbances from 350 to 700 nm. Data were stored and processed on a PC compatible computer running on OS/2 platform with PC 1000 software (v3.0.3, TSP, USA).
Chromatography of phytoplankton extracts was carried out with a gradient system following the protocol developed in [30] and modified in [31]. The procedure consisted in the injection of 20 μl of the extract that ran through a 30-min ternary gradient with a flow rate of . The HPLC system was calibrated with the main xanthophyll and chlorophyll pigment standards, i.e. 19 pigments. Xanthophylls: lutein, perididin, neoxanthin, violaxanthin, diadinoxanthin, alloxanthin, fucoxanthin, 19′-butanoyl-oxyfucoxanthin, β′ε-carotene, prasinoxanthin and zeaxanthin. All standards were provided by the International Agency for 14C Determination (VKI, Hørsholm, Denmark). Chloropigments: chlorophyll c2 came from the International Agency for 14C Determination (VKI, Denmark), chlorophyll a and b from Sigma (Switzerland).
The chlorophyll breakdown products (chlorophyllide a, b, phaeophytin a and b and phaeophorbide a) were obtained following the Jeffrey protocols [32] from pure algae culture.
The spectral characteristics of the standards and purified pigments in the HPLC eluent (90% acetone) were examined using a spectrophotometer and the optical density determined at 440 nm. Their absorption spectra was registered and their identification was further validated by comparison with spectra obtained by [33]. Pigments chromatograms were resolved, using a library of pigment spectra and checked by hand, obtained by diode array detection on acquisition of standard pigments and extracts of pure algae culture. Pigment concentrations were obtained following the method proposed by [34] using the peak area obtained, the given concentration and specific extinction coefficient published for each standard pigment [33]. The conversion factors obtained were used to convert pigment area identified in concentrations in μ. Our chromatographic system did not separate zeaxanthin from lutein. The corresponding peak of those two pigments was quantified as if only lutein were present.
Five successive measurements gave standard error below 5%. Each sample was duplicated, peak areas varied between 0.1 and 20% depending on the pigment quantities in samples.
2.4 Chemotaxonomic approach
Chemotaxonomic methods provided quantitative estimates of relative abundances between algal divisions for marine [13,35], coastal [9,36] and freshwater ecosystems [8]. For the 19 pigments used as standards in this study, some were chosen as marker pigments because of their ecological value present in specific algal groups. Some of these are relatively specific to divisions or families of phytoplankton: alloxanthin for Cryptophyceae, lutein for Chlorophyceae, chlorophyll b for Chlorophyceae and Euglenophyceae, perididin for Dinophyceae, chlorophyll c and fucoxanthin for Bacillariophyceae, fucoxanthin and 19′-butanoyl-oxyfucoxanthin for Chrysophyceae [3,28,36–39]. For the last two groups, fucoxanthin was retained for Bacillariophyceae and 19′-butanoyl-oxyfucoxanthin for Chrysophyceae.
2.5 Multiple regression analysis
We applied multiple regression analysis to determine the ratio of chl a/marker pigment (mp) for each algal group. The previously selected marker pigments and chlorophyll a concentrations for the whole sampling period were used to estimate the ratios in each mesocosm [10,11,29,36].
The multiple regression analysis was applied to pigment concentrations with the following protocol: each chosen marker pigment was included in the equation and also its concentrations for each sampling time. The different ratios for each marker pigment were calculated with multiple linear regression analysis, and the mean ratios for the experiment period were calculated with regression coefficients, signification level and standard deviation for each ratio (Minitab v12, W95/NT, Minitab Inc.). This protocol was applied to each mesocosm. The results gave regression coefficients from 65 to 95% at p<0.01 for all mesocosms.
The calculated ratios showed high variability due to variations in environmental conditions. Comparison with previously obtained ratios for pure algal culture strains [7,9,12,40,41] (Table 1) was consistent despite their great natural variability.
Comparison of estimated mean molar ratios obtained with multi-regression analysis and bibliographic results for the marker pigment ratios (Chl a: chlorophyll a, Lut: lutein, allox: alloxanthin, perid: perididin, fucox: fucoxanthin and but-fucox: 19′-butanoylfucoxanthin pigment concentrations, in )
| Ratios | Chl a/lut | Chl a/allox | Chl a/perid | Chl a/fuco | Chl a/but-fucox |
| Estimated in this study (mean±SD) | 3.9 (4.15) | 2.1 (2.3) | 4.1 (6.9) | 2.15 (1.25) | 1.84 (1.56) |
| Other studies (references) | 3.53 [13] | 2.54 [21] | 1.7 [39] | 1.8 [9] | 0.9 [12] |
These estimated chl a/mp ratios allowed conversion of pigment marker concentrations to chlorophyll a equivalent quantities, the result was then divided by the measured chlorophyll a concentration, and converted to relative proportion of each algal class (chlorophyceae, dinophyceae, bacillariophyceae, chrysophyceae, cryptophyceae) following Wilhelm's calculations:
Results of measured and calculated chlorophyll a concentrations were analysed with a linear correlation coefficient test. When all these results were analysed together, the Spearman correlation test was applied due to the non-equality of variances (Statgraphics 95, USA). To correct deviations to the normal distribution these data were log+1 transformed.
2.6 Assessment procedure with/without chlorophyll a breakdown products
Improvement of the chemotaxonomic assessment including chlorophyll a breakdown products was proposed because of the specificity of our experimental ecosystems. The last stage of chemotaxonomic calculation (i.e. the calculation of algal group abundance and global abundance) was applied with measured chlorophyll a concentrations, then with the sum of measured concentrations chlorophyll a and its breakdown products (chlorophyllide a and phaeophytin a when present).
In the following text, the measured concentrations of chlorophyll a in HPLC analyses is noted chl a, the estimated chlorophyll a concentrations with the chemotaxonomic approach, for the different algal groups, i.e. the sum of the estimated concentrations is noted calc-chl a, and the sum of measured concentrations chlorophyll a and its breakdown products (chlorophyllide a and phaeophytin a) are noted CHL A.
Comparisons between the calculated global abundance and the theoretical global abundance were applied for each mesocosm and each sampling time. The theoretical global abundance corresponds to a total recovery of estimated chlorophyll a from the different algal groups and so to a ratio of 100%. Deviations between theoretical and calculated abundances were estimated following calculation of the difference between the global abundance and the theoretical one. Then these differences were transformed in absolute values. These calculations were done for the two treatments: global abundances calculated with and without chlorophyll a breakdown products. Results were used in a non-parametric analysis of variance (i.e. Kruskal–Wallis) test on the two distributions of abundance deviations with one factor: the seasonal change (Statgraphics 95, USA).
3 Results
3.1 Importance of chlorophyll a breakdown products
The mesocosms were considered to be oligo- to mesotrophic ecosystems, on the basis of the nutrient and chlorophyll a concentrations, with mean annual chlorophyll a concentrations which varied between 5 and 10 μ. No detectable concentration of phaeophorbide a was measured in any mesocosm.
In terms of relative abundance (Fig. 1), chlorophyll a concentrations represented the most abundant pigment with an annual range between 3 and 68% of total pigments, followed by chlorophyllide a with a range varying between the detection level and 65%, and the other pigments (chlorophyll b and c, lutein, β-caroten, alloxanthin, and diatoxanthin) ranged between 1 and 20%, during summer and even 50% in autumn, corresponding to successions in phytoplankton populations.
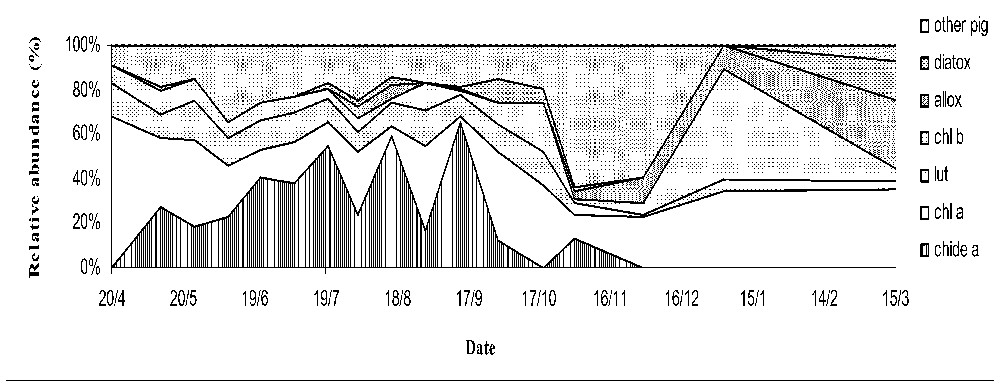
Relative abundance (expressed in percentage) of the mean molar concentrations of the different phytoplankton pigments detected in one mesocosm (diatox: diatoxanthin, allox: alloxanthin, chl b: chlorophyll b, lut: lutein, chl a: chlorophyll a, chide a: chlorophyllide a pigments).
Chlorophyllide a was the first breakdown product of chlorophyll a and, the main breakdown product in this experiment: it represented up to 65% of the total quantities of pigment during summer (Fig. 1). The chlorophyllide a peaks occurred during the growing period from May to October. Significant correlation were found between chlorophyllide a and chlorophyll a (p<0.05), but less than 50% of the variability of chlorophyll a accounted for by fluctuations in chlorophyllide a concentrations.
Concentration of chlorophyll a estimated (calc-chl a) was more than twice the measured chlorophyll a (chl a, Fig. 2A) and temporal changes of chl a and calc-chl a were similar for early spring, autumn and winter, but differed during late spring and summer. The curves of chl a and calc-chl a concentrations were significantly correlated ρ=0.827 (p<0.05), and the variations of chlorophyllide a concentration followed similar pattern to that of calc-chl a. When chlorophyll a breakdown products (essentially chlorophyllide a) were added to chlorophyll a concentrations (CHL A), differences of concentration were smaller and the correlation increased up to ρ=0.942 (p<0.05; Fig. 2B).
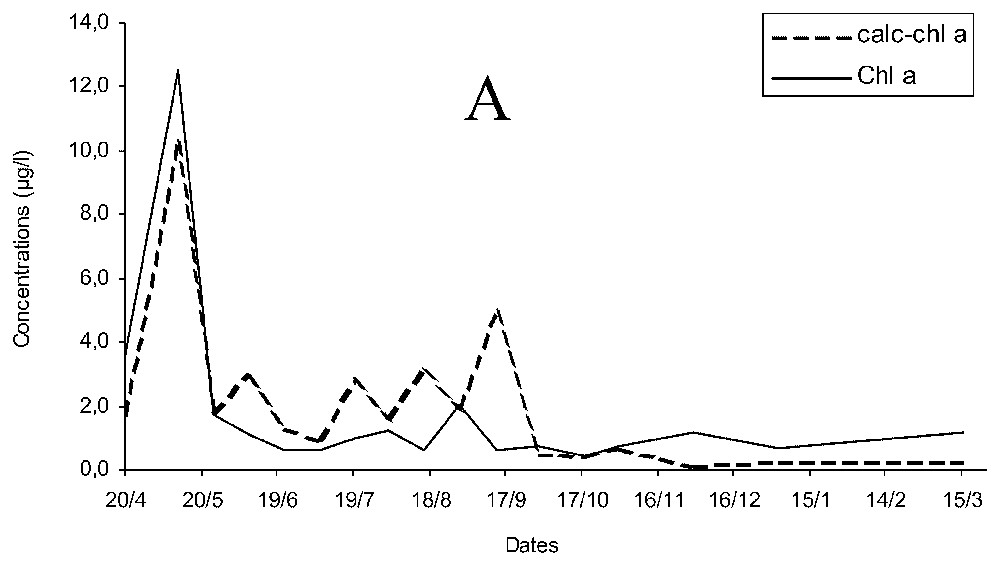
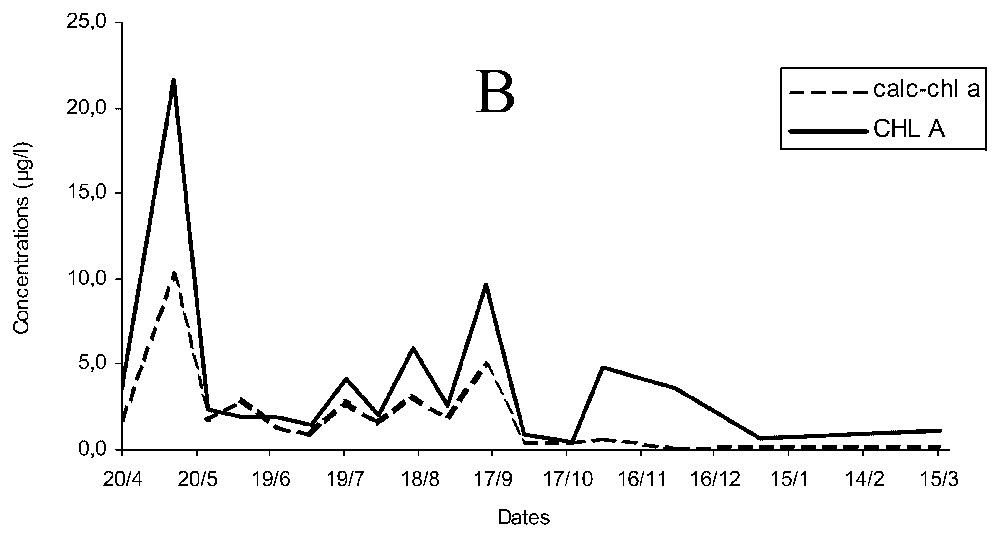
Temporal changes of measured and estimated chlorophyll a concentrations (chl a and calc-chl a) (A) and of estimated chlorophyll a concentrations with measured chlorophyll a and its breakdown products (calc-chl a and CHL A) concentrations (B).
Relative abundances of each algal group were calculated with and without integration of chlorophyll a breakdown products to chlorophyll a. Divergent estimations of the sum of abundances were observed (Fig. 3). The abundance of phytoplankton populations calculated in reference to measured chlorophyll a concentrations, was overestimated, during the summer and autumn season. When chlorophyll a breakdown products were integrated, the results fit better with the theoretical abundance of 100%. In both cases, phytoplankton total abundance estimated dropped down below 40% towards the end of autumn and close to 10% in winter.
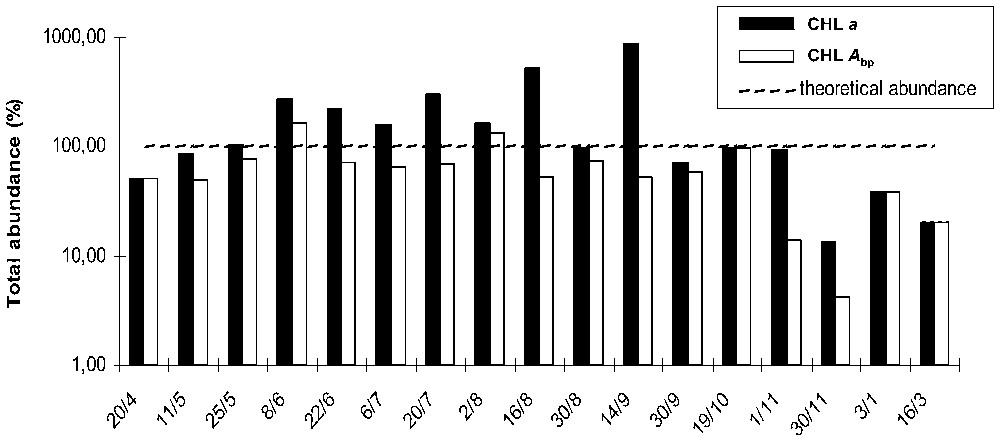
Evolution of the global phytoplankton group abundances calculated with the two assessment procedures, ratio of total calculated equivalent chlorophyll a on measured chlorophyll a concentrations (CHL a) and modified assessment with ratio of total calculated equivalent chlorophyll a on measured chlorophyll a+breakdown products concentrations (CHL Abp): : (Wilhelm's procedure); : (modified calculation).
3.2 Validation of the assessment procedure in all mesocoms
The modified chemotaxonomic assessment including Chl a breakdown products in all the 12 mesocosms confirmed correlations between estimated chlorophyll a and total chlorophyll a (CHL A, Fig. 4). The 12 systems that were originally identical rapidly followed independent changes and became consistently different, especially with regard to the uneven development of submerged plants. Including this variation factor within phytoplankton populations in the 12 mesocosms, the modified chemotaxonomic procedure was tested and improvement of chemotaxonomic assessment including chlorophyll a breakdown products was confirmed for all 12 mesocosms. In comparison, the assessment without chlorophyll a breakdown products gave a correlation coefficient of ρ=0.7 (p<0.05). When standard deviation of total abundance to the theoretical 100% was calculated for the two methods at each sampling date, the non-parametric ANOVA (Kruskal–Wallis test) showed a significant difference between the two distributions (Table 2, p<0.05) with a significantly higher dispersion of the abundances estimated with chlorophyll a only. The modified method including chlorophyll a breakdown products showed a higher compliance with the theoretical abundance (p<0.001) throughout the experiment.
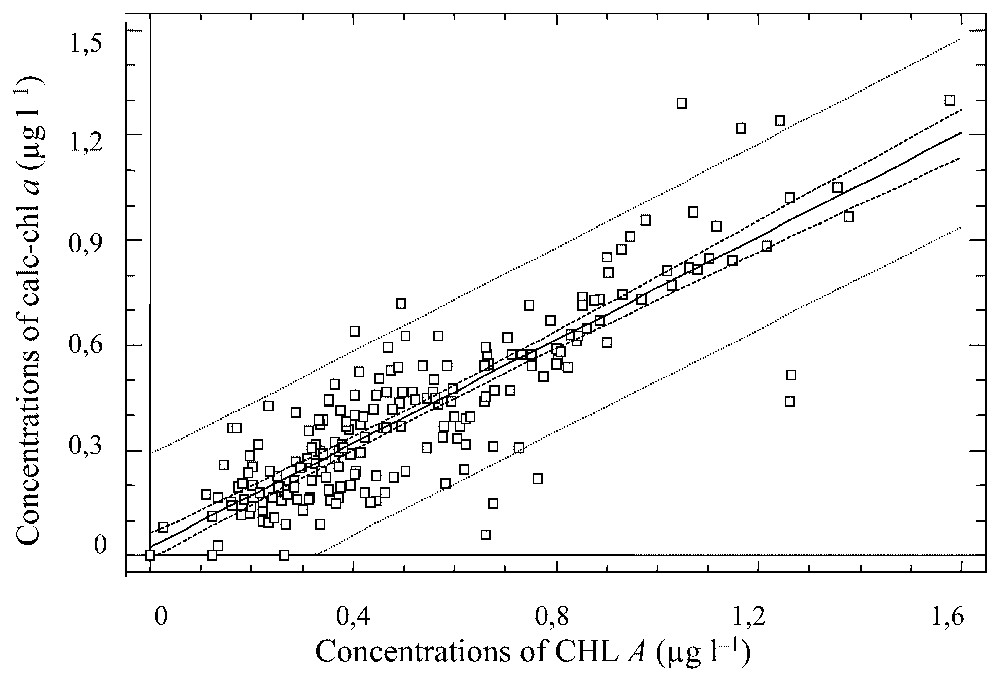
Linear regression curve between estimated chlorophyll a concentrations (calc-chl a) and the sum of chlorophyll a plus its breakdown products concentrations (CHL A) for all mesocosms results.
Kruskal–Wallis tests results on the spread and fitting of the two types of calculation of phytoplankton groups assessment, during the seasons and the experimental period (CHL a: distribution of total abundance calculated with ratio of total equivalent chlorophyll a on measured chlorophyll a concentrations; CHL Abp: total abundance with the modified calculation, i.e. total equivalent chlorophyll a on measured chlorophyll a+breakdown products concentrations)
| ANOVA | Spring | Summer | Autumn + winter | Annual mean |
| n | (n=96) | (n=168) | (n=144) | (n=408) |
| p | p<0.07 | p<0.001 | p<0.001 | p<0.001 |
| Ranks | CHL |
The same test applied to seasonal changes showed different results: a slight difference was observed between the two distributions during spring (p=0.07), and a significant difference (p<0.001) was observed during the growing period (from June to October). During this season, the average ranks of chlorophyll a calculated were higher than the chlorophyll a breakdown product distributions, implying that the modified calculation provided a better estimation of relative abundances for algal groups and calculated global abundance closer to the theoretical abundance.
For fall and winter, there were also significant differences between the two distributions (p<0.001), demonstrating that chemotaxonomic calculation including chlorophyll a breakdown products has the lowest rank, as for summer and spring (Table 2).
4 Discussion and conclusions
The calculation chemotaxonomic assessment refers only to chlorophyll a, considering all marker pigments as issued of living cells. Integration of physiological and ecological significations of phytopigments, in the chemotaxonomic assessment, has never been tempted. In our experimental ecosystems, among the pigments detected, we observed the importance of chlorophyllide a and also of various xanthophylls used as marker pigment compared to chlorophyll a. Following the environmental conditions and specificity of our mesocosms, we would explain the importance and role of chlorophyll a breakdown products and xanthophylls concentrations in the chemotaxonomic assessment for living and degrading biomasses in this limnic, shallow and freshwater ecosystems.
4.1 Chemotaxonomic processes: application to the mesocosms
The various phytopigments showed variations in their concentrations following the ecological and physiological states of the phytoplankton populations. Chemotaxonomy used marker pigments firstly as qualitative indicators of phytoplankton populations, then for quantitative assessment of phytoplankton groups and succession. In the chemotaxonomic procedure, chlorophyll a and algal specific xanthophylls are considered for calculation of phytoplankton biomass, succession and evolution.
This method of calculation has been applied to various ecosystems and conditions and has been validated in our experimental ecosystems. In our mesocosms, we observed amounts of chlorophyll a breakdown products and xanthophylls. These pigments concentrations could be even greater than those of chlorophyll a in some samples. Variations in chlorophyll a contents to other pigments concentrations have already been observed with chlorophyll b concentrations higher than chlorophyll a in seawaters [36], or xanthophylls concentrations equal to chlorophyll a during phytoplankton bloom in lakes and oceans [41,42].
In our experiment, the occurrence of chlorophyllide a was high during the growing period. Then, chlorophyll a could be altered by as much as 50% into chlorophyllide a, in phytoplankton field samples [17].
Another experimental condition was the high irradiance during the growing period, up to 3000 μ during summer with at least dayly exposure above 650 μ of incident PAR. Phytoplankton populations were subsequently exposed to a high transformation rate of chlorophyll a into its breakdown products [43]. This phenomenon of saturating light probably increased dramatically the production of chlorophyllide a and leads to a lack of quantified chlorophyll a with HPLC. Consequently, the chlorophyll a concentration can be underestimated in comparison with other pigments, due to its transformation to chlorophyllide a or other degradation products.
Moreover, the nutrient status of the mesocosms varied between oligo- to mesotrophic ecosystems and the light intensity was high in the water column due to the shallow depth. Consequently, xanthophyll pigments increased relatively to chlorophyll a, as already observed [44,45]. This ecological observation together with the limitations of the method gave poor chemotaxonomic estimates of class algae abundances, during spring and summer. The chemotaxonomic procedure does not include the ecological and physiological significance of the different photopigments, with chlorophyllides and phaeopigments indicators of stress, senescence, grazing or even carotenoids of nutrient depletions and highlighting [19,26,46].
4.2 Improvement of the chemotaxonomic assessment with chlorophyll a breakdown products
The chemotaxonomic assessment processes did not take into account the chlorophyll a breakdown products (chlorophyllide a and phaeophytin a pigments), which are bioindicators of inactive biomass and a part of the necromass. To improve the chemotaxonomic assessment chlorophyll a breakdown products were integrated in the calculation of the total and relative abundances. This modification of the chemotaxonomic procedure gave a statistical improvement of relative and global abundance estimations.
Firstly, the use of estimated specific-pigment ratios gave a significant improvement of the relative abundance estimation when chlorophyllide a was included. Secondly, this protocol was verified and confirmed for all mesocosms and during whole experiment, despite their differences and divergent evolution during the experiment. These experimental conditions and divergences between mesocosms confirmed the robustness of our hypothesis.
Finally, this protocol looks relevant in such lentic and shallow ecosystems where reduced exchanges and exportations of organic compounds and low stratification of the water column, support good conservations of xanthophylls and chlorophyll breakdown pigments.
4.3 Limitations and perspectives of the chemotaxonomic assessment protocol
Variations observed in the chemotaxonomic assessment reflected the seasonal change in succession and dominance of algal groups. Yet, this method has some limitations that can explain the bias in the chemotaxonomic assessment and in the evaluation of algal groups and global abundances. One is related to the deviation of the calculated global abundance to the theoretical one. Such variations have already been observed [2,14].
Submitted to the seasonal succession of phytoplankton populations and environmental conditions, the pigment contents of algae can vary [9,12,21,37,45], but the ratios obtained in the calculation were similar. Integration of chlorophyll a breakdown products in the chemotaxonomic calculation lessened this deviation and included the part of xanthophylls corresponding to degrading biomasses.
Our modified approach can certainly be used in similar freshwater ecosystems where phytoplankton composition and succession can be easily suited and identified. This chemotaxonomic method, due to its scarcity, could be used in different limnic systems, alone or maybe integrated in more complete method of phytoplankton composition estimation. Another problem encountered in chemotaxonomy is the lack of identification of some algal groups due to the underestimation of accessory pigments used as specific markers pigments [29,46–48]. The chemotaxonomic method used takes into account only one marker pigment per algal group. This limits the evaluation of biomass compared to multi-marker pigment protocols.
Other improvements have been found to overcome these problems such as using multi-marker pigments procedures with matrix calculation tested by [12] or more recently the CHEMTAX program of [13] used in various ecosystems [8,9,44].
In conclusion, this modification of the chemotaxonomic method should be tested on the ratios calculation with the multi-linear regression or CHEMTAX method [47], introducing the chlorophyll a breakdown products in the equation, integrating the quantification of biomass and a part of necromass otherwise very difficult to distinguish in these limnic and shallow ecosystems.
Acknowledgements
Laurence Deydier-Stephan has financial support from ‘Région Bretagne’ and the research was partially supported by a program from the French Ministry of Environment (program PNETOX: Utilisation de mésocosmes comme outils d'aide à l'évaluation des risques ecotoxicologiques). We wish to thank the technical staff of the experimental unit of ecology and ecotoxicology of INRA for their help and also the SCRIBE station (INRA Rennes) for the material support during the experiment.