

1 Introduction
Barley is one of the world's most important crops with uses ranging from food to feed production; it represents the fourth most abundant cereal in both area and harvested tonnage. Almost 75% of global barley production is used for animal feeding, 20% for malting and beverage industries, and 5% as an ingredient in a panel of food products (http://faostat.fao.org/). Cultivated barley is among the world's earliest domesticated crop species and is widely adapted to diverse environmental conditions [1]. Barley is the best suitable crop for genetic studies, because of its diploid nature with a relatively small number of large chromosomes and has been widely used as a genetic model [2]. Since wild and cultivated barley share a common genome and are cross compatible, valuable alleles in the wild barley are available to barley breeders for crop improvement [3]. The development of new genomics platforms, transcriptome, metabolome analyses and bioinformatics have facilitated and advanced the dissection of various quantitative traits and the determination of their chromosomal locations, which in turn led to the identification of a number of marker–trait associations in various crop species including barley. Numerous studies revealed the genetic variability within populations of wild barley and its promising contribution of powerful alleles for crop improvement [4–9].
Drought is an important abiotic stress causing the major crop losses worldwide. In the light of climate changes and global warming, where some areas are expected to be more subjected to frequent severe drought, the development of drought-tolerant cultivars is the most efficient and cost-effective strategy for fighting drought stress in low-value cropping systems. Therefore, understanding the genetic control of drought tolerance is of a great importance for the application of marker-assisted breeding in the development of cultivars with improved tolerance. Since barley seems to be relatively well adapted to water deficit, it has proved to be good model to study and understand the genetic control and mechanisms of drought stress tolerance [10]. Drought tolerance is a complex polygenic trait involved powerful epistatic interactions among loci and powerful genotype × environment interactions. However, several genetic, physiological, and biochemical studies have been carried out in the past two decades to explore the genetic control of drought tolerance and its mechanism in barley [11–13]. Several agronomical and physiological traits could be considered for drought tolerance screening under unpredictable environments. Some of these traits include relative water content, shoot traits, and osmotic adjustment, all of which influence the ability of the plant to maintain high turgor and normal growth with less water available [14,15]. Reproductive transition is a fatal developmental stage of crop adaptation to the environment, particularly when the growing season is restricted by terminal stress such as drought. Since the plant can avoid stress periods by early maturity, the development of short-duration varieties is the most efficient approach for maximizing potential yield under terminal drought stress in low-value cropping systems [16,17].
Because of the complexity of the genetic nature of drought tolerance, classical quantitative trait loci (QTLs) analysis applying molecular markers on bi-parental populations is one of the most suitable methods for identifying genes that are involved in drought tolerance. However, it is important to note that classical QTL analysis necessitates the development of a genetic linkage map and is identified based on linkage equilibrium in bi-parental population undergoing just a few cycles of recombination, which limits the resolution of genetic maps and identified QTLs. Moreover, the segregation of major developmental genes in each cross, which either accounted for much of the phenotypic variation makes it difficult to determine whether the identified loci are robust and transient [18]. In addition, in the majority of linkage mapping-based QTL analyses, QTLs identified for physiological traits involved in drought did not co-localize with either the yield or agronomic traits [19]. Therefore, association mapping, which has been successfully applied in human genetics to detect quantitative trait loci (QTL) of complex diseases, is an alternative promising approach. In that context, QTLs are identified in natural populations (no regular genetic structure) using analytical approaches exploiting linkage disequilibrium (LD) between markers, and closely linked QTLs present in a population consist of large numbers of accessions [20–22]. Because the accumulation recombination events during the development of the accessions will have broken down LD between markers and QTL beyond a certain threshold distance, marker–trait association is only expected for a marker that is tightly linked to the QTL [23,24]. The approach can be applied in natural plant populations or advanced breeding lines (e.g., RILs) to identify molecular markers associated with specific phenotypic traits. Furthermore, it is possible to correlate molecular marker frequencies with several phenotypic traits for the same set of population [25–27]. Association mapping enables a finer mapping with higher resolution than the classical QTL analysis using bi-parental populations.
In plant, although some association mapping studies have been performed, the majority of them are on model plant species such as Arabidopsis [28], maize [29,30] and rice [31,32], with initial concerns mostly due to the confounding effects of population structure and the shortage of knowledge concerning the structure of linkage disequilibrium (LD) in many plant species, and association mapping is gaining growing importance in other crop species, due to the great advances in marker-genotyping technologies [25]. The approach has been successfully employed to identify markers associated with various phenotypes in a number of plant species, including salt tolerance or various eco-geographical factors in wild barley [3,6,33], yield and yield stability in barley [34], a range of morphological traits in rice [35] and kernel size and milling quality in wheat [36]. In barley, a few studies have recently been published for different traits including yield and yield stability [34,37], yield under drought conditions [19,38], and drought stress-related traits in barley [39].
With a view to breeding for drought tolerance, the current study was aimed at employing association mapping analysis to investigate the association between 76 simple sequence repeats (SSR) markers and six drought stress-related morphological and physiological traits.
2 Material and methods
2.1 Plant material and phenotyping
A set of 107 six-row spring barley accessions (Hordeum vulgare ssp. spontaneum) collected from 12 different countries (Supplementary data, Suppl. Table 1) were provided by National Small Grains Germplasm Research Facility, USDA, ARS, Idaho, USA. Experiments were conducted in 2014/2015 at the Experimental Farm of Assiut University at a latitude of 27°N. The experiments were arranged in a split-plot design with three-replications, drought treatments assigned to main plots and accessions to sub-plots. Nine seeds were sown in three rows in round plastic pots with a diameter of 25 cm and a depth of 40 cm filled with field soil, with 4 holes at the bottom for drainage. The plants were fertilized three times with 250 mL of NPK liquid fertilizer containing 9% N, 3% P2O5, and 6% K2O in each pot. Sowing dates were staggered so that accessions would experience stress at the flowering stage of development. A well-watered (WW) and severe drought stress (DS) trials were carried out. The WW trials were irrigated with about 500 mL of water per pot each day by drip irrigation. The drought-stressed (DS) trials were also irrigated as WW trials until 20 days before anthesis when water was drastically decreased to 125 mL twice a week. At 2 and 4 weeks after withholding irrigation (corresponding to 1 week before and 1 week after anthesis), respectively, seven leaf disks of 2 cm diameter were sampled from the upper leaves of each pot. The samples were immediately submersed in 5 mL of ice-chilled 80% (v/v) methanol, and these were used for further analyses.
Four weeks after withholding irrigation, several drought-tolerance-associated morphological traits were measured:
- • wilting score (WS), scored from 0 up to 9 (where 0 indicates no symptom of stress effect and 9 with all plants apparently wilted) [40];
- • shoot dry weight/plant (SDW), so that shoot fresh mass of plants from each pot was dried in an oven at 80 °C for 48 h and then the average per plant was calculated;
- • root dry weight/plant, where fresh roots from the whole pot were washed and dried at 80 °C for 48 h and then the average per plant was calculated.
Drought-tolerance-related physiological traits were measured for two plants from each replicate: (i) the relative water content (RWC) was calculated from the two upper fully developed leaves of the main stem from four plants per pot according to Barrs and Weatherley [41]:
2.2 Genotyping
For molecular marker analysis, leaf samples were harvested and freeze dried. Genomic DNA was extracted using the NucleoSpin 96 Plant DNA isolation kit (Macherey and Nagel, Düren, Germany). A set of 76 SSR markers (Supplementary data, Suppl. Table 2) [44] were used. The SSR markers were identified based on their uniform distribution in the genome (Table 2), quality of their PCR product and polymorphism level from the public sequences of Ramsay et al. [46], Karakousis et al. [47], and Rostoks et al. [48].
List of significant SSR markers associated with six drought-related traits measured in av drought-stressed environment over two growing seasons.
| Phenotypic trait | Marker | Chr. | Position (cM)a | Prob.b | r2 (%)c | Effectd | FDRe |
| WS | GBMS046 | 3H | 49.46 | *** | 7.78 | M | 0.018 |
| GBM5210 | 4H | 72.93 | ** | 28.18 | M | 0.022 | |
| Bmac0096 | 5H | 53.12 | ** | 15.53 | M × T | 0.014 | |
| EBmac0602 | 6H | 75.42 | *** | 31.20 | M | 0.020 | |
| GBMS141 | 7H | 93.04 | ** | 9.46 | M × T | 0.011 | |
| EBmac0755 | 7H | 125.21 | *** | 35.78 | M × T | 0.001 | |
| SDW | GBM1187 | 2H | 19.51 | ** | 13.66 | M | 0.021 |
| GBM1284 | 3H | 31.95 | ** | 7.97 | M × T | 0.019 | |
| GBMS046 | 3H | 49.46 | *** | 16.43 | M | 0.014 | |
| GBM1005 | 6H | 131.12 | ** | 9.67 | M × T | 0.007 | |
| EBmac0603 | 7H | 35.39 | *** | 14.07 | M | 0.011 | |
| GBMS183 | 7H | 154.36 | *** | 27.89 | M | 0.007 | |
| RDW | Bmag0872 | 1H | 49.78 | *** | 27.56 | M | 0.006 |
| GBM1462 | 2H | 137.85 | *** | 34.12 | M | 0.006 | |
| GBM1012 | 2H | 149.81 | ** | 9,81 | M | 0.011 | |
| HVM60 | 3H | 73.19 | *** | 7.39 | M | 0.003 | |
| Bmag0853 | 3H | 144.10 | ** | 14.39 | M | 0.013 | |
| GBM1176 | 5H | 18.59 | ** | 9.09 | M × T | 0.009 | |
| Bmac0096 | 5H | 53.12 | ** | 11.09 | M | 0.015 | |
| GBMS077 | 5H | 144.93 | *** | 7.83 | M | 0.005 | |
| Bmac0316 | 6H | 7.16 | ** | 13.89 | M × T | 0.012 | |
| GBMS180 | 6H | 70.16 | *** | 28.65 | M | 0.018 | |
| RWC | Bmac0218a | 2H | 51.14 | ** | 16.11 | M | 0.021 |
| GBM1462 | 2H | 137.85 | *** | 31.24 | M | 0.012 | |
| GBM1472 | 7H | 88.46 | ** | 7.66 | M | 0.010 | |
| EBmac0755 | 7H | 125.21 | ** | 29.80 | M × T | 0.014 | |
| Bmag0135 | 7H | 147.51 | *** | 6.76 | M | 0.009 | |
| PA | Bmag0872 | 1H | 49.78 | *** | 29.90 | M × T | 0.006 |
| GBM1462 | 2H | 137.85 | *** | 6.33 | M | 0.007 | |
| GBM1040 | 3H | 1.69 | ** | 7.12 | M | 0.013 | |
| Bmag0853 | 3H | 144.10 | *** | 10.55 | M × T | 0.003 | |
| Bmag0135 | 7H | 147.51 | ** | 16.76 | M | 0.014 | |
| GBMS183 | 7H | 154.36 | ** | 33.64 | M | 0.010 | |
| OP | GBMS037 | 1H | 66.52 | *** | 11.22 | M | 0.011 |
| GBM1012 | 2H | 149.81 | ** | 29.0 | M | 0.009 | |
| Bmac0316 | 6H | 7.16 | ** | 11.84 | M | 0.005 |
a cM map position according to the map reported by Marcel et al. [44].
b Level of: **; P < 0.01 and ***; P < 0.001.
c Variation of a trait explained by a marker and M × E interaction effect.
d Main effect of a marker (M) and marker environment interaction (M × E).
2.3 Marker polymorphism
The number of alleles produced by each one of the 76 SSR markers was counted, and the frequency of each allele was computed across the whole set of accessions. Allele frequency, gene diversity and polymorphism information content (PIC) were calculated using the software package PowerMarker V3.25 [49]. Marker alleles with a frequency less than 5% in the population were considered rare alleles and excluded from further analyses (treated as missing data).
2.4 Linkage disequilibrium analysis
Linkage disequilibrium (LD) between pairs of SSR loci was determined using the software packages PowerMarker V3.25 [49] and Tassel [50] using the entire set of accessions. LD was estimated separately for all pairs of loci on different chromosomes. Significance P values of LD for SSR pairs were estimated by permutation (10,000 simulations) using the software package Tassel. The squared correlation of allele frequencies (r2) among loci were assessed and the disequilibrium coefficient (D’) values estimated between all pair of loci were plotted against the genetic distance in centimorgans to determine the map distance across which LD can occur within the entire set of accessions.
2.5 Population structure and kinship
Population structure of the 107 accessions was performed using genotypic data of 71 markers using a model based (Bayesian) clustering algorithm in software package STRUCTURE v. 2.2 [51,52]. The analysis was performed with the linkage model on 76 SSR markers allowing for correlated allele frequencies. The program was run for a number (K value) of hypothetical subgroups ranging from 2–15. Analysis was performed using with set parameters of population admixture co-ancestry model and correlated allele frequencies. The hypothetical subpopulations were considered as K = 2–15, and the package was put on run with three independent runs for each value of K. The iteration number for the Markov Chain Monte Carlo (MCMC) algorithm was set as 100,000, following a burn-in period of 100,000 iterations. The K-matrices, and the Q-matrix describing the assignment of each accession to specific clusters, were used in mixed liner model association mapping [20].
2.6 Association analysis
Association analysis between markers and phenotypic traits was performed with a mixed linear model (MLM) using the TASSEL software. It was applied with single-factor analysis of variance (SFA) without Q & K, general linear model (GLM) with Q (individuals membership in the population) [50], mixed linear model (MLM) with K (genetic relatedness) and MLM with K + Q [20]. SFA, which did not consider the structure of the population, was performed using each marker as an independent variable in the GLM in both AMP. Analysis of variance (ANOVA) and determination of Pearson's correlation coefficients (R) among measured traits were performed with Proc Mixed of SAS package version 9.2 (SAS 2008).
3 Results
3.1 Phenotypic evaluation
All measured phenotypic traits exhibited highly significant differences between well-watered and drought-stressed conditions, reflecting, in part, differences in water availability. A continuous phenotypic variation in all measured traits was found (Fig. 1), indicating a quantitative inheritance. ANOVA revealed highly significant genotype × environment interaction. As expected, shoot dry weight (SDW), root dry weight (RDW), and relative water content (RWC) were significantly decreased under drought stress condition with an average of 50.80%, 23.35% and 29.25%, respectively. Meanwhile, wilting score (WS), osmotic potential (OP), and proline accumulation (PA) were increased up to 5, 2 and 16 folds, respectively, compared to the well-watered treatment (Table 1, Fig. 1).
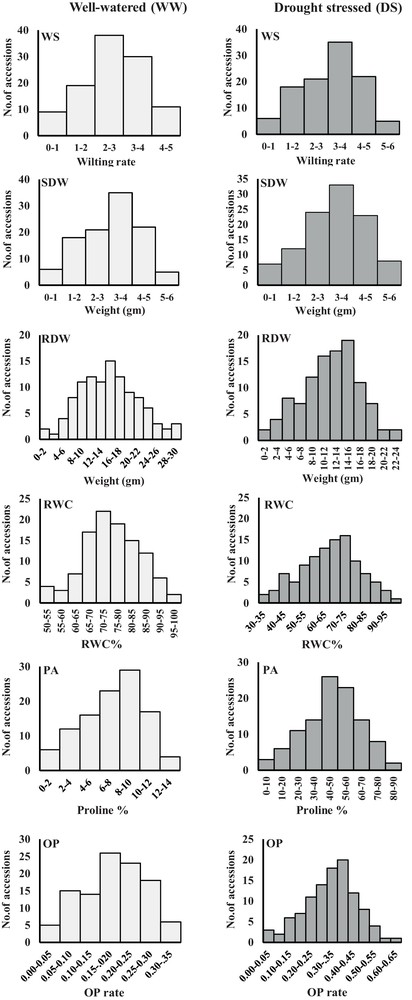
Phenotypic evaluation of 107 barley accessions under well-watered (WW) and drought-stressed (DS) conditions. Accessions were phenotyped for wilting score (WS), shoot dry weight (SDW), root dry weight (RDW), relative water content (RWC), proline accumulation (PA), and osmotic potential (OP).
Polymorphic information of 76 SSR markers for the 12 groups of barley accessions.
| Group | Number of lines | Average number of alleles | Average gene diversity | Average PIC |
| 1 | 7 | 4.24 | 0.52 | 0.43 |
| 2 | 9 | 5.33 | 0.71 | 0.63 |
| 3 | 14 | 3.34 | 0.47 | 0.42 |
| 4 | 9 | 3.32 | 0.47 | 0.42 |
| 5 | 11 | 5.10 | 0.63 | 0.47 |
| 6 | 8 | 4.56 | 0.57 | 0.45 |
| 7 | 10 | 3.26 | 0.46 | 0.41 |
| 8 | 8 | 4.22 | 0.55 | 0.44 |
| 9 | 8 | 4.15 | 0.54 | 0.44 |
| 10 | 12 | 3.89 | 0.49 | 0.40 |
| 11 | 6 | 5.25 | 0.67 | 0.61 |
| 12 | 5 | 3.95 | 0.51 | 0.41 |
3.2 Marker polymorphism
A total of 1036 alleles were scored across 71 SSR markers. Number of alleles per locus ranged from 2 to 17, with an average of 9.13 alleles per SSR. High levels of polymorphism and gene diversity was observed within the 12 structured groups. The value of the polymorphism information content (PIC) for the 12 groups of barley accessions varied from 0.40 (group 9) to 0.63 (group 2). Gene diversity within each group varied according to the different accessions, ranging from 0.46 (group 7) to 0.71 (group 2) (Table 1).
3.3 Population structure and kinship
Population structure analysis was performed using genotypic data of 71 SSR markers using the software package STRUCTURE v. 2.2. Following a burn-in period of 100,000 iterations and setting the iteration number for the MCMC algorithm to 100,000, the 107 accessions subdivided into 12 subpopulations according to the relatively genetic distances using structure and cluster analysis (Fig. 2). The K (the number of subpopulations) was set from 2 to 15 and performed 14 runs for K values, the population structure matrix (Q) was defined by running structure for K = 12, from which the highest likelihood has been obtained (Supplementary data, Suppl. Fig. 1). Cluster analysis based on the DICE dissimilarity index and the unweighted neighbor-jointing method performed using the genotypic data of 71 SSR markers from 107 accessions identified 12 main clusters (Fig. 2).
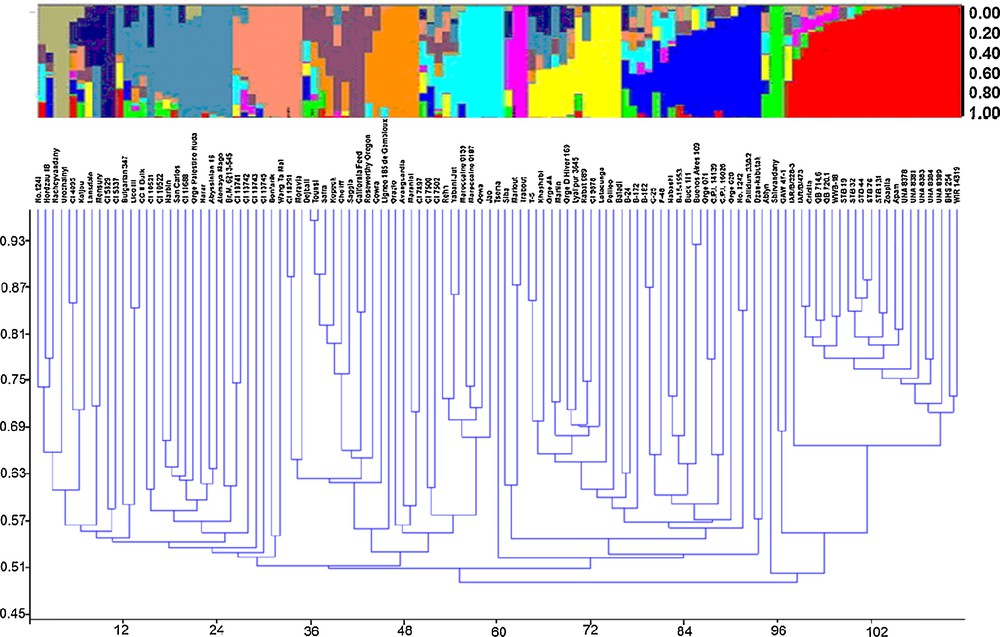
Distribution of 107 accessions within the 12 groups. Each individual is represented by a single vertical line in colored part above the diagram broken into K differently colored segments. The length of the colored segments is proportional to each one of the K inferred clusters or subgroups. The part below the diagram represents cluster analysis based on the DICE dissimilarity index and the unweighted neighbor-joining method.
3.4 Linkage disequilibrium analysis
Linkage disequilibrium of the 107 accessions was evaluated using the 71 SSR markers for a total of 1036 locus pairs. Ca. 61% of the SSR markers used for the analysis exhibited significant LD (P < 0.01). According to the genetic distance between markers, the locus pairs were subdivided into three classes, i.e. tightly to closely linked (< 10 cM apart), moderately linked (10–20 cM apart), and loosely linked (> 20 cM apart). More than 73% of loci pairs were represented by tightly to closely linked and moderately linked loci, while a proportion of less than 27% were loosely linked loci (Supplementary data, Suppl. Fig. 2). Each of disequilibrium coefficient (D’) and r2 values were plotted against the inter-marker genetic distances (Fig. 3). The average calculated values of D’ for marker pairs tightly to closely linked and moderately linked (0.329 and 0.32, respectively) were higher than that of loosely linked (0.30). The r2 values for SSR marker pairs ranged from 0.00 to 0.37, with an average of 0.074.
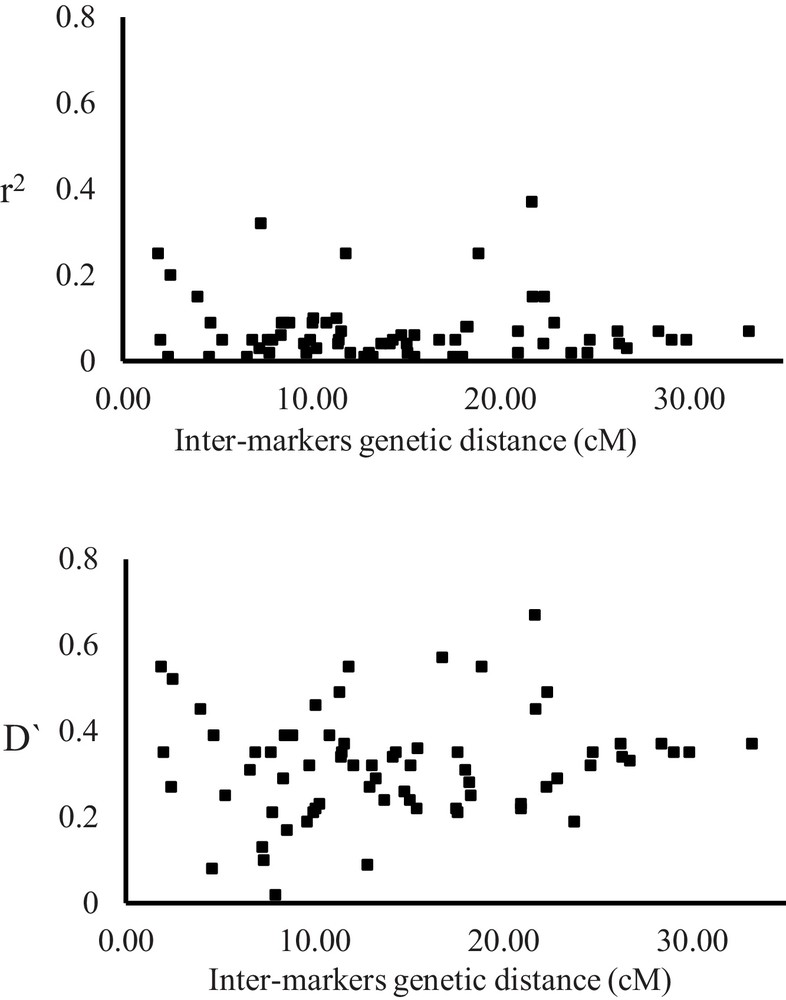
Scatter plots display the significance of linkage disequilibrium (LD) (r2 above and D’) of marker loci as a function of the inter-marker distance (cM) for 76 simple sequence repeats (SSR) markers on the whole barley natural population (107 accessions).
3.5 Association mapping
Association analysis of 76 SSR molecular markers with six drought-associated traits was performed through mixed liner model (MLM) in the ASReml Software Version 2 [53]. The drought-tolerance-associated traits included WS, SDW, RDW, RWC, PA, and OP. Out of the 76 SSR markers, 25 markers exhibited highly significant associations, with at least one of the six studied traits yielding 36 marker–trait associations with an r2 value ranging from 6.33 to 35.78. Of these 36 marker–trait associations, 26 and 10 associations were significant for marker main effects and M × E interactions, respectively (Table 2).
3.6 Wilting score (WS)
Six significant marker–trait associations were detected for wilting score on chromosomes 3H, 4H, 5H, 6H and 7H. Three markers exhibited significant marker main effects (M) and the other four showed significant M × T interactions. The association between WS and markers EBmac0602 on chromosome 6H (75.42 cM) and EBmac0755 on chromosome 7H (125.12 cM) exhibited the maximum phenotypic variance as determined by r2 (r2 = 31.20% and 35.78%).
3.7 Shoot dry weight (SDW)
A total of six marker–trait associations for SDW were identified on chromosomes 2H, 3H, 6H and 7H with a marker main effect only were identified on all chromosomes except 6H (Table 2). The highest effect was observed on chromosome 7H (154.36 cM) associated with markers GBMS183 (r2 = 27.89%).
3.8 Root dry weight (RDW)
Ten marker loci distributed on all chromosomes except chromosomes 4H and 7H were significantly associated with RDW, of which 8 exhibited significant marker main effects (M) and 2 showed significant M × T interactions. The maximum phenotypic variance explained by markers Bmag0872 (r2 = 27.56%), GBM1462 (r2 = 34.12%) and GBMS180 (r2 = 27.56%) located on chromosomes 1H (49.78 cM), 2H (137.85 cM) and 6H (70.16 cM), respectively (Table 2).
3.9 Relative water content (RWC)
Five significant marker–trait associations were identified on chromosomes 2H and 7H. Four of the five marker–trait associations showed marker main effects, while the remaining marker–trait association exhibited marker × trait interaction effect. Three SSR markers, i.e. GBM1462 (chromosome 2H, 137.85 cM) and EBmac0755 (chromosome 7H, 125.21 cM) revealed the maximum phenotypic variance (r2 = 31.24%, 27.10% and 29.80%, respectively) associated with RWC (Table 2).
3.10 Proline accumulation (PA)
Six marker–trait associations exhibited significant associations with proline accumulation were identified on chromosomes 1H, 2H, 3H, and 7H. Four markers (GBM1462, GBM1040, Bmag0135, and GBMS183) have marker main effects, while the remaining three (Bmag0872 and Bmag0853) have marker × trait interaction effects. Three markers Bmag0872 (chromosome 1H, 49.78 cM) and GBMS183 (chromosome 7H, 154.36 cM) exhibited the maximum association between phenotypic variance and molecular markers, as indicated by the r2 values (29.90% and 33.64%, respectively) (Table 2).
3.11 Osmotic potential (OP)
Three significant marker–trait associations with osmotic potential were identified on chromosomes 1H, 2H and 6H, all of which exhibited marker main effects. The maximum phenotypic variance of OP (r2 = 29.09%) was observed with marker GBM1012, which was located to position 149.81 cM of chromosome 2H (Table 2).
4 Discussion
In conventional QTL analysis, phenotype–marker associations can be analyzed using one, two, or multiple molecular markers. Meanwhile, in association analysis, the software TASSEL utilizes a fixed effects linear model to test for the association between marker alleles and quantitative traits. Each of the traits–marker associations is performed individually. This approach is a good choice when the purpose is to identify a QTL associated with a single marker [54]. In the current study, a structured barley population consists of 107 accessions that have wide differences in morphological characters and agronomic traits were evaluated for drought-stress-associated quantitative traits, i.e., wilting score (WS), shoot dry weight (SDW), root dry weight (RDW), relative water content (RWC), proline accumulation (PA), and osmotic potential (OP). These allowed us to apply an association mapping approach for studying the genetic basis of phenotypic variation for traits evaluated under drought stress conditions. The measured phenotypic traits responded differently to water deficit at the vegetative stage. Variable levels of coefficient correlations were observed among studied phenotypic traits either under well-watered or drought-stressed conditions. The highest phenotypic correlations among phenotypic traits were observed between proline accumulation and both of RWC and RDW under drought-stressed condition, which may due to reduced tissue water content and root biomass.
Linkage disequilibrium in plants has been shown to extend from hundreds of base pairs to hundreds of kilobase pairs, depending on the species and type of analyzed population [55–58]. The extent of LD will determine whether a sufficient number of markers can be implemented to scan the entire genome or whether candidate genes association analyses are needed. LD is influenced by several biological factors such as recombination rate, selection, mutation, and population admixture [25]. A relatively high LD (P < 0.01) between more than 61% of SSR markers was observed. This observation is in accordance with the notion that since self-pollinated species have a low effective recombination rate, they typically have more LD than open-pollinated species [59]. The high extent of LD observed in markers of different chromosomes may be due to epistatic effects.
The main challenge in association analysis is to separate associations between markers and traits resulting from physical linkage of genes from those that are generated as a result of population structure and kinship association. Therefore, to overcome this problem, the QK mixed-model was implemented for association analysis to control for population structure and kinship [20]. The QK method was essentially developed to abolish false associations caused by population structure and kinship [28,53,60]. Because interactions between genotype and environment (drought treatment) were observed for measured phenotypic traits, association analysis between markers and phenotypic traits was performed with a mixed linear model (MLM).
The software TASSEL was implemented to identify 36 marker–trait associations (QTLs) for six studied traits. The number of identified QTLs is within the range (11–159) of QTLs identified by the conventional QTL analyses in barley [61]. Besides, the data presented here show that several chromosomal regions significantly influence more than one phenotypic trait, suggesting a possible presence of pleiotropic or indirect effects. This is more apparent on chromosomes 1H (marker Bmag0872 associated with RDW and PA), 2H (GBM1462 associated with RDW, RWC and PA) and 7H (markers EBmac0755 associated with WS and RWC and GBMS183 associated with SDW and PA). A number of molecular markers significantly associated with important drought-related traits including proline accumulation that can be considered for the application of marker-assisted selection (MAS) were identified.
The current study has further demonstrated that wild barley is a useful gene source for improving quantitative drought-tolerance-related traits through enriching the gene pool of cultivated barley. The panel of barley accessions investigated in this study represent a wide range of variability for drought-tolerance-associated traits. The results are promising in applying association mapping to identify significant marker–trait associations through LD. A similar association analysis study carried out by Comadran et al. [19] on a barley population, which represents a historical survey of barley diversity in the Mediterranean environments, revealed significant marker–trait associations, with a large proportion of genetic variation underlying the different mechanisms for adaptation to drought-prone environments. The advantages of association analysis include flexibility in terms of the type of population to which it is applied [57]. Many of the markers associated with drought-tolerance-related traits are located in regions where conventional QTLs had previously been identified [62–67]. Therefore, association mapping is a feasible alternative approach to identify QTLs associated with important drought-tolerance-related traits, especially for quantitative traits, which is influenced by environmental effects. Previous association mapping studies on the model plants Oryza and Lycopersicon revealed that the majority of the genetic diversity in these taxa was found in the genetic pool of the wild species [68]. Similar observations have been reported for Hordeum [69]. Therefore, it is most likely that at least some of the marker–trait associations (QTLs) identified in the present study using a panel of wild barley accessions may be a good source to enrich the barley germplasm pool and create initial material and varieties with certain distinctive features.
In conclusion, association mapping approach was successfully implemented to identify 48 molecular markers that are significantly associated with six drought-tolerance-related traits, yielding 53 marker–trait associations. Besides, a high extent of significant LD (> 61%) was observed between markers on different chromosomes, suggesting epistatic interaction. Furthermore, our results revealed that several molecular markers were significantly associated with more than one phenotypic trait, suggesting the possible presence of pleiotropic or indirect effects. The data provide a tool kit for the potential application of marker-assisted selection for drought tolerance in barley.
Disclosure of interest
The author declares that he has no competing interest.
Acknowledgments
The author gratefully acknowledges the National Small Grains Germplasm Research Facility, USDA, ARS, Idaho, USA for providing the accessions used in this work. The author gratefully thanks Ahmed Mousa Salem, Ahmed Mahmoud Ali and Ibrahim Mohamed Ali for their excellent technical assistance.