

1 Introduction
In a context of growing pressures affecting the marine environments, estimating connectivity among populations is essential, since the scale of larval dispersal is crucial for understanding species reorganization and populations evolution after large-scale disturbances [1,2]. Size and interconnectivity of populations are important parameters to estimate for conservation strategies, since small and isolated populations are vulnerable to inbreeding depression, limited spread of beneficial alleles [3]. and loss of genetic diversity, which might reduce their evolutionary potential and increase their risk of extinction [4]. Population genetics describes connectivity by comparing allele frequencies among spatially discrete subpopulations. High levels of genetic similarity between populations can indicate gene flow over time, usually through larval dispersal, whereas significant differentiation between populations can correspond to significant and persistent barriers to larval exchange. Nevertheless, the observed level of genetic differentiation depends on the interaction between gene flow, genetic drift and mutation (depending on the time scale or molecular markers).
For most benthic marine species with complex life cycles, the exchange of individuals among populations occurs primarily through the pelagic larval stage [5]. These exchanges depend on biotic and abiotic factors, including spawning outputs, larval dispersal, habitat availability, hydrodynamics and trophic interactions [6,7]. Evidence from direct and indirect approaches using geochemical and genetic techniques suggests that the genetic structure of marine populations, while often low, ranges from fully open to fully closed [5].
Understanding the scale of population connectivity is fundamental for the development of suitable conservation strategies and for the design of marine reserves [8–10]. Decisions predicated on the assumption that larvae disperse at long distance may lead to erroneous actions if this assumption is wrong [11]. Studies regarding connectivity conducted in the Mediterranean Sea showed the existence of different patterns of genetic differentiation, ranging from complete panmixia to an east–west or north–south genetic partitioning. These findings warn against any generalization based on the presently available information and strongly indicate the need to obtain genetic connectivity data from a wider array of species, including keystone species such as habitat formers as well as rare or threatened species [12].
Among the benthic sessile invertebrates of the Mediterranean, gorgonian octocorals play an important role, contributing to the enhancement of the overall structural complexity, biomass, and species diversity of habitats by their three-dimensional growth pattern [13–15]. Furthermore, organisms living in habitats characterized by the presence of gorgonian corals may experience a sort of buffer zone where environmental alterations occur more slowly and within narrower ranges with respect to the surrounding ‘unforested’ environment [16].
The slow population dynamics of gorgonians makes them susceptible to a wide range of direct or indirect anthropogenic stressors: mechanical damage (mainly caused by fishing and unregulated recreational diving), pollution and mucilaginous algal aggregates [17–19], biological invasions [20], bacterial pathogens and mass mortality events linked to thermal anomalies [21,22]. For example, during the 2003 mortality event, the yellow gorgonian Eunicella cavolini was affected from the coasts of Provence in southeastern France to the gulf of Naples in southern Italy, with a percentage of affected colonies reaching 50.8% [22]. This species, along with other anthozoans, is also impacted by other human pressures, such as, for example, the side-effects of fisheries [23,24]. Considering these threats and the need to extend the knowledge on population dynamics and connectivity for conservation and ecosystem-based management purposes, several studies have been performed on the genetic structure of Mediterranean species from the coralligenous assemblages, most of them on octocorals. These previous genetic studies revealed strong population genetic structure potentially because of short-distance larval dispersal for some coralligenous species such as the red coral Corallium rubrum [25–29], the red gorgonian Paramuricea clavata [30,31], the yellow gorgonian E. cavolini [32], the only symbiotic Mediterranean gorgonian Eunicella singularis [33,34], or the sponge Crambe crambe [35]. Regarding E. cavolini, the first molecular study gave little information on the genetic structure of this species because of a lack of informative markers [36]. The use of microsatellite markers in E. cavolini allowed the identification of different genetic clusters in the Mediterranean corresponding to the main geographical regions, and with different levels of genetic diversity: the allelic richness of eastern Mediterranean populations (i.e. from Turkey) was two-fold lower than in Algeria [32]. The genetic structure in the region of Marseille (France) indicated a differentiation between most populations [32]. Although no differentiation was observed between depths (between depths of 20 m and 40 m) at a given site [32], significant differences in thermo-tolerance were demonstrated at the bathymetrical scale [37].
In the present work, we focused on the yellow gorgonian Eunicella cavolini (Koch, 1887), an octocoral species widely distributed in the Mediterranean, which can be observed for depths from less than 10 m to more than 100 m [38]. The genetic structure of this species has been studied mainly at the basin-wide Mediterranean spatial scale [32]. Definition of the boundaries of Marine Protected Areas (MPAs) should consider the connectivity among habitats for management and conservation of marine species [9], and this requires a more precise study of connectivity at both the regional and the local spatial scales. In this sense, NW Mediterranean offers an interesting context for genetic structure studies at different spatial scales where the yellow gorgonian forms populations from depths of 15 m, reaching here the maximum densities of the Mediterranean sites studied by Sini et al. [38]. The absence or low genetic differentiation between shallow and deep E. cavolini observed at Marseille (SE France) is of great importance considering the impact of climate change and the possibility of exchanges between depths with different thermal conditions [37], and it should be tested in other areas as well. In the area of Marseille, a new Marine Protected Area has recently been designed. It is then important to study its potential connectivity with other populations and MPAs along the coast. Considering that there are almost no other populations on its western side, located 300 km apart in the same Ligurian Sea, Portofino (NW Italy) offers a perfect location for the genetic study of Eunicella cavolini populations at the regional, local, and depth scales. Given the lack of information on the effects of the spatial scale on the genetic structure of this species, our aims were:
- • to examine the genetic differentiation of E. cavolini at the regional scale in the Ligurian Sea, by focusing on the differences between two adjacent regions 300 kilometres apart, i.e. Marseille in SE France and Portofino in NW Italy, where a number of MPAs have already been established;
- • to analyse the genetic differentiation at the local scale 10 kilometres apart, i.e. within the areas of Marseille and Portofino, in order to acquire insights into the dispersal abilities of this species at small scale;
- • to investigate the vertical connectivity between populations by including samples from different depths. We tested whether the absence of a vertical genetic differentiation previously observed in Marseille can be extended in other areas of the Ligurian Sea.
2 Materials and methods
2.1 Samples collection
Colonies of Eunicella cavolini were sampled by scuba divers removing a 3-cm branch (usually terminal) using sea-snips (n = 628 colonies in total; see Table 1). In order to have colonies separated by few and hundreds of kilometres and at different depths, samples were collected few kilometres apart at five sites in the MPA of Portofino (Genoa, NW Italy) and at ten sites in the area around Marseille (SE France) (Fig. 1). Samples around Marseille were taken at two depths (20 and 40 m) in the Riou, Veyron, and Méjean sites, and at one depth in the other seven sites. Nine colonies were sampled on artificial reefs (REE), which were installed in 2007–2008. Samples at Portofino were collected at two depths (20 m and 40 m), except for Punta Cervara (PAR), where E. cavolini only occurs at depths of 13–18 m. Geographical distances between sites in the Marseille area ranged from 2 km to 100 km, whereas in the Portofino area they ranged from 1 km to 6 km (Fig. 1). Distances between Marseille and Portofino ranged from 381 km to 274 km. The sample size was even in all sites; around 30 colonies per site were taken. Once collected, samples were preserved in 95% ethanol at–20 °C until DNA extraction. Permits for sampling in the MPA of Portofino were obtained from the local competent authority of the Area Marina Protetta Portofino. All sampling activities were performed in accordance with the Italian and French laws.
Information on the samples collection of Eunicella cavolini in Marseille (France) and Portofino (Italy).
| Area | Site | Label | Depth (m) | Latitude | Longitude | Sample size (n) | Date |
| Portofino | Punta Cervara-Paraggi | PAR | 14 | 44° 18.653’ N | 9° 12.785’ E | 28 | 8/05/2015 |
| Portofino | Punta Faro shallow | PFS | 20–23 | 44° 17.910’ N | 9° 13.156’ E | 22 | 12/05/2015 |
| Portofino | Punta Faro deep | PFD | 36–40 | 44° 17.910’ N | 9° 13.156’ E | 15 | 12/05/2015 |
| Portofino | Casa del Sindaco shallow | CSS | 19–21 | 44° 18.182’ N | 9° 12.147’ E | 33 | 6/05/2015 |
| Portofino | Casa del Sindaco deep | CSD | 38–40 | 44° 18.182’ N | 9° 12.147’ E | 26 | 6/05/2015 |
| Portofino | Secca Gonzatti shallow | SGS | 18–20 | 44° 18.547’ N | 9° 10.686’ E | 29 | 28/04/2015 |
| Portofino | Secca Gonzatti deep | SGD | 39–42 | 44° 18.547’ N | 9° 10.686’ E | 31 | 28/04/2015 |
| Portofino | Punta Torretta shallow | PTS | 15 | 44° 18.713’ N | 9° 09.979’ E | 30 | 22/04/2015 |
| Portofino | Punta Torretta deep | PTD | 35 | 44° 18.713’ N | 9° 09.979’ E | 31 | 22/04/2015 |
| Marseille | Sec de Sarraniers | SAR | 40 | 42° 59.272’ N | 6° 17.030’ E | 33 | 7/11/2011 |
| Marseille | Cave 3PP | 3PP | 15 | 43° 09.795’ N | 5° 36.000’ E | 30 | 17/02/2012 |
| Marseille | Riou shallow | RIS | 20 | 43° 10.360’ N | 5° 23.420’ E | 32 | 15/03/2012 |
| Marseille | Riou deep | RID | 40 | 43° 10.360’ N | 5° 23.420’ E | 31 | 15/03/2012 |
| Marseille | Pouard on Île Plane | POU | 15–25 | 43° 11.340’ N | 5° 23.130’ E | 30 | 14/02/2012 |
| Marseille | Veyron shallow | VES | 20 | 43° 12.414’ N | 5° 15.176’ E | 30 | 24/11/2011 |
| Marseille | Veyron deep | VED | 40 | 43° 12.414’ N | 5° 15.176’ E | 30 | 24/11/2011 |
| Marseille | Somlit | SOM | 58 | 43° 14.050’ N | 5° 17.050’ E | 30 | 28/11/2011 |
| Marseille | Saména | SAM | 10 | 43° 13.780’ N | 5° 20.880’ E | 34 | 16/01/2012 |
| Marseille | Cap Cavau | CAV | 25 | 43° 15.630’ N | 5° 17.390’ E | 29 | 1/02/2012 |
| Marseille | Méjean shallow | MJS | 18–20 | 43° 19.700’ N | 5° 13.480’ E | 33 | 16/03/2012 |
| Marseille | Méjean deep | MEJ | 30–40 | 43° 19.700’ N | 5° 13.480’ E | 31 | 24/02/2012 |
| Marseille | Artificial reef | REE | 15–20 | 43° 15.702’ N | 5° 20.398’ E | 10 | 7/05/2015 |

Geographical location of the 15 sites in the Ligurian Sea where populations of Eunicella cavolini were sampled and analysed in the present study. A: ten sampling sites in the area of Marseille (SE France); B: five sampling sites in the area of Portofino (NW Italy). Refer to Table 1 for the labels of each site.
2.2 DNA extraction and microsatellite genotyping
Total genomic DNA was extracted using QIAamp® DNA Mini Kit (Qiagen®) according to the manufacturer's instructions. Individuals were genotyped at six microsatellite loci: C21, C30, C40, S14, EVER007, EVER009 [37,39,40]. The loci were amplified through PCR Multiplex using the Type-it® Microsatellite PCR Kit (Qiagen®). PCR amplifications were done in a final reaction volume of 10 μL containing 1 μL of DNA, 5 μL of MasterMix, 3 μL of H2O Milli-Q® and 1 μL of primer mix (with each primer at 2 μM).
Electrophoresis was carried out at the IMBE laboratory on an ABI 3130 genetic analyser and at the Genotyping and Sequencing facility at Montpellier (Plateforme Génotypage–Séquençage, Université de Montpellier) on an ABI 3500xL Genetic Analyser (Applied Biosystems), using GeneScan LIZ 600 (Applied Biosystems) as the internal size standard. Four reference individuals were included in each migration for cross-validation. Electropherograms were analysed with GeneMapper® version 4.0 (Applied Biosystems).
2.3 Genetic diversity and structure
We used MICRO-CHECKER v.2.2.3 [41] to check for scoring errors owing to stutters, large allele dropout and to estimate null allele frequencies. We used GENCLONE 2.0 [42] to test for the occurrence of repeated multilocus genotypes (MLGs). Repeated MLGs were omitted from the following analyses.
Linkage disequilibrium was tested among all pairs of loci at each site with a permutation test (n = 1000) using GENETIX v.4.05 [43]. The f estimator of FIS [44] was computed for each population using GENETIX. Departures from panmixia were tested with an exact implemented in GENEPOP 4.5.1 with default parameters [45].
We analysed the genetic diversity for each population by computing observed (Ho) and Nei's (1973) [46] unbiased expected heterozygosity (He) with GENETIX. Allelic richness [Ar(g)] and private allelic richness [Ap(g)] were estimated with a rarefaction procedure using the HP-RARE software [47] with the minimum number of genes set to 18. FreeNA was used to estimate FST for each pair of populations using the ENA correction described in Chapuis and Estoup [48], to provide more precise estimates of FST considering the presence of null alleles. As a complementary measure of genetic differentiation, we computed the estimator of actual differentiation Dest [49] with the online Software for the Measurement of Genetic Diversity ([50]; SMOGD 1.2.5). Exact tests of genic differentiation were performed with GENEPOP with default parameters.
We estimated the contemporary connectivity among populations with BAYESASS 3.0 [51]. This software was used to assess the proportions of individuals assigned to their hypothesized population and to the other populations. As the S14 locus showed strong departures from panmixia, we performed this analysis without this locus. The current implementation of BAYESASS is limited to 20 populations. We therefore performed two analyses: one for Portofino, with 9 populations, and another for Marseille with 13 populations. The added benefit of this method over a standard genetic distance method is the ability to estimate the direction of the gene flow. To ensure consistent and accurate estimates, we varied seed numbers and explored the number of runs needed (i.e. burn-in) to be discarded before data collection. The burn-in length was set after log-likelihood values peaked. We also varied seed numbers and mixing parameters to get acceptance rates between 40% and 60% [51]. Delta values of m = 0.05, P = 0.15, and F = 0.3 yielded an average number of changes in the accepted range. For each analysis, we performed five independent (i.e. with different seeds) replicate runs (their average value was then used) of the algorithm for 500 000 iterations, and a burn-in of 200 000 generations was determined after an appropriate number of runs for convergence and stabilization of posterior probabilities with a sampling frequency of 2000. As a complementary analysis to BAYESASS, we used the GENECLASS2 software for the assignment of individuals [52]. We used the criterion of Rannala and Mountain [53], and the computation of the probability according to Paetkau et al. [54] with 1000 simulated individuals, and a type-I error of 0.01. The colonies sampled on artificial reefs in Marseille (REE) were also analysed separately with GENECLASS2: we used the other populations from Marseille as reference samples to study the potential origin of colonies on the reefs. Considering the strong departure from panmixia observed for the S14 locus, we did not use it with GENECLASS2.
The Bayesian method implemented in STRUCTURE v.2.2 [55–57] was used to evaluate the number of genetic clusters (K) in our data set from individual genotypes without prior information on their geographical locations. Again, as the S14 locus showed strong departures from panmixia, we repeated the analysis without this locus. STRUCTURE was launched using the admixture model, with correlated allele frequencies among clusters and the recessive allele option to cope with null alleles [56]. Ten independent runs were performed for each K using 500 000 iterations and a burn-in period of 200 000. Following the recommendations of Jakobsson et al. [58] and Rosenberg et al. [59] for cases of large datasets, we first studied the results of STRUCTURE at several small values of K during a first round of analysis, and then we looked for additional substructure on partitioned datasets during a second round. For the first round, the whole dataset (622 individuals) was used. K was set to vary between 1 and 6. As the analysis of the whole dataset indicated the presence of two clusters corresponding to the two sampling regions, we performed a second analysis by separating the Marseille sites from the Portofino sites. The choice of the best K values was based on the result of STRUCTURE HARVESTER [60] with the Evanno's criterion [61], and we retained the values that seemed the most informative, i.e. those with the lowest levels of individual admixture: we therefore discussed K = 2 and 3 for the global analysis and K = 2 for the analysis within regions. The merging of the different runs and the visualization of the results were done with the CLUMPAK software [62].
We tested for isolation by distance (IBD) by examining the correlation between pairwise FST/(1–FST) values and the logarithm of the geographical distances [Ln(d)] between populations [63] with IBD Web Software (IBDWS 3.16; [64]). Geographical distances were measured using Google Earth 6.2.2.6613 (available at https://www.google.fr/intl/fr/earth/), considering the minimum distances by sea between sites. IBD was assessed independently within Marseille and Portofino, as well as across the entire Liguro-Provençal area in the Ligurian Sea. The significance of the correlation between the two distance matrices was tested using a Mantel test (n = 1000) in IBD Web Software.
Whenever necessary, corrections for multiple tests were performed with the False Discovery Rate (FDR) method of Benjamini and Hochberg [65].
3 Results
3.1 Genetic variability
All loci were polymorphic in all populations except for loci EVER007 in PFD and C30 in PTD. The total number of alleles ranged between 4 for EVER007 and 16 for S14, with a mean of 10.5 alleles per locus. Observed heterozygosity varied from 0 for EVER007 in PFD and C30 in PTD to 0.86 for EVER009 in PAR and PFD. Expected heterozygosity ranged from 0 for EVER007 in PFD and C30 in PTD to 0.86 for S14 in VED. MICRO-CHECKER suggested the presence of null alleles for S14, as indicated by the general excess of homozygotes for most allele size classes. Global significant linkage disequilibrium (LD) between loci C21 and S14 was detected considering all samples only (P < 0.05). When considering each population separately, significant LD among pairs of loci was observed in nine populations, but these were not the same pairs of loci in the different populations. After FDR correction, significant LD was only detected in VES between loci EVER009–C30. Seven cases of duplicated MLGs were observed (Table S1). In two cases, the repeated MLGs were observed in different populations (PTD vs SGD, MJS vs CAV). Two repeated MLGs were observed on artificial reefs and four MLGs were observed in the CSS population.
At the population level, expected heterozygosity ranged from 0.58 for VED to 0.46 for SAM. Ar (18) values ranged from 3.41 in PAR to 4.25 in MEJ. Ap (18) values were scattered from 0 in RIS and REE to 0.38 in PFS (Table 2). No difference of expected heterozygosity was found between the areas of Portofino (He = 0.52 ± 0.02) and Marseille (He = 0.51± 0.02).
Measures of genetic diversity for 22 populations of Eunicella cavolini based on six microsatellites loci.
| H o | H e | f | Ar(18) | Ap(18) | |
| PAR | 0.51 (0.26) | 0.53 (0.24) | 0.04 | 3.41 (1.59) | 0.07 (0.18) |
| PFS | 0.48 (0.22) | 0.55 (0.27) | 0.16 | 4.16 (1.90) | 0.38 (0.55) |
| PFD | 0.52 (0.31) | 0.54 (0.31) | 0.06 | 3.66 (1.96) | 0.01 (0.02) |
| CSS | 0.47 (0.11) | 0.55 (0.24) | 0.15 | 4.10 (2.14) | 0.03 (0.08) |
| CSD | 0.45 (0.24) | 0.52 (0.29) | 0.14 | 4.06 (2.19) | 0.06 (0.15) |
| SGS | 0.42 (0.24) | 0.49 (0.30) | 0.17 | 4.06 (2.19) | 0.03 (0.05) |
| SGD | 0.44 (0.31) | 0.50 (0.35) | 0.13 | 3.95 (2.18) | 0.07 (0.13) |
| PTS | 0.42 (0.29) | 0.49 (0.33) | 0.16 | 3.78 (2.11) | 0.01 (0.02) |
| PTD | 0.46 (0.29) | 0.47 (0.31) | 0.05 | 3.63 (2.01) | 0.22 (0.25) |
| SAR | 0.42 (0.20) | 0.47 (0.25) | 0.13 | 3.96 (2.08) | 0.03 (0.08) |
| 3PP | 0.37 (0.27) | 0.50 (0.31) | 0.27 | 3.63 (1.56) | 0.13 (0.14) |
| RIS | 0.50 (0.28) | 0.53 (0.32) | 0.09 | 3.96 (2.08) | 0 (0) |
| RID | 0.55 (0.32) | 0.52 (0.31) | −0.03 | 3.86 (1.80) | 0.06 (0.12) |
| POU | 0.42 (0.30) | 0.51 (0.35) | 0.22 | 3.82 (2.01) | 0.05 (0.11) |
| VES | 0.48 (0.30) | 0.50 (0.32) | 0.05 | 3.78 (2.12) | 0.03 (0.05) |
| VED | 0.52 (0.21) | 0.58 (0.20) | 0.13 | 4.16 (2.16) | 0.11 (0.13) |
| SOM | 0.46 (0.18) | 0.49 (0.24) | 0.07 | 3.65 (1.64) | 0.05 (0.12) |
| SAM | 0.43 (0.26) | 0.46 (0.27) | 0.08 | 3.62 (1.83) | 0.07 (0.18) |
| CAV | 0.48 (0.18) | 0.51 (0.24) | 0.08 | 4.22 (1.68) | 0.17 (0.18) |
| MJS | 0.51 (0.33) | 0.49 (0.33) | −0.02 | 3.99 (2.18) | 0.14 (0.23) |
| MEJ | 0.48 (0.31) | 0.50 (0.34) | 0.06 | 4.25 (2.36) | 0.13 (0.31) |
| REE | 0.50 (0.29) | 0.51 (0.25) | 0.06 | 3.60 (1.55) | 0 (0) |
| Mean value | 0.47 (0.04) | 0.51 (0.03) | 0.10 | 3.88 (0.24) | 0.08 (0.09) |
3.2 Deviations from Hardy–Weinberg equilibrium
Significant multilocus heterozygote deficiencies were observed in ten populations: PFS, CSS, CSD, SGS, SGD, PTS, SAR, 3PP, POU, and VED (Table S2). When not considering locus S14, significant heterozygote deficiencies was observed only in VED and 3PP (Table S2). For EVER007, EVER009, and C21, the null hypothesis of panmixia was rejected for two populations. For C30 and C40, the null hypothesis of panmixia was not rejected for any population. Multilocus FIS values (f) ranged between–0.03 for RID and 0.27 for 3PP, with a mean value equal to 0.10. Considering each locus separately, f values ranged from–0.34 for C40 in SOM to 0.78 for S14 in 3PP (Table S2).
3.3 Population genetic structure
The mean global FST was 0.07 (± 0.04), the mean FreeNA corrected FST was 0.07 (± 0.03), and the mean Dest was 0.17 (± 0.08). Pairwise multilocus FST between all populations ranged from 0.002 between MJS and MEJ to 0.166 between PAR and SAM (Table S3). Pairwise FreeNA corrected FST ranged from 0.01 (PFS vs PFD, CSS vs CSD, CSD vs SGD, RIS vs RID, VES vs SOM, MEJ vs SAM) to 0.17 (PAR vs SAM). Pairwise Dest ranged from 0 (VED vs VES) to 0.38 (CSD vs POU) (Tab. S4). After FDR correction, all pairwise exact tests of genic differentiation were significant apart from CSS vs CSD and RIS vs RID (two comparisons between depths; Table S3). Apart from depth, significant comparisons were found with a minimum distance of 0.99 km in Portofino and 2.95 km in Marseille. When locus S14 was omitted, two additional differentiation tests were non-significant: VES vs SOM and PFS vs PFD.
The correlation between FST/(1–FST) and Ln(dist) was significant using geographical distances (rLn(dist) = 0.596; P < 0.001), confirming the occurrence of an IBD model of gene flow (Fig. 2). Within areas, correlations were also significant for the Portofino (rLn(dist) = 0.625; p < 0.001) and Marseille areas (rLn(dist) = 0.436; p < 0.001) (Fig. 2B and 2C). The IBD slope was similar in the two areas (0.019 in Portofino and 0.015 in Marseille). When using FST corrected by FreeNA, IBD was significant at the global level (p < 0.001), within Marseille (p = 0.04) and within Portofino (p = 0.002). Again, the IBD slope was similar in the two areas (0.032 at Portofino and 0.035 at Marseille; data not shown).
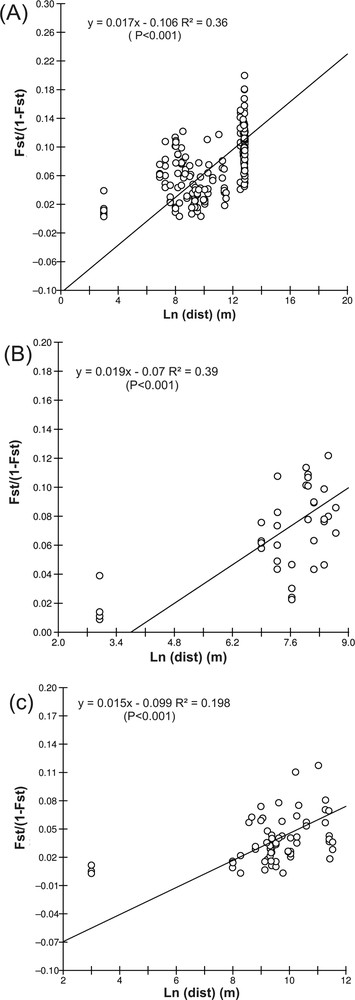
Isolation by distance (IBD) pattern for all populations (A), taking into account the minimum geographical distances between populations. Separate analyses of IBD for the Portofino (B) and Marseille populations (C). The graphs show the linear regression of the genetic distance measured as FST/(1−FST) over logarithms of the geographical distance (m).
The results of the genetic clustering using STRUCTURE indicated that the highest Delta (K) value for the whole dataset was 2 (data not shown). With K = 2, clustering showed a clear distinction between Marseille and Portofino, and K = 3 did not provide additional information (Fig. 3). The addition of locus S14 to the analysis gave a very similar result (data not shown). Each of these two regional clusters was then subjected to a second round of STRUCTURE. The highest Delta (K) value was 3 at Marseille and 4 at Portofino. Nevertheless, inside each region, the results did not indicate the presence of any additional cluster: in both cases, all individuals were equally shared among clusters for all K (data not shown).
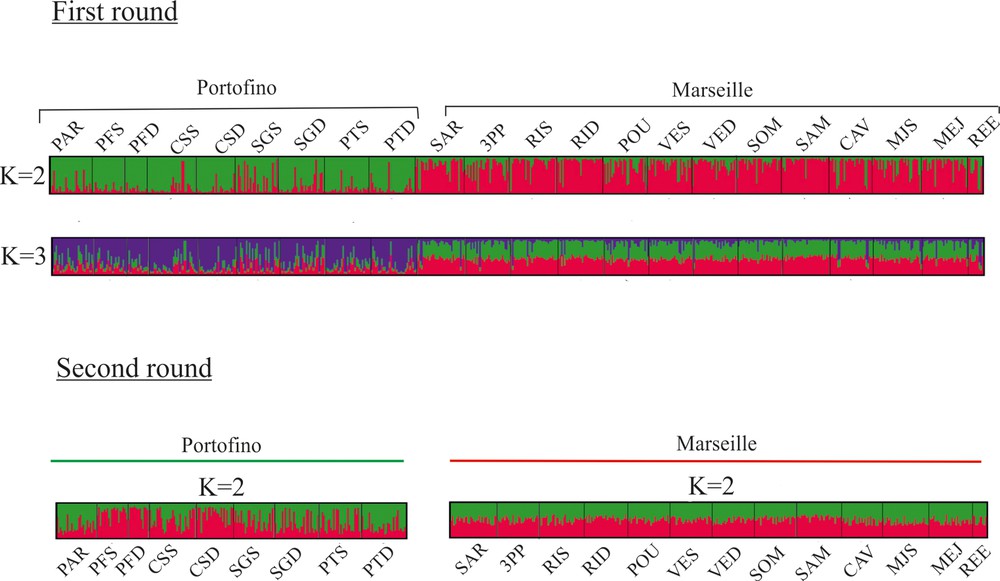
Population structure as inferred by the STRUCTURE analysis. Each individual is represented by a vertical line partitioned into K-coloured segments that represent the individual's membership fraction in K clusters. Each population is delineated by black vertical lines and named as in Table 1.
Migration analysis using the BAYESASS analysis indicated similar levels of self-recruitment in the two regions: the proportion of individuals derived from the source population varied between 0.69 (PFD) and 0.80 (PAR) at Portofino, and between 0.68 (CAV) and 0.80 (POU) at Marseille (Table S5). The estimates of migration rates between populations were generally low and with quite large standard errors. The assignment analysis of GENECLASS2 indicated that the probability of assignment (averaged over all individuals of the population) was higher for populations from their region of origin than for another region: the intra-region assignment probability was 0.31 (± 0.10) for Portofino and 0.32 (± 0.10) for Marseille (Table S6). The within-region highest assignment probabilities corresponded to the population where individuals were sampled: these retention probabilities were very similar among populations and regions: 0.46 (± 0.02) at Portofino and 0.45 (± 0.03) at Marseille. The assignment probability of Portofino individuals to Marseille populations was 0.11 (± 0.07) and 0.16 (± 0.07) in the other direction. The assignment probabilities of E. cavolini colonies sampled on artificial reefs near Marseille did not allow the identification of a single main origin, and for a given colony the probabilities were often similar among different candidate populations (Table S7). Only the colony 14B displayed a much higher probability of origin for one population (Saména) than for the other populations. The colonies 15 J, 15 M, 15O and 15P displayed low assignment probabilities (< 0.10) for all the populations tested here.
4 Discussion
4.1 Genetic diversity
The analysis of six microsatellite loci evidenced low genetic diversity for Eunicella cavolini (He by population over loci = 0.51) when compared with other Mediterranean octocorals: Corallium rubrum studied in the same area (He by population over loci = 0.77; [29]) and Paramuricea clavata (He by populations over loci = 0.74; [31]). There could be several possible and non-mutually exclusive reasons. (i) the microsatellites used here were less variable because of their sequence or origin: S14 and EVER007, and 009 correspond to cross-amplification from E. singularis and E. verrucosa respectively; (ii) the species is less variable than other octocoral species, likely due to the impact of past bottlenecks; (iii) a geographical effect: the comparison of populations from Marseille with those from other Mediterranean areas indicated that in the NW Mediterranean, the genetic diversity of E. cavolini is lower than in the SW Mediterranean populations, but higher than in the Eastern Mediterranean [32]. A lower level of polymorphism of microsatellites resulting from cross-species amplification can be observed in various species, but with different impact according to the taxonomic group considered [66]. Considering that P. clavata and E. cavolini share a large part of their distribution range, one may wonder if they may have responded differently to past environmental changes. The different impacts of the 2003 heat wave according to species could suggest different thermal limits for P. clavata and E. cavolini [22]. Nevertheless, even in the area of the highest genetic diversity for E. cavolini, the expected heterozygosity was somewhat lower than in the two others Mediterranean octocorals (He = 0.68 in Algeria; [32]). A comparative study of the demographic history of these species with similar markers (such as Single Nucleotide Polymorphisms, SNPs) could help in understanding the origin of these differences.
4.2 Genetic structure at large spatial scale
A pattern of isolation by distance was observed at the regional spatial scale with significant genetic structuring found between the two regions. The values of FST for the Liguro-Provençal geographical area ranged between 0.002 and 0.166, with a mean value of 0.09. If we make comparisons with other octocorals, FST for the Liguro-Provençal area was between 0.07 and 0.14, with a mean value of 0.09 for P. clavata [31], and between 0.09 and 0.2, with a mean value of 0.13 for C. rubrum [29]. Such comparisons between species can be impacted by different levels of heterozygosity among markers, which influences the highest FST values [67]. As previously mentioned, He is lower in E. cavolini, based on our markers, than in C. rubrum and P. clavata. Despite this, FST is lower for E. cavolini than for the other species. It thus shows that genetic differentiation within the Liguro-Provençal area is higher for C. rubrum than for E. cavolini and P. clavata. Such differences in the levels of genetic differentiation between species could be due to differences in dispersal abilities or in local effective sizes. Although all brooders are more likely to exhibit restricted gene flow [68], C. rubrum has a mean dispersal ability of 10 of meters or less [27], whereas for P. clavata it would be around 1 km [31]; for E. cavolini, our results suggest a mean dispersal ability of less than 1 km. Nevertheless, this may be at odd with experimental data on the duration of the larval phase in the red coral [69], and this does not preclude the possibility of exchanges at higher distances [29], even if their frequency remains unknown. The structure pattern revealed by STRUCTURE showed a distinction between Portofino and Marseille. This pattern is also supported by the higher values of FST between areas (average FST = 0.092) than within areas (average FST = 0.063 for Portofino and average FST = 0.069 for Marseille), and by the marked differences in assignment probabilities between regions compared to within regions. These results indicate a limited gene flow between the two regions for the yellow gorgonian, which could be linked to intrinsic limits to dispersal at such distances (the two regions are 273 km apart), and/or to the effect of a barrier to gene flow. The genetic analyses of yellow gorgonian populations in other intermediate positions between Marseille and Portofino could help in testing whether there is a genetic barrier between the two regions, or if the observed differences are induced by sampling along a geographical gradient of genetic differences (i.e. IBD, [70]).
Regarding the larval biology of E. cavolini, very little information is available, but it may contribute to the observed genetic structure. Eunicella cavolini is also a brooding species, which implies more reduced larval dispersal abilities. Such low larval dispersal is observed in other coralligenous species, where the studies available to date showed significant differentiation from a few kilometres or tens of cm [25,36,71,72]. In contrast to these cases, another Mediterranean benthic species, the sea urchin Paracentrotus lividus, displayed a much larger genetic structure [12]. It would therefore be interesting to study on more species the ecological or evolutionary factors leading to the selection of different dispersal strategies in these species. Indeed, multi-specific approaches can reveal common barriers to gene flow and identify cold and hot spots of genetic diversity [73].
4.3 Genetic structure at small spatial scale
A pattern of isolation by distance was observed also at the local spatial scale with significant genetic structuring found within the two regions. The populations from each area, Marseille and Portofino, correspond to a single genetic cluster according to STRUCTURE. The additional genetic clusters identified within regions were not informative. Within regions, most populations appeared genetically differentiated, except for comparisons between depths (see below). Significant genetic differentiation was found between sites few kilometres apart. The pattern of differentiation within regions did not correspond to different clusters, but to the isolation by distance of differentiated populations. The use of FST and DEST gives different and complementary information on genetic differences between populations [67]. Here, at different scales, DEST estimates were higher than FST: DEST then indicates an important allelic differentiation between populations, higher than the differentiation estimated from fixation index alone [67]. At a local scale, and on the basis of DEST, one can identify populations with particularly high differentiation: such as Pouard in Marseille, or Punta Faro Deep in Portofino. These sites did not correspond to particularly distant populations and the origin of these differences remains to be studied (see below). More generally, in the short term, the interaction between gene flow and genetic drift precludes the homogenization of genetic diversity at the metapopulation scale.
The BAYESASS software was used to estimate contemporary connectivity among sites. The inferred non-migration rates fell mostly within two classes (around 0.67 and 1). Such values correspond to the bounds of the prior distribution and could indicate a bias in the inference [74], despite the use of five independent runs. The Sarranier, 3PP cave and Punta Cervara populations displayed higher non-migration rates (above 0.9), which would agree with their relative geographical isolation, but this was also observed for a few a priori less isolated populations such as Somlit and Saména. The GENECLASS2 software was then used to obtain another estimate of contemporary migration. With this method, the low probabilities of assignment to the population of origin could be the result of a quite low within region genetic structure. As a comparison, much higher levels of self-recruitment were inferred with this method for P. clavata, including for some sites studied here around Marseille [31]. This confirms that the dispersal abilities of E. cavolini are higher than those of P. clavata. Within a given region, sporadic gene flow could take place and contribute to limiting the observed differentiation compared to other octocoral species. In this case, the use of additional genetic markers could be tested to obtain higher probabilities of assignment.
Some of the studied sites could be more isolated because of the distance (e.g., Sarranier and 3PP cave), a particular position behind a headland (e.g., Punta Cervara), or caused by oceanographic features, which still remain to be investigated (Pouard, Punta Faro Deep). Population genetic structure is a pattern shaped by the interaction between physical drives (e.g., currents, barriers) and biological processes, such as larval biology and demography (e.g., fluctuations in population density due to habitat fragmentation and recruitment; [6]). Different levels of genetic drift could induce contrasted levels of genetic structure, either because of different current population sizes or different demographic histories. Regarding the colonization of artificial reefs near Marseille, several populations could correspond to potential sources. The very low assignment probabilities for four colonies indicate that non-sampled populations may have contributed to this new population. This possibility of connection with different populations may seem at odds with the observed differentiation for most populations. Nevertheless, gene flow in populations might be limited by established colonies (e.g., through space limitation), which is not the case in new populations. Recolonization might then not be limited in an area with enough surrounding populations. Similar results were obtained on P. clavata by Arizmendi-Mejía et al. [30], who observed that a recently founded population may correspond to several source populations.
A study combining more markers (such as SNPs, [12]) and integrating the putative larval characteristics with local hydrodynamics could help to better understand the observed structure and to estimate connectivity patterns (e.g., [75]). In addition, the possibility of hybridization between E. cavolini and the other species of the genus Eunicella (i.e. E. singularis and E. verrucosa) occurring in the same area [76] could also shape the observed genetic structure and diversity, depending on the density of the different species and on the frequency of genetic incompatibilities. These processes are only beginning to be considered in this context, but would require an in-depth study.
4.4 Genetic structure between depths
Over seven comparisons between depths, only in two sites we found no genetic difference with depths. This is partly contradictory with the lack of genetic differentiation observed between depths in the Marseille area [32], where seven loci (six loci in the present paper) and a permutation test (exact test in the present paper) were used. These differences suggest that the differentiation between depths is quite low, but near significance depending on sampling effort or drift effects, and that the exact test is more powerful than the permutation test. Two others Mediterranean octocoral species, Paramuricea clavata [31] and Corallium rubrum [29,77] showed a generalized genetic differentiation with depths in the area of Marseille. Intrinsic biological differences (e.g., spawning date compared to water stratification or larval properties) interacting with hydrodynamics might explain the differences observed between these two species and E. cavolini. For the congeneric species E. singularis, a strong restriction to gene flow was observed between depths of 30 m and 40 m [33]. We did not observe this for E. cavolini, but enlarging this study over a wider bathymetrical range might be interesting.
The pattern of genetic structure along the depth gradient can be compared with the pattern of adaptation of E. cavolini. Environmental variables, such as light and temperature, vary along the depth gradient and can induce local adaptation [78]. Thermo-tolerance experiments showed that the response to thermal stress is very different between depths in E. cavolini, with a lower thermo-tolerance in deep individuals [37]. Such differential phenotypic buffering is observed in a context of low and non-significant genetic differentiation for a studied site (e.g., in the site of Riou, and see also [37]). For E. cavolini, the adaptation to the different thermal regimes could correspond to acclimatization or to a combination of genetic and non-genetic effects. In addition, the reduced number of loci analysed here does not allow us to reject the possibility of genetic adaptation determined by other genomic regions. More generally, E. cavolini can be found in a wide range of light conditions [79], which could point to the general physiological plasticity of the species.
The role of deep environments as possible refugia from disturbances for shallow marine species (i.e. the deep refugia hypothesis) has been widely recognized [80]; however, the genetic differentiation of E. cavolini with depth, although low, questions the possibility for deep populations to act as a regular source of new larvae in the event of mass mortality of shallow colonies due to thermal anomalies [21,22]. Moreover, the possible adaptation of octocorals to different depths [81], including E. cavolini [37], could influence the evolution of populations along this depth gradient.
5 Conclusion
Our results confirm the strong genetic structure observed in the Mediterranean octocorals studied so far, which contrasts with what has been observed for other anthozoan species (e.g., Alcyonium digitatum in the northeast Atlantic; [82]). The genetic structure in Eunicella cavolini is lower than in Paramuricea clavata and Corallium rubrum, the other two typical benthic species occurring in coralligenous assemblages of the Mediterranean Sea. The high differentiation observed at the large spatial scale of 100 of kilometres, i.e. between the two regions, argues for the importance of local management of such benthic species. For example, a network of connected MPAs focusing on this species, as well as on other species of the coralligenous assemblages with similar dispersal abilities, should ideally consider these spatially restricted dispersal abilities. The weaker but significant genetic structure observed in E. cavolini at the small spatial scale of kilometres, i.e. among sites within the same region, suggests that gene flow can be important in the short-term evolution of populations. The identification of sites with important genetic differentiation could be considered in conservation. Regarding the response to climate change, the observed diversity in thermo-tolerance levels is correlated with the genetic structure estimated with microsatellites.
Disclosure of interest
The authors declare that they have no competing interest.
Acknowledgments
We are grateful to Alice Oprandi, Simone Musumeci (DiSTAV, Università degli Studi di Genova), and F. Zuberer (Centre d’océanologie de Marseille) for field collection support. We thank Sandrine Ruitton for the indication of the sampling of E. cavolini on artificial reefs. We thank the molecular biology service of the IMBE. This study was funded by the Università degli Studi di Genova (A. Cánovas-Molina PhD fellowship), by the project PRIN 2010-11 Bioconstructions funded by the Italian Ministero dell’Istruzione, dell’Università e della Ricerca and by the Algerian–French collaboration program Tassili No. 12MDU853. The project leading to this publication has received funding from the European FEDER Fund under project 1166-39417.