

1 Introduction
The discovery of fluoroindate glasses (FIG) is not recent 〚1, 2〛. However, along the past 15 years, a number of improvements in their characteristics were developed. Presently, these compounds are prepared with very good optical quality; they are very stable against atmospheric moisture, present a low refractive index and low optical attenuation from the ultraviolet to the middle infrared. Nowadays, optical fibers can be prepared 〚3〛 and a number of applications have been considered. Different methods can be used to prepare planar waveguides in FIG substrates 〚4–6〛.
Numerous publications on the physical properties of FIG have been dedicated to the study of the optical absorption characteristics of FIG in the visible and in the infrared, as well as to the investigation of Raman scattering properties (see for example 〚7–11〛 and references therein). Many publications related to the chemical properties of FIG such as the method of preparation 〚12–14〛, morphology 〚14, 15〛, devitrification kinetics 〚16〛, stabilization 〚14–17〛 and thermal properties 〚6, 18, 19〛 are available. As the phonon cut-off energy of the FIG matrix is small (∼507 cm–1) 〚7〛, multiphonon emission rates between close electronic levels of rare earth (RE) ions in FIG are feeble.
The phenomenon of frequency upconversion (UPC), a process in which high-frequency photons are emitted after excitation of the sample by low energy photons, has also been studied in RE doped FIG 〚11, 20–39〛. We have studied UPC in FIG doped with Pr3+ 〚31〛, Er3+ 〚32, 33〛, Nd3+ 〚34, 35〛, Ho3+ 〚36〛, Yb3+/Pr3+ 〚37〛, and Yb3+/Tb3+ 〚38〛. The results demonstrate the large potential of FIG for photonic applications such as upconverters, lasers, optical amplifiers and thermal sensors. For example, we have demonstrated the potential of Nd3+-doped FIG for blue lasing 〚39〛, and Er3+-doped FIG for temperature sensing 〚40〛 and optical modulation 〚41〛. Other authors demonstrate the use of FIG as laser host 〚42, 43〛.
In this article we review our recent studies on UPC in fluoroindate glasses doped with Ho3+ and Nd3+ ions, as well as present new results for FIG doped with Tm3+ and codoped with Pr3+/Nd3+ and Yb3+/Tb3+.
2 Experimental details
The samples used have the compositions indicated in Table 1. The glass synthesis was made using standard pro-analysis oxides and fluorides as starting materials. The fluoride powders used to prepare the desired compositions were mixed together and heat-treated first at 700 °C for melting and then 800 °C for refining. The melt was finally poured between two preheated brass plates to allow the preparation of samples of different thicknesses. Fining, casting and annealing were carried out in a way similar to standard fluoride glasses under a dry argon atmosphere. Non-hygroscopic samples are obtained with a very good optical quality.
Molar composition (in %) of the fluoroindate glasses studied.
| Sample | InF3 | ZnF2 | SrF2 | BaF2 | NaF | GaF3 | GdF3 | HoF3 | NdF3 | TmF3 | PrF3 | TbF3 | YbF3 |
| Ho5 | 38 | 20 | 20 | 15.5 | 2.0 | 4.0 | — | 0.5 | — | — | — | — | — |
| Ho10 | 38 | 20 | 20 | 15 | 2.0 | 4.0 | — | 1.0 | — | — | — | — | — |
| Ho20 | 38 | 20 | 20 | 14 | 2.0 | 4.0 | — | 2.0 | — | — | — | — | — |
| Tm10 | 38 | 20 | 20 | 16 | 2.0 | 2.0 | 2.0 | — | — | 1.0 | — | — | — |
| Tm20 | 37 | 20 | 20 | 16 | 2.0 | 2.0 | 2.0 | — | — | 2.0 | — | — | — |
| Tm30 | 36 | 20 | 20 | 16 | 2.0 | 2.0 | 2.0 | — | — | 3.0 | — | — | — |
| Nd10 | 38 | 20 | 20 | 16 | 2.0 | 2.0 | 1.0 | — | 1.0 | — | — | — | — |
| Pr2Nd1 | 38 | 20 | 20 | 15.7 | 2.0 | 4.0 | — | — | 0.1 | — | 0.2 | — | — |
| Pr2Nd2 | 38 | 20 | 20 | 15.6 | 2.0 | 4.0 | — | — | 0.2 | — | 0.2 | — | — |
| Yb15Tb | 37.5 | 20 | 20 | 14.5 | 2.0 | 4.0 | — | — | — | — | — | 0.5 | 1.5 |
| Yb20Tb | 37 | 20 | 20 | 14.5 | 2.0 | 4.0 | — | — | — | — | — | 0.5 | 2.0 |
Optical absorption measurements in the range 0.2–1.2 μm were made using a diode-array spectrophotometer. For all measurements, the spectrophotometer bandwidth was smaller than the linewidths of the absorption bands, which are mainly due to inhomogeneous broadening of the electronic transitions. The optical absorption spectra of the FIG samples studied here are shown in Fig. 1. The absorption bands were identified by comparison with other RE trivalent ions doped glasses and crystal systems 〚44, 45〛, since the energy levels of RE trivalent ions do not change significantly for different hosts.
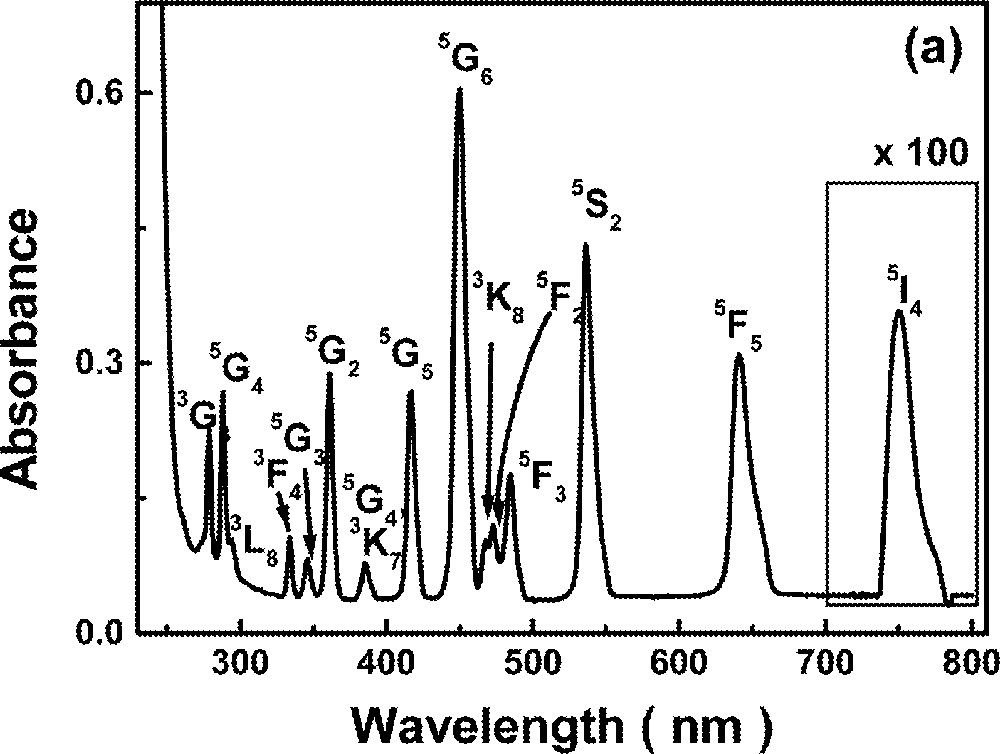
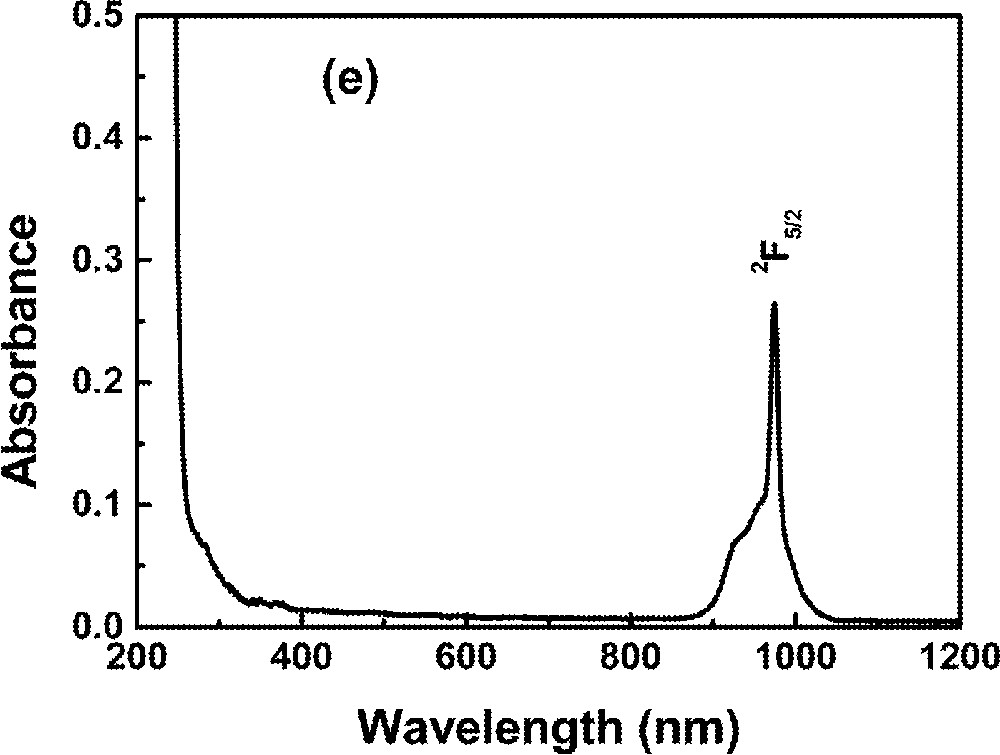
Absorbance of rare-earth-doped fluoroindate samples: (a) Ho5; (b) Tm10; (c)Pr2Nd2; (d) Nd10; (e) Yb15Tb5.
The experimental apparatus used in the UPC experiments is described in Section 4.
3 Theoretical background
The absorption bands observed from the near-ultraviolet to the near-infrared spectra of RE doped glasses are usually due to 4f–4f transitions. In this work, they are associated to induced electric dipole transitions. The dipole strength of a transition, written in esu units, can be expressed as 〚45〛:
Equation (1) allows us to obtain the P value for each transition; these values can be used in equation (2) to determine the JO parameters. The probability of spontaneous radiative emission between J and J’ levels is given by:
The radiative lifetime of an excited state is calculated by τR = (ΣJ′ AJJ′)–1 and the branching ratio corresponding to the emission from an excited level J to J’ is given by βJJ’ = AJJ′ τR.
Another important parameter concerning the luminescence intensity produced by a given RE ion is the quantum efficiency, defined as the ratio between the measured lifetime (τm) of an excited state and its radiative lifetime. The value of τm corresponds to (τR–1 + WNR)–1, where WNR represents the nonradiative decay rate 〚44, 45〛. WNR contains the probability that an excited RE ion decays nonradiatively delivering its energy to the host lattice or to another RE ion. The energy delivered to the host originates phonons and therefore the sample’s temperature increases. The nonradiative relaxation channel competes with the radiative one and therefore the emission of photons by RE ions may be quenched in solids due to phonons of the host material or to energy transfer (ET) to another ion. A good upconverter material is one that has large luminescence quantum efficiency, i.e., a low nonradiative emission probability. Assuming weak interaction between RE ions, this is accomplished when the cut-off phonon energy of the host is small. Accordingly, silicate glass with phonon cut-off energy of ∼1100 cm–1 presents a lower luminescence efficiency than FIG that present a phonon cut-off energy of ∼507 cm–1 〚7〛.
4 Results and discussion
In this section, our UPC experiments in RE-doped FIG are discussed. The dynamics of UPC fluorescence is analyzed and its temperature dependence investigated. The UPC measurements in the Ho3+, Tm3+, and Pr3+/Nd3+ doped samples were performed using dye lasers pumped by the second harmonic of a Q-switched Nd:YAG laser (532 nm, 15 ns, 5 Hz). The measurements in the Nd3+-doped sample were made using a CW Ti:Sapphire laser (866 nm). For the samples codoped with Yb3+ and Tb3+, we used a mode-locked (76 MHz) Nd:YAG laser operating at 1064 nm. The upconverted fluorescence in the dye laser experiments was collected along a direction perpendicular to the incident beam and it was dispersed by a 0.25-m spectrometer, being detected by a photomultiplier and sent to a digital oscilloscope. The average of many successive scans was recorded by a computer. In the CW experiments, the signal, also collected in the perpendicular direction to the laser beam, was sent to a lock-in amplifier before being recorded by a computer. The measurements in the Ho3+-, Tm3+-, and Pr3+/Nd3+-doped samples were performed at room temperature. The Nd3+- and Yb3+/Tb3+-doped samples were contained in an oven, whose temperature was adjusted from room temperature to 500 K.
4.1 UPC dynamics
4.1.1 Ho3+-doped FIG
The optical properties of Ho3+-doped glasses and crystals have been studied aiming to the operation of UPC lasers 〚48, 49〛. Blue–green UPC luminescence owing to 4f–4f transitions of Ho3+ has been observed upon visible and infrared excitation, with efficiencies that are highly dependent on the host matrix 〚50, 51〛, demonstrating the importance of studying UPC processes in new materials.
In this section, we discuss the UPC phenomenon in Ho3+-doped FIG excited by a nanosecond laser operating at 640 nm. Green and blue anti-Stokes emissions owing to ET mechanisms were observed and the analysis of the results allowed us to identify the pathways that contribute to the UPC emissions.
The absorption spectrum of sample Ho5 is shown in Fig. 1a. No changes were observed in the lineshape or in the peak positions corresponding to the various transitions, for different Ho3+ concentrations. The method of spectral-band intensity analysis 〚52〛 was used to estimate the JO parameters of our samples; the values are presented in Table 2.
Spontaneous emission probabilities of relevant Ho3+ excited states in fluoroindate glass.
| Energy level | Ar (s–1) | τr (ms) | Anr (s–1) |
| 5F5 | 2.15 × 10³ | 0.5 | 3 × 10⁴ |
| 5S2 | 2.54 × 10³ | 0.4 | 1 × 10³ |
| 5F3 | 5.47 × 10³ | 0.2 | 2 × 10⁵ |
| 5G4, 3K7 | 4.67 × 10³ | 0.2 | 6 × 10⁵ |
| 5G5 | 5.50 × 10³ | 0.2 | 6 × 10⁵ |
The UPC spectrum is shown in Fig. 2 for excitation at 640 nm, in resonance with the transition 5I8→5F5. Fig. 2a shows two bands centered at ∼550 nm and ∼490 nm due to transitions 5S2→5I8 and 5F3→5I8, respectively, while Fig. 2b shows bands centered at ∼395 nm and ∼425 nm corresponding to transitions (3K7, 5G4)→5I8 and 5G5→5I8, respectively. The intensities of the bands shown in Fig. 2b are two orders of magnitude weaker than those shown in Fig. 2a.
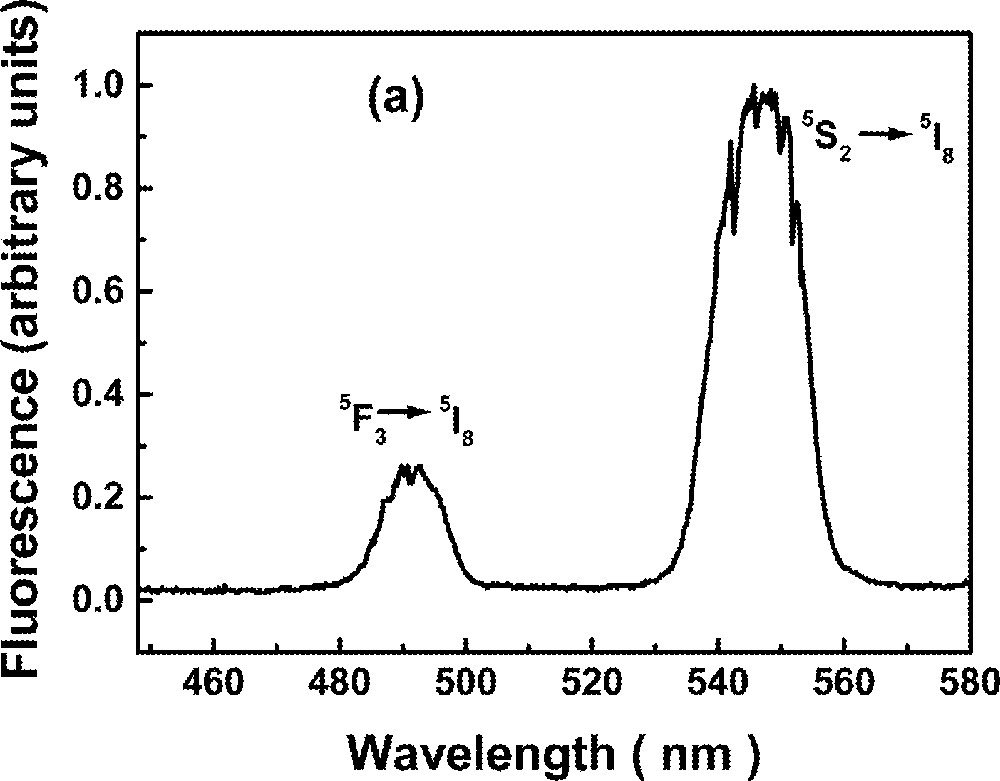
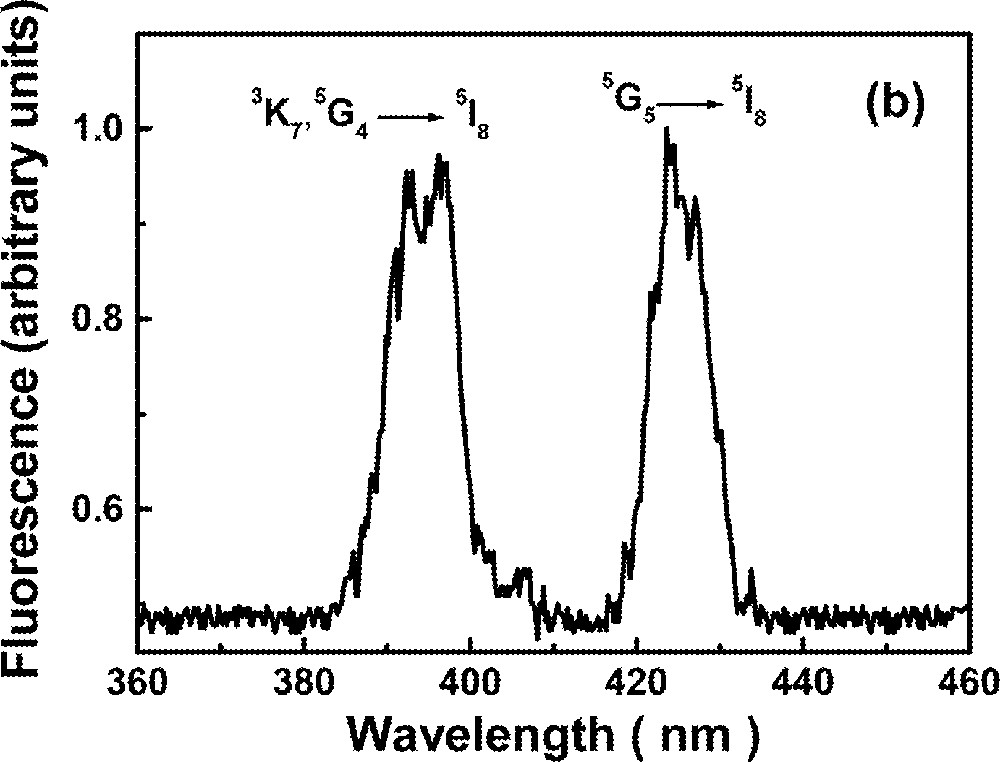
Upconversion spectrum of sample Ho5 for excitation at 640 nm. The intensity of the bands shown in (a) are two orders of magnitude larger than in (b).
The green luminescence at ∼550 nm presented a rise time between 3.2 and 4.2 μs, and a decay time that changes more than 50% (116 to 48 μs) for the range of Ho3+ concentrations investigated here. The blue emission at ∼490 nm presented a rise time that is shorter than the green signal rise time and shows a double exponential decay. The longer decay time component of the blue emission (22 to 18 μs) is dependent on the Ho3+ concentration. The results are summarized in Table 3. The dependence of the UPC signal as a function of pump intensity and Ho3+ concentration were also investigated. A quadratic dependence was observed in both experiments indicating that two laser photons are absorbed to originate each UPC photon and a pair of Ho3+ ions are involved in the UPC process. The emissions at ∼380 nm and ∼440 nm are very weak and it was not possible to analyze their temporal behavior. It is important to note that these emissions have not been observed in other glass hosts 〚53〛, probably because their intensities were strongly reduced, due to nonradiative relaxation.
Dynamics of the upconversion signal of Ho3+-doped fluoroindate glasses. Estimated data error: 5%.
| 〚Ho3+〛 (mol%) | 0.5 | 1 | 2 |
| Rise time @ 548 nm | 3.6 μs | 4.2 μs | 3.2 μs |
| Decay time @ 548 nm | 116 μs | 78 μs | 48 μs |
| Rise time @ 490 nm | 0.4 μs | 0.4 μs | 0.4 μs |
| Decay time (1) @ 490 nm | 3 μs | 3 μs | 3 μs |
| Decay time (2) @ 490 nm | 22 μs | 20 μs | 18 μs |
Fig. 3 shows the energy level diagram of Ho3+ and the main pathways responsible for the UPC processes. We expect that the UPC emission is due to ET between two ions at level 5F5, which are directly excited by laser photons at 640 nm. The lifetime of level 5F5 is large enough to allow significant ET between excited ions and two possible channels may populate level 5F3 via ET. One channel is an indirect ET assisted UPC (ETAU) via 5F5 + 5F5→5I7 + (3K7, 5G4), with subsequent population decay to level 5F3 via multiphonon emission from levels 5G4 and 3K7. The other channel is related to a direct ETAU via 5F5 + 5F5→5I5 + 5F3. We observed that the intensity of the UPC signal shows a quadratic dependence with Ho3+ concentration, which indicates that pair interaction is a relevant process.
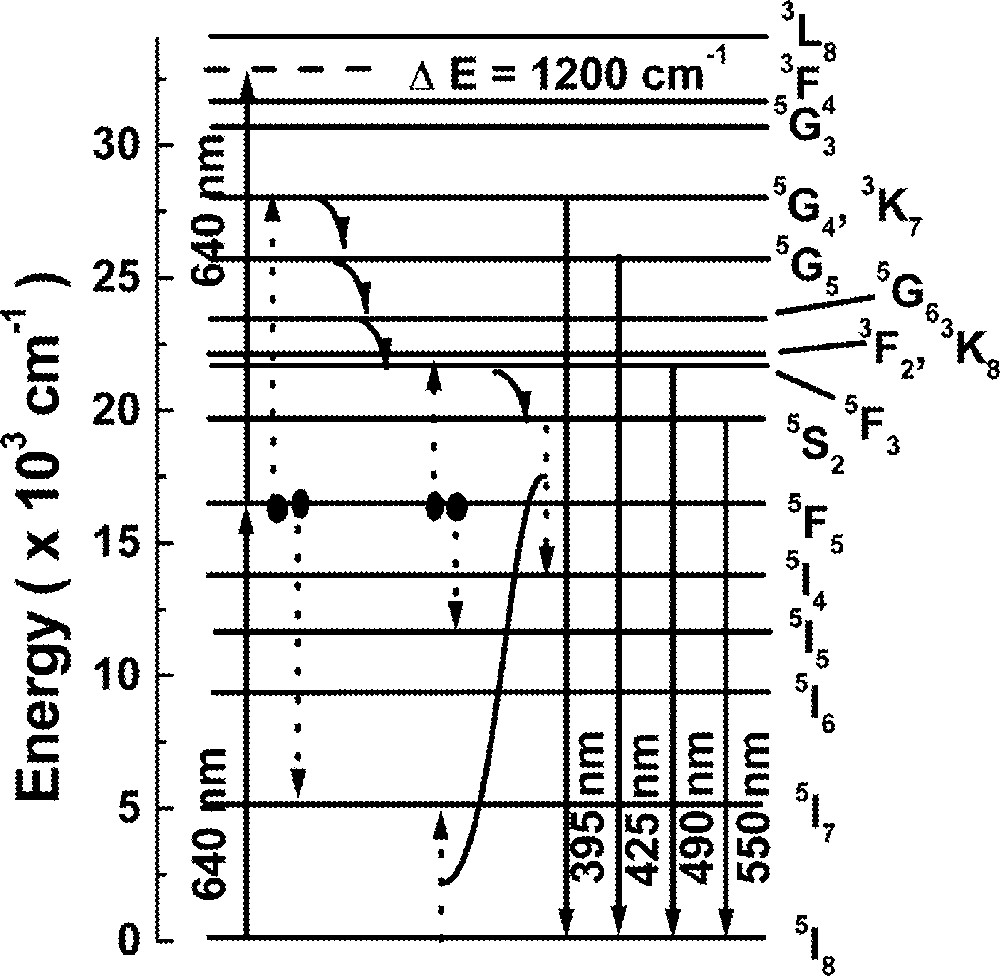
Energy-level scheme of Ho3+. Solid lines indicate radiative transitions; curved arrows represent phonon relaxations; dashed lines refer to energy transfer processes.
Using a rate equations approach to describe the UPC process, it is possible to estimate the ET rates from level 5F5 to level 5F3 considering the following equations:
The fluorescence intensity at ∼490 nm is proportional to n2(t) and, from the data shown in Table 3, we associate γ2 to the short-decay time component and therefore it is related to level 5F3 lifetime (estimated ca 5 μs from Table 2). The value of (γ3)–1 is dominated by (γ32)–1 ∼0.6 μs, while the lifetime of 5F5 is ∼47 μs. The Stokes shifted emission at 653 nm (transition 5F5→5I8) was used to evaluate the lifetime of level 5F5 using the less concentrated sample available with low excitation power at 640 nm. The signal decay was fitted with a single exponential curve yielding ∼ 47 μs of decay time. Therefore (γ3)–1 is associated to the rise time of the blue luminescence while (2 γ1 + W12 + W13)–1 is associated with the decay time. The cross-relaxation rates found are shown in Table 4. The measured rise time (0.4 μs), shorter than the value estimated via multiphonon emission rates from level (3K7, 5G4), may be due to the fact that the signal centered at ∼490 nm has a contribution from excited pairs decaying coherently (simultaneously) to lower-lying energy levels on a faster timescale than those pairs decaying incoherently. Values for A, B and C were obtained fitting the expression for n2(t) to the experimental data for the intensity decay.
Energy-transfer rates estimated from the experimental data.
| 〚Ho3+〛 mol% | 0.5 | 1 | 2 |
| W12 + W13 (s–1) | 3 × 10³ | 7 × 10³ | 13 × 103 |
| WR (s–1) | 6 × 10³ | 10 × 103 | 18 × 103 |
To understand the behavior of the emission at ∼550 nm, we assume that the population at level 5S2 is loaded via level 5F3, because the rise time of the green fluorescence has the same order of magnitude as the lifetime of state 5F3, which is dominated by the nonradiative relaxation 5F3 → 5S2 (2 × 10⁵ s–1). We recall that the green fluorescence decay time is dependent on the Ho3+ concentration, as indicated in Table 3. The cross-relaxation channel that depopulates level 5S2 (5S2 + 5I8 → 5I4 + 5I7) is efficient only after the cross-relaxation processes that lead to the blue luminescence takes place (see Fig. 3) 〚53〛. Again, the rate equations approach is used to estimate the cross-relaxation rates from level 5S2 through the following equations:
Here, 1 corresponds to level 5F3 and 2 is associated to level 5S2. The parameter is the decay rate of level 5F3 (5S2) and WR is the cross-relaxation rate. The ground state population was assumed to be non-depleted and thus the solution of the rate equations system yielded a simple equation that governs the dynamics of the population at level 5S2, given by . The parameter is the lifetime of level 5F3 and corresponds to the quenched lifetime of level 5S2. As the values of γ′1 and γ′2 are known, it is straightforward to find WR from the data of Tables 2 and 3. The values found for WR are shown in Table 4.
4.1.2 Tm3+-doped FIG
Thulium (Tm3+) is one of the most efficient rare-earth ions for obtaining laser emission, frequency upconversion, as well as to be used in optical amplifiers, when doping different hosts 〚44, 54, 55〛. Frequency upconversion in a variety of Tm3+ doped materials has also been investigated 〚23, 56–62〛. Of particular interest is the possibility of obtaining strong blue emission from Tm3+ doped materials pumped in the red and in the infrared. Upconversion laser emission and amplified spontaneous emission studies have been reported for Tm3+ doped optical fibers 〚63, 64〛.
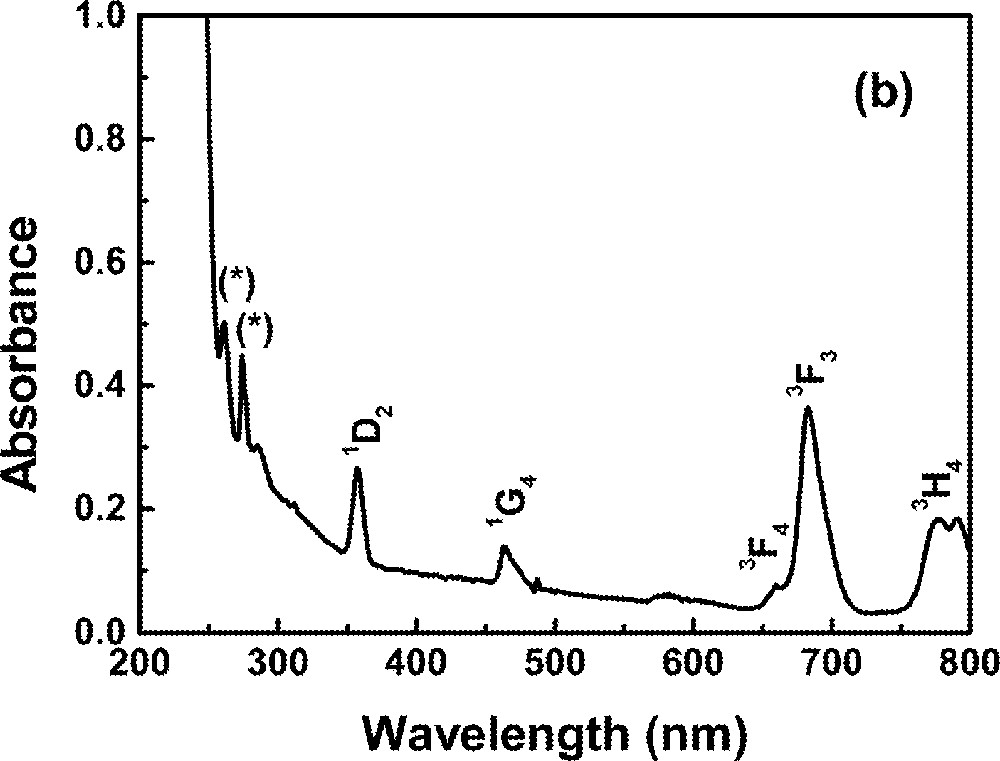
In this section we present spectroscopic properties of FIG samples doped with Tm3+. Fig. 1b shows the absorption spectrum of one of the samples. The dynamics of the fluorescence was studied and a model for the UPC process is given. Rates of energy transfer between Tm3+ ions are also provided.
From the absorption spectra of the samples studied we calculated the JO parameters: O2 = 2.36 × 10⁻²⁰ cm2, O4 = 1.59 × 10⁻²⁰ cm2, and O6 = 1.21 × 10⁻²⁰ cm2. Oscillator strengths, branching ratios, radiative lifetimes and multiphonon relaxation rates were determined for all Tm3+ levels and the results are presented in Tables 5 and 6.
Oscillator strength values and intensity parameters of Tm3+ doped fluoroindate glasses.
| Level | Energy (cm–1) | fexp | fcal |
| 3F4 | 5920 | 1.79 × 10–06 | 1.85 × 10–06 |
| 3H5 | 8320 | 1.43 × 10–06 | 1.29 × 10–06 |
| 3H4 | 12 771 | 1.92 × 10–06 | 1.94 × 10–06 |
| 3F3,2 | 14 620 | 2.95 × 10–06 | 2.98 × 10–06 |
| 1G4 | 21 445 | 0.70 × 10–06 | 0.56 × 10–06 |
| 1D2 | 28 011 | 1.91 × 10–06 | 1.90 × 10–06 |
| Ω2 | 2.36 × 10⁻²⁰ cm2 | ||
| Ω4 | 1.59 × 10⁻²⁰ cm2 | ||
| Ω6 | 1.21 × 10⁻²⁰ cm2 |
Radiative transition probability AJJ′ (s–1), radiative lifetime τR (μs), branching ratio βJJ′ and multiphonon relaxation rate WMP (s–1) of Tm3+-doped FIG.
| Transition | Energy gap (cm–1) | AJJ′ | βJJ′ | βJJ′ (exp) | τR | WMP |
| 3F4→3H6 | 5920 | 140 | 1 | 7117 | 2.32 × 10–04 | |
| 3H5→3F4 | 2400 | 4 | 0.025 | 6170 | 3.91 × 1004 | |
| 3H6 | 8320 | 157 | 0.975 | 5.69 × 10⁻¹⁰ | ||
| 3H4→3H5 | 4451 | 16 | 0.022 | 1251 | 6.28 × 10–01 | |
| 3F4 | 6851 | 59 | 0.074 | 1.54 × 10–06 | ||
| 3H6 | 12 771 | 722 | 0.904 | 2.25 × 10⁻²⁰ | ||
| 3F3→3H4 | 2006 | 2.7 | 0.002 | 576 | 3.26 × 1005 | |
| 3H5 | 6457 | 169 | 0.098 | 1.29 × 10–05 | ||
| 3F4 | 8857 | 45 | 0.026 | 3.16 × 10⁻¹¹ | ||
| 3H6 | 14 777 | 1516 | 0.874 | 4.61 × 10⁻²⁵ | ||
| 3F2→3F3 | 374 | 0.0 | 0.0 | 1143 | 2.12 × 1009 | |
| 3H4 | 2380 | 6.2 | 0.007 | 4.35 × 1004 | ||
| 3H5 | 6831 | 112 | 0.128 | 1.72 × 10–06 | ||
| 3F4 | 9231 | 291 | 0.333 | 4.23 × 10⁻¹² | ||
| 3H6 | 15 151 | 464 | 0.532 | 6.16 × 10⁻²⁶ | ||
| 1G4→3F2 | 6294 | 10 | 0.008 | 791 | 3.10 × 10–05 | |
| 3F3 | 6680 | 34 | 0.028 | 3.88 × 10–06 | ||
| 3H4 | 8674 | 128.2 | 0.102 | 8.47 × 10⁻¹¹ | ||
| 3H5 | 13 125 | 435.3 | 0.345 | 3.35 × 10⁻²¹ | ||
| 3F4 | 15 525 | 105.3 | 0.083 | 8.23 × 10⁻²⁷ | ||
| 3H6 | 21 445 | 549.5 | 0.434 | 1.20 × 10–40 | ||
| 1D2→1G4 | 6566 | 77 | 0.005 | 67 | 7.16 × 10–06 | |
| 3F2 | 12 860 | 589 | 0.044 | 1.39 × 10⁻²⁰ | ||
| 3F3 | 13 234 | 499 | 0.034 | 1.86 × 10⁻²¹ | ||
| 3H4 | 15 240 | 674 | 0.046 | 3.82 × 10⁻²⁶ | ||
| 3H5 | 19 691 | 38 | 0.003 | 1.51 × 10–36 | ||
| 3F4 | 22 091 | 7031 | 0.477 | 0.544 | 3.71 × 10–42 | |
| 3H6 | 28 011 | 5836 | 0.396 | 0.350 | 5.40 × 10–56 |
Fluorescence measurements were performed tuning the dye laser wavelength from 624 to 686 nm. Fig. 4 shows the emission spectrum of the sample Tm10 pumped at 650 nm, in resonance with transition 3H6→3F2. The band centered at 12 625 cm–1 corresponds to transition 3F4→3H6. The UPC emissions are associated to transitions 1D2→3F4 (22 220 cm–1) and 1D2→3H6 (27 550 cm–1). The emissions from state 1D2 present a quadratic dependence with the laser intensity and the excitation spectrum of both UPC emissions show a peak at 658 nm. No UPC emission is observed when the laser is tuned to transition 3H6→3F3.
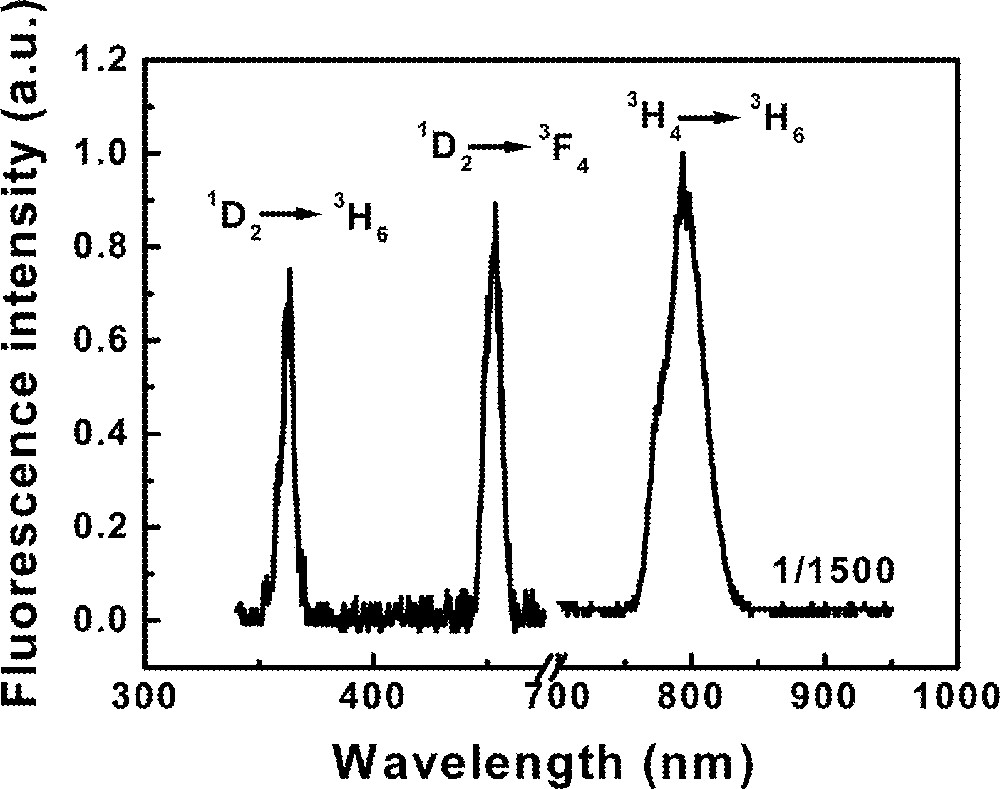
Fluorescence spectrum of sample Tm10 pumped at 650 nm.
The time evolution of the fluorescence shows a non-exponential decay for the three samples studied indicating the contribution of ion–ion interactions. Signal risetimes in the range from 150 ns to 316 ns, depending on the Tm3+ concentration, were measured for transition 3H4→3H6 with decay times varying from 560 to 44 μs. The risetime of the UPC transitions follows the laser pulse, while the decay time decrease from 26 to 6 μs as the Tm3+ concentration increases. The identified UPC pathway is indicated in Fig. 5, where the excited state absorption 3H4→1D2 is indicated as the dominant process.
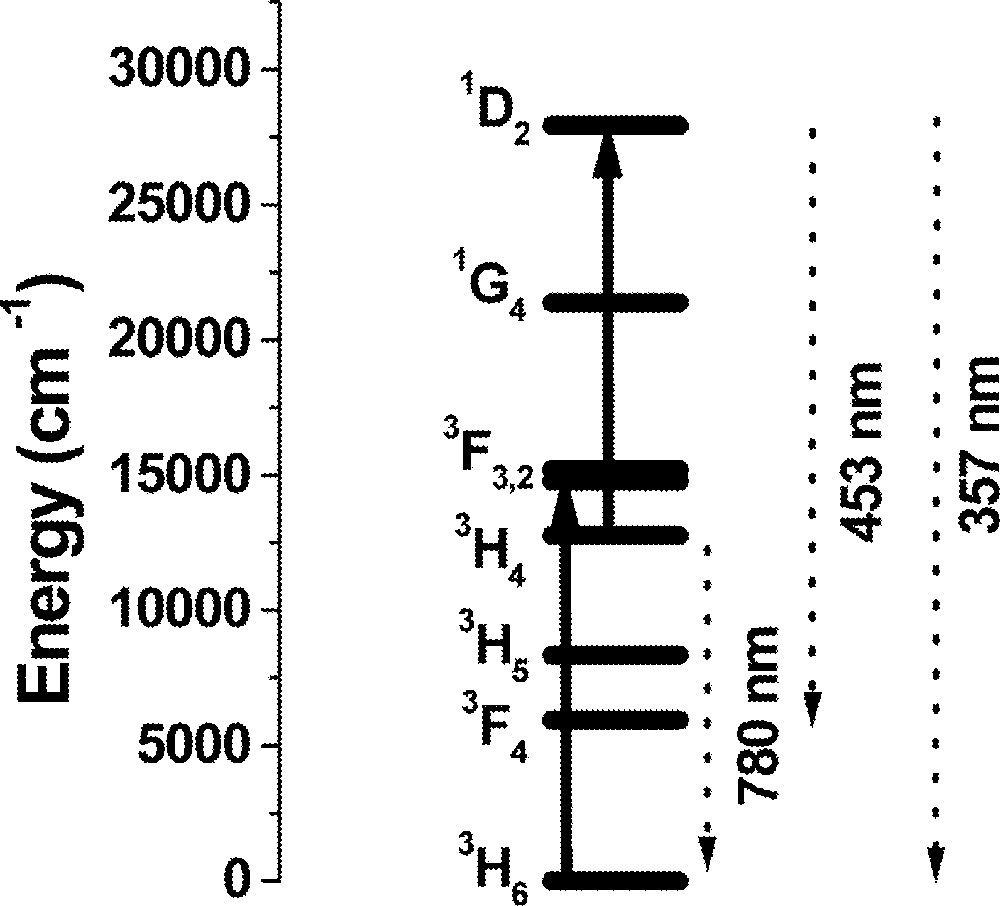
Simplified energy-level scheme of Tm3+. Solid lines represent the laser-induced transitions at 650 nm and the dashed lines correspond to the emissions indicated in Fig. 4.
Interaction between Tm3+ ions, as revealed by the non-exponential decay of transitions 1D2→3F4, 1D2→3H6 and 3H4→3H6, was studied using the Inokuti–Hirayama procedure 〚65, 66〛. The results indicate a dominant dipole–dipole interaction between Tm3+ ions. The data allowed us to determine the critical radius for different concentrations as shown in Table 7. A comparison of the critical radius with the average distance between ions suggests the presence of Tm3+ clusters in the samples. Formation of clusters may contribute to increase the UPC efficiency of the samples but it may be detrimental for operation of lasers. On the other hand, clusters may also favor radiation quenching, which is not of interest in general. Of course, further improvements in the preparation techniques have to be introduced to have control of clustering formation for particular applications.
Comparison between critical radius (RC) and mean distance (Rm) between Tm3+ ions as determined through observation of the fluorescence decay from 1D2 level
| Sample | Peak emission (cm–1) | RC (Å) | Rm (Å) |
| Tm10 | 22 222 | 17 | 21 |
| Tm20 | 22 222 | 17 | 17 |
| Tm30 | 22 222 | 17 | 15 |
| Tm10 | 27 550 | 17 | 21 |
| Tm20 | 27 550 | 18 | 17 |
| Tm30 | 27 550 | 18 | 15 |
4.1.3 Pr3+/Nd3+-codoped FIG
UPC processes involving pairs of Pr3+ or pairs of Nd3+ were reported in the past. For instance, in crystals doped with Pr3+, it was identified a process where two Pr3+ ions in the excited state 1D2 exchange energy in such way that one of the ions decays nonradiatively to the ground state, while the other one is promoted to multiplet (3PJ, 1I6). Emission at 480 nm due to transition 3P0 → 3H4 and a weak emission at 470 nm due to transition (3P1, 1I6)→3H4 were observed 〚67–69〛. In glasses this effect was originally reported in 〚70〛 and later in 〚31, 71〛. Processes involving pairs of Nd3+ ions that exchange energy were studied in crystals 〚72, 73〛 and, recently, similar processes were observed in FIG 〚34, 74–77〛, where efficient UPC emission was detected. Experiments were also reported involving triads Nd3+–Pr3+–Pr3+ in LaF3 〚78〛 and UPC due to triads of Pr3+ was observed in LaF3:Pr3+ 〚79, 80〛. More recently, UPC due to Nd3+ triads was investigated in crystals 〚81〛 and in fluoroindate glasses 〚35〛.
In this section we discuss evidences of ET processes involving triads and quartets of Nd3+/Pr3+ ions.
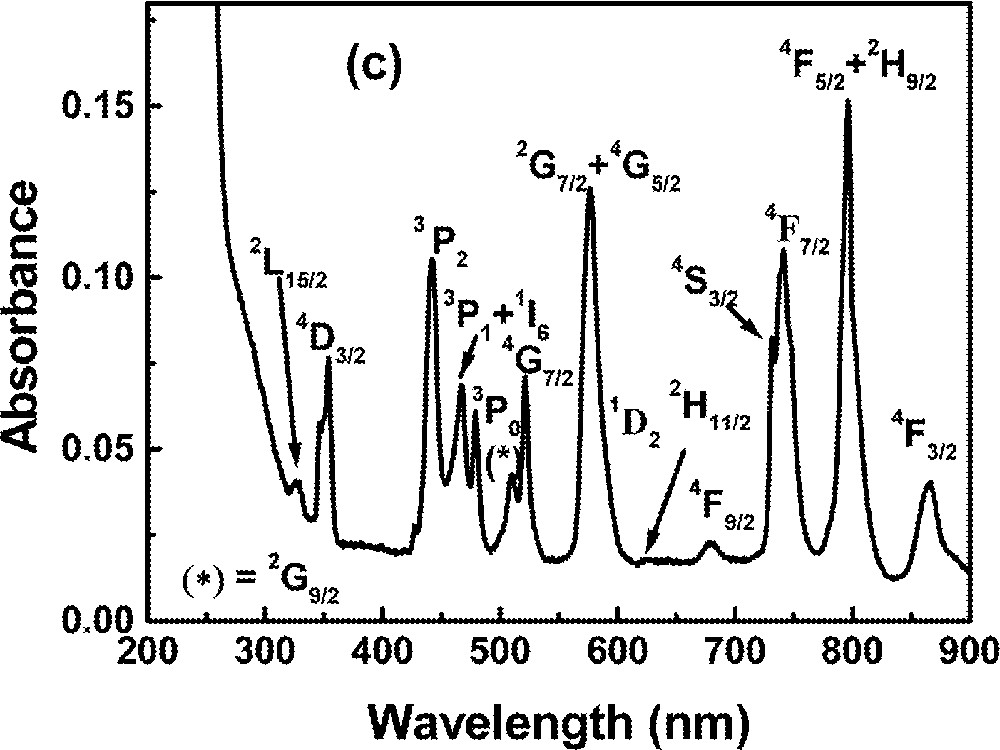
The absorption spectrum of the sample Pr2Nd2 in the visible range is shown in Fig. 1c. The broad features can be identified with transitions originating from the Pr3+ ground state (3H4) and from the Nd3+ ground state (4I9/2). The spectrum obtained for the sample Pr2Nd1 is similar, with no changes in the wavelengths of maximum absorption. All transitions are inhomogeneously broadened and the bands intensities are dependent on the ions concentrations. The spectrum of the sample without Nd3+, but with 0.2% of Pr3+, was previously reported 〚31〛.
The emission spectrum for excitation at 588 nm is shown in Fig. 6 for the sample with Pr2Nd1. The four bands located from 350 to 460 nm are due to Nd3+ transitions, and the peaks at 470 and 480 nm are due to Pr3+ ions. The states involved in the transitions are indicated in Fig. 6.
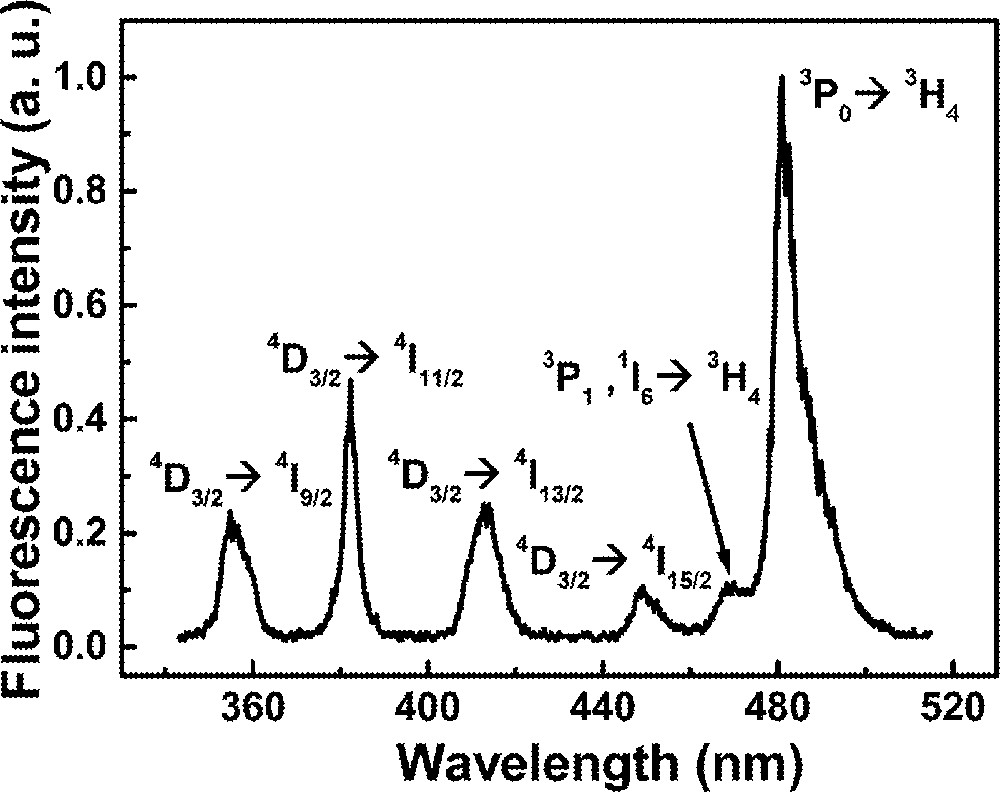
Emission spectrum of sample Pr2Nd1 for excitation at 588 nm.
To characterize the UPC pathways, the intensity of each fluorescence band was measured as a function of the laser intensity. The signals present a quadratic dependence with the laser intensity, which indicates that two laser photons are required to generate each UPC photon emitted. Time-resolved fluorescence measurements were also performed varying the wavelength of the pump dye laser between 577 and 588 nm.
With basis on the signal behavior as a function of the laser intensity, we first investigate the possibility that the fluorescence emission at ∼470 nm and ∼480 nm could be produced via the process reported in 〚67–69〛. However, although ET between two Pr3+ ions may be involved in the process that enables emission at 480 and 470 nm, the presence of Nd3+ plays an important role in the process. This was verified comparing the UPC efficiency of the Nd3+/Pr3+-codoped samples with the efficiency of a sample with 0.2% of Pr3+ only. An enhancement of the UPC intensity at 480 nm and at 470 nm, by two orders of magnitude with respect to a sample without Nd3+, was observed in the codoped samples. This is understood considering that: (i) the presence of Nd3+ increases the number of possible excitation pathways; (ii) the oscillator strength of the 4I9/2→(2G7/2 + 4G5/2) transition in Nd3+ is, approximately, five times larger than for transition 3H4→1D2 in Pr3+, and (iii) because of the large ET efficiency between Nd3+ and Pr3+ ions 〚78, 81, 82〛. Thus, the emission at 480 nm and 470 nm may be due to processes that involve pairs (Pr–Pr), triads (Nd–Pr–Pr) or quartets (Nd–Pr–Pr–Nd). The last two process are more probable because of the enhancement factor of ∼100 observed in the samples containing both Nd3+ and Pr3+. We expect that the absorption of laser photons occur mainly through Nd3+ ions, which resonantly transfer their energy to the Pr3+ ions in their neighborhood. ET from Nd3+ at (2G7/2+4G5/2) states to Pr3+ is a resonant process where the acceptors make transition 3H4→1D2, while the donor Nd3+ ion decays to the ground state. Following this step, two Pr3+ acceptors in state 1D2 exchange energy and one of them is promoted to the multiplet (3PJ, 1I6). The other ion decays to the ground state. Finally emission corresponding to 3P0→3H4 at 480 nm is observed. Fig. 7 illustrates the UPC process in the quartet case with the relevant states written, in a first approximation, as a direct product of the ions states. The triad and dyad cases can be represented in an analogous way. The rate equations for the density of populations, ni (i = 1, 2, 3), in the quartets levels can be written as:
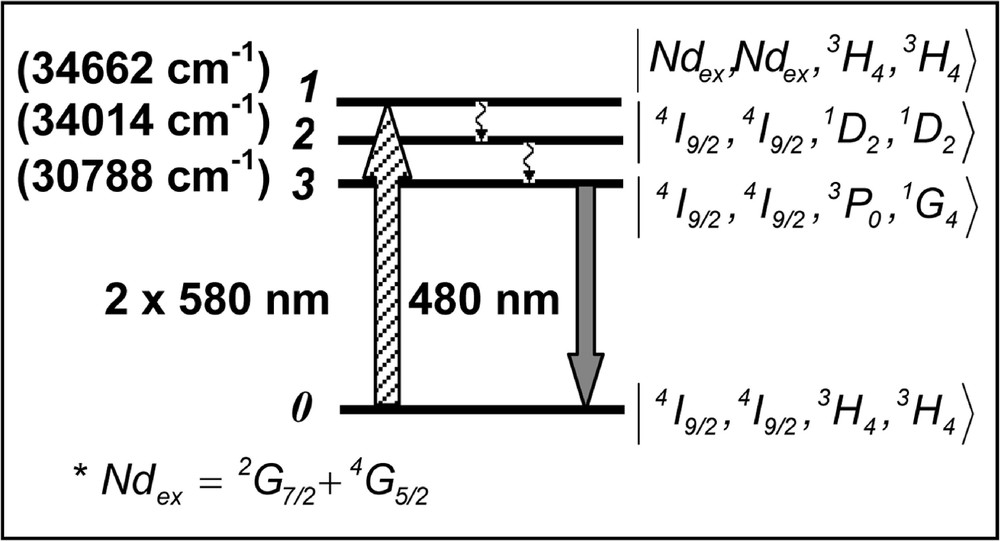
Upconversion pathways for the Nd3+–Pr3+ quartets.
The system of equations (11)–(13) has the following solution for t > τ, where τ is the laser-pulse duration.
Fig. 8 shows the fluorescence temporal profile for the sample Pr2Nd1 where the solid line represents a fitting of the n3(t) function, as given in equation (15). The numerical fitting gives a reasonable set of parameters, where it is possible to identify the 3P0 lifetime, (γ3–1) ∼ 14 μs, and the 1D2 lifetime, (W23 + γ2)–1 ∼ 106 μs. Unfortunately, it was not possible to obtain a value for the ET rate from Nd3+ to Pr3+, because the nonradiative transition rate between levels 1 and 2 is very large due to the small energy gap of ∼650 cm–1 between the two levels. Also it is impossible to determine unambiguously the main UPC mechanism (due to triads or quartets) via the temporal fluorescence analysis, because the estimated differences in the time evolution for triads or quartets is less than 1 ns, which is below the resolution of our data acquisition system. Moreover, it is not possible to infer, on the basis of the statistical distribution of ions, which contribution is more important, because, although the number of quartets would be smaller than the number of triads for a homogeneous distribution of RE ions, the probability of quartets excitation is at least five times larger than for the triads. Clustering of RE ions is another possibility that makes the analysis more difficult. All these points will be investigated in further work.
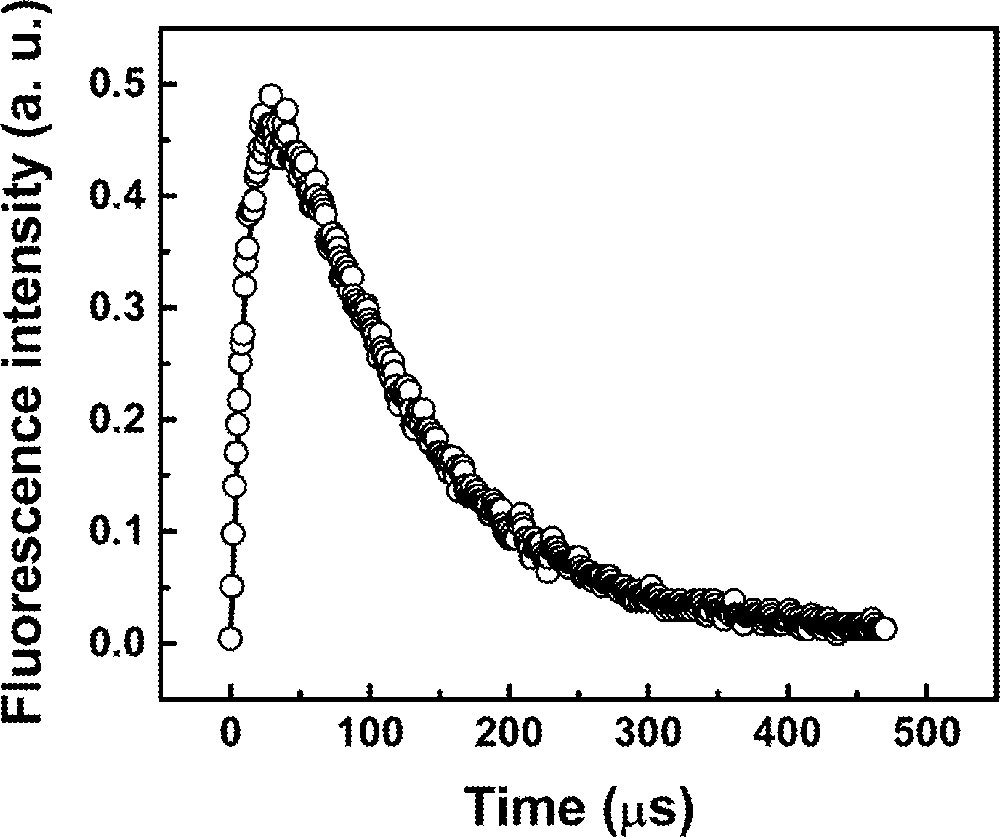
Fluorescence temporal evolution at 480 nm for sample Pr2Nd1 pumped at 588 nm.
4.2 Multiphonon-assisted UPC
4.2.1 Nd3+ doped FIG
The study of multiphonon (MP) assisted processes in RE-doped materials has been a subject of large interest. In the past, luminescence and UPC mediated by phonons have been analyzed by Auzel et al. 〚83–86〛. They demonstrated that it is possible to induce luminescence in solids doped with RE ions, even when the difference between the excitation frequency and the electronic-transition frequency is larger than the maximum phonon frequency of the host material. This was observed both for transitions involving creation or annihilation of phonons. Furthermore, contrary to what was generally thought, Auzel et al. 〚83–86〛 showed that MP-assisted processes should be described in terms of an ‘effective phonon mode’ – EPM (or ‘promoting mode’), with a frequency smaller than the phonon cut-off frequency of the host material. Recently, it was demonstrated that besides the scientific interest, studies of phonon-assisted processes are useful to photonic applications such as phase conjugation 〚87〛, lasers 〚88〛, avalanche UPC 〚89〛 and laser cooling of solids 〚90〛.
In this section, we show that UPC processes assisted by MP absorption can be highly efficient if optical transitions and thermal coupling between electronic levels are conveniently exploited. Our studies were mainly concentrated in the investigation of MP assisted UPC process from 866 nm to 750 nm. A forty-fold enhancement of the UPC emission intensity was observed when the temperature of the sample was varied from 298 to 498 K.
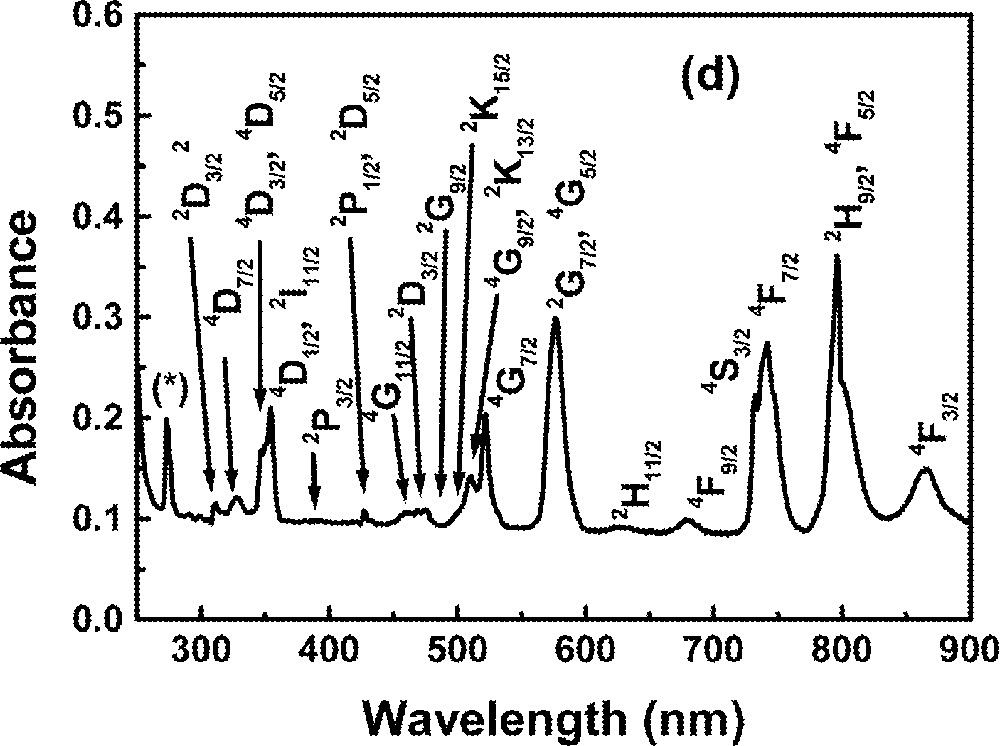
The absorption spectrum of a Nd-doped sample is shown in Fig. 1d.
The upconverted fluorescence spectrum was observed with several emission bands located from 350 to 750 nm. They are mainly due to UPC processes involving ET between two and three Nd3+ ions. These processes were studied previously in Ref. 〚34, 35, 75–77〛. However, the line centered at 750 nm presents a linear dependence with the laser power and it was assigned as a transition from level 4F7/2 to the ground state. It originates through a process where one laser photon is absorbed to level 4F3/2, followed by successive absorption of phonons to 4F7/2 via the thermally coupled excited state 4F5/2, as indicated in Fig. 9.
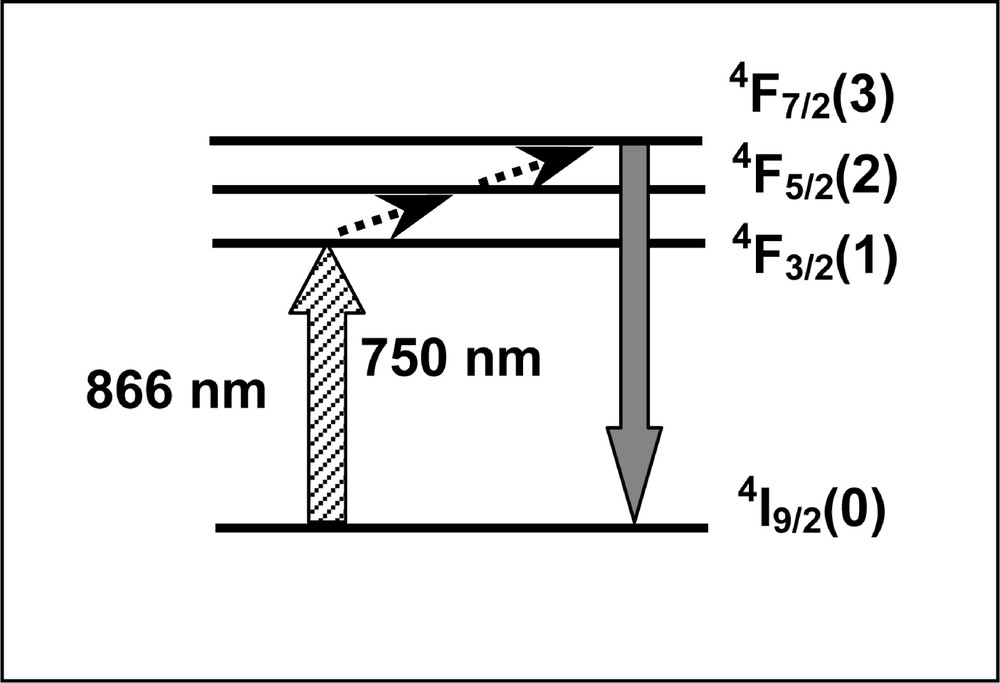
Simplified energy-level scheme of Nd3+ ion, representing the pathway for emission at 750 nm when pumping at 866 nm.
We monitored the integrated fluorescence emission at 750 nm as a function of the sample temperature, while the laser intensity was kept constant at 160 mW. The data obtained are presented in Fig. 10, which shows a signal increase when the temperature is varied from 298 to 498 K. The solid line in the figure represents theoretical results which are obtained considering the subset of energy levels corresponding to 4I9/2 (level 0); 4F3/2 (level 1); 4F5/2 (level 2), 4F7/2 (level 3) and 2P1/2, 2D5/2 (level 4) and following the approach described below. A rate equation system written for the population densities ni (i = 1, 2, 3) assumes the form:
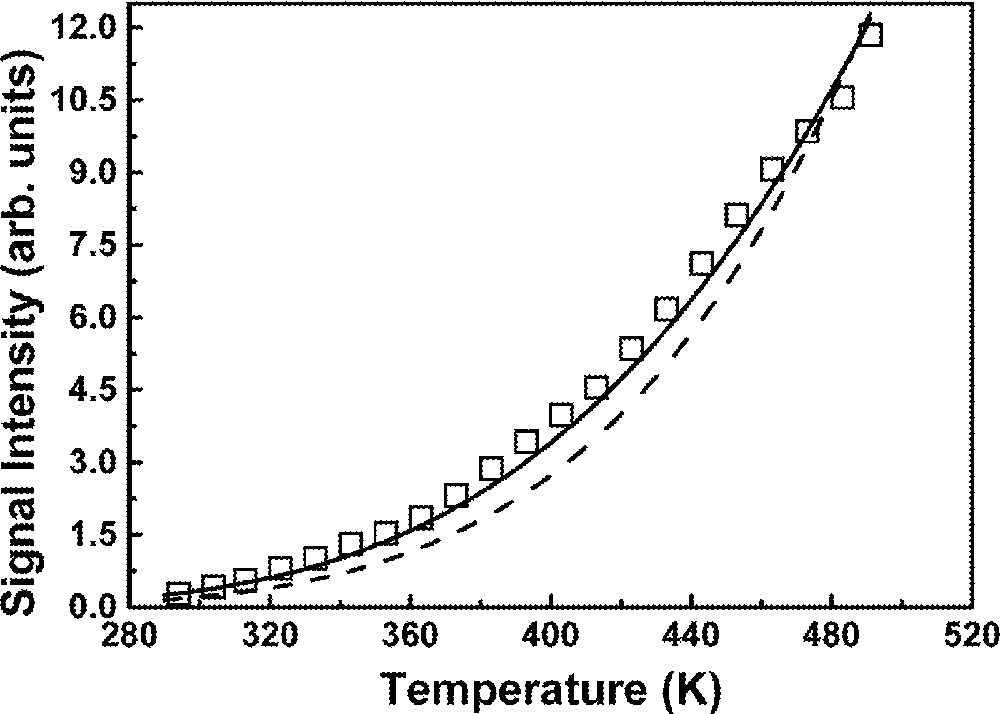
Temperature dependence of the emission centered at 750 nm. Solid (dashed) line represents equation (19) with effective phonon mode of 310 cm–1 (maximum phonon energy of 507 cm–1).
The steady-state population of 4F7/2 level can be found solving equations (16)–(18) and is given by:
The signal intensity shown in Fig. 9 is proportional to n3(T). Thus, in order to compare equation (19) with the data of Fig. 10, the following procedure was used. To determine n3(T), a reference temperature (T0 = 300 K) was chosen and was determined through the following expression obtained from 〚91, 92〛:
The comparison of equation (19) to the experimental results shown in Fig. 10 was made and the best agreement is observed when EPM are assumed to participate in all MP processes, as proposed in 〚83–86〛. The parameters obtained from the fitting were q = 1, q12 = q23 = 3 and ω = 310 cm–1. Also shown in Fig. 10 is a curve (dashed line) obtained from equation (19) for ω = 507 cm–1 which is the energy of the most energetic phonons in the FIG matrix 〚7〛. The mismatch of the dashed line with the experimental points obviates that the most energetic phonons do not dominate the MP absorption processes. In fact, several phonon modes contribute in a way that is determined by the phonon distribution density of states (PDDS) and the description in terms of EPM represents a kind of statistical average, which takes into account the characteristics of the PDDS. The value of ω = 310 cm–1 obtained from equation (19) corresponds to the EPM frequency of the glassy matrix. A comparison of this result with the results of 〚83〛 for ZBLAN glass (phonon cut-off frequency: ∼580 cm–1, EPM frequency: 325 cm–1) indicates a similar energy dependence of the PDDS in both materials.
The results presented above, together with the previous ones reported in 〚91, 92〛, provide indication that the exploitation of MP processes may increase the efficiency of RE-doped systems for particular applications. On the basis of the results above as well as those of 〚91, 92〛, we believe that further exploitation of MP processes may improve the performance of RE-doped upconverters. Of course, in all cases, one must work in temperatures far below the onset of crystallization of the sample.
4.2.2 Yb3+/Tb3+-codoped FIG
In this section, we report the observation of multiphonon-assisted cooperative energy transfer (MACET) between rare-earth ions in FIG. Bright UPC fluorescence from Tb3+ ions is observed due to MACET from Yb3+ ions excited using an infrared diode laser. This is a new effect reported here for the first time.
The absorption spectrum of a Yb3+/Tb3+ sample is shown in Fig. 1e.
Fig. 11 shows a typical UPC fluorescence spectrum for excitation at 1064 nm, whose frequency is ∼820 cm–1, i.e. below the 2F7/2 → 2F5/2 resonance of Yb3+ ions. The UPC emissions observed are due to Tb3+ ions and the corresponding transitions are indicated in the figure. The intensity dependence of the lines at ∼414 nm and ∼545 nm were determined as a function of the laser intensity and showed cubic and quadratic behavior respectively, indicating that three and two laser photons are involved in the UPC processes. The emissions at 545 nm are explained considering that initially Yb3+ ions are excited to the 2F5/2 state by the pump laser with the simultaneous absorption of phonons. Then, cooperative energy transfer between a pair of excited Yb3+ ions and a neighbor Tb3+ ion in the ground state occurs. Therefore, the Tb3+ ion is promoted to state 5D4 and afterwards green fluorescence is emitted.
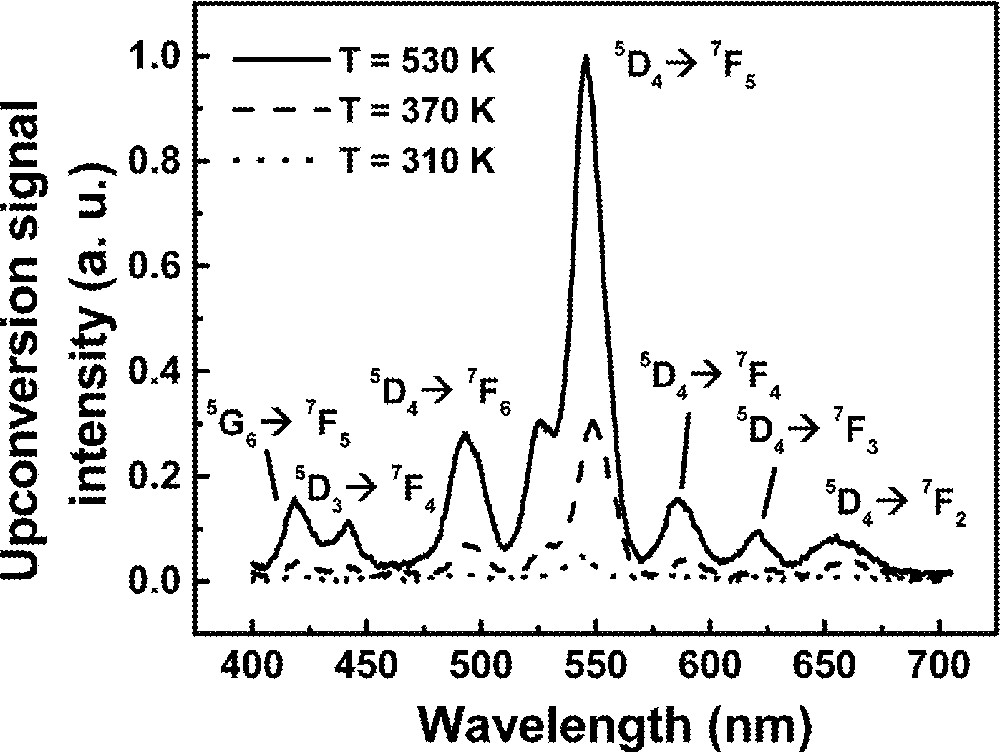
Upconversion spectrum of sample Yb15Tb5 for excitation at 1064 nm.
The blue emission at ∼414 nm also originates from the same MACET process, but after excitation to 5D4, a laser photon is absorbed promoting the Tb3+ ion to state 5D1, or a neighbor level, which decays later to 5D3 and 5G6. Finally, radiative emissions from 5D3 and 5D6 to lower Tb3+ energy levels take place. The UPC pathways are illustrated in Fig. 12, which exhibits a simplified level scheme of the interacting atoms.
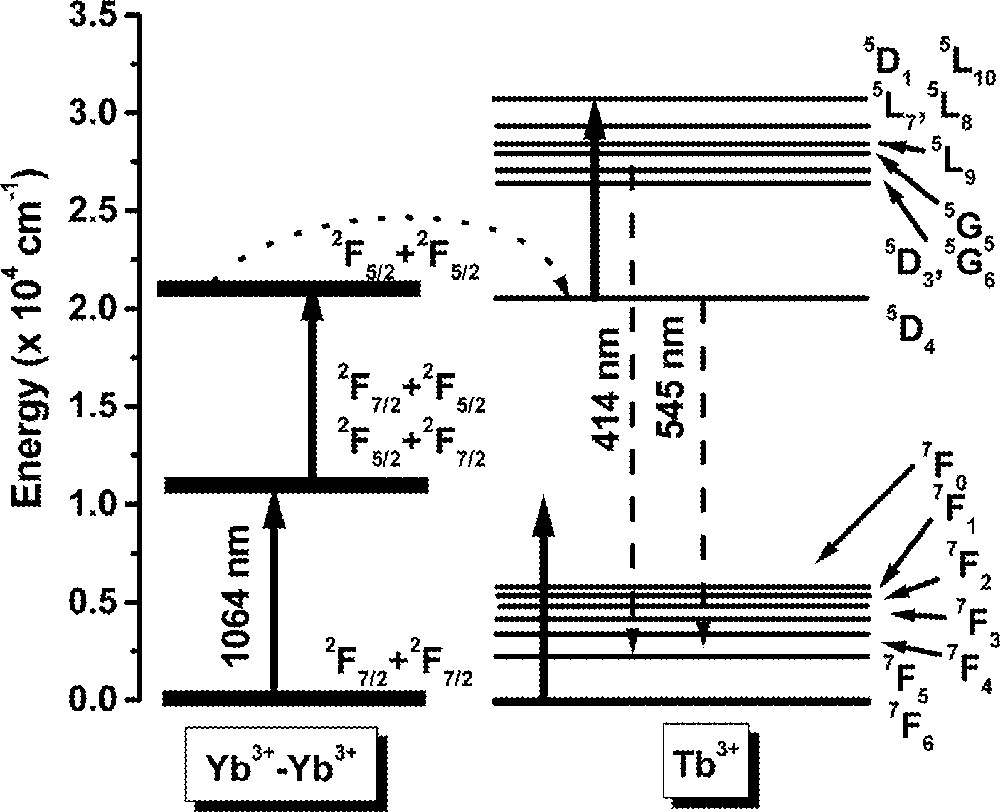
Illustration of the frequency-upconversion pathways involving triads Yb3+–Yb3+–Tb3+.
The solid lines indicate the laser excitation and the dotted lines represent the multiphonon absorption process. The dashed lines represent the cooperative energy transfer process. We observed that the blue and green UPC intensity was increased by a factor of ∼55 when the temperature was varied from 300 to 530 K. A detailed study of this UPC process will be published elsewhere.
5 Conclusions
In summary, we presented some optical properties of fluoroindate glasses doped with Ho3+, Tm3+, Nd3+ and codoped with Pr3+/Nd3+ and Yb3+/Tb3+ ions. Upconversion processes were discussed with emphasis on the fluorescence dynamics and thermal behavior. The results show that fluoroindate glasses have a large potential for applications in photonics due to its mechanical and optical properties. Up to the present time most of the work was performed with bulk samples; however, we expect that further studies using FIG based fibers and optical waveguides may allow the operation of efficient and compact upconverters and amplifiers.
Acknowledgements
We would like to recognize the contributions of our colleagues and former graduate students, particularly L.E.E. de Araujo, W. Lozano, A.S. Gouveia Neto, J.R. Rios Leite, A.S.L. Gomes, L.H. Acioli and E.M. Pacheco. The financial support from Programa Nacional de Núcleos de Excelência – PRONEX/MCT (Brazil) is acknowledged.