

1 Introduction
Crude oils contain asphaltenes that are of concern in the petroleum industry. These compounds can affect oil production at every stage, starting from the flow in porous media down to the transportation and the refining. Due to their tendency to aggregate and stick to solid surfaces, they can alter significantly the transport properties. Also, during various recovery processes (pressure depletion, gas injection, acidification), these macromolecules can flocculate and generate significant economic losses. Asphaltenes are commonly defined as compounds insoluble in n-heptane and soluble in toluene. Hence, there is no precise chemical definition of asphaltenes, but they may exhibit quite uniform chemical properties, as shown by various analyses [1]. At high dilution, the aggregate size is thought to be in the range 10–50 Å [1,2], and during flocculation, they can grow up to micron-scale sizes. Due the complexity of the molecules, the prediction of asphaltene flocculation is very difficult, although there is some recent attempt to use polymerisation models [3].
On the experimental side, the detection of flocculation is not an easy task at temperature and pressure. The recent development of low-field NMR apparatus that are portable on site or can perform in-situ measurements suggested us to test the feasibility of flocculation detection from simple relaxometry measurements. In particular, the transverse relaxation time T2 contains a wealth of information about molecular motions and large-scale interactions between molecules. For example, viscosity can be predicted over a range covering six orders of magnitude. Hence, this measurement seems at first glance adequate to probe changes of molecular motions induced by increasing aggregate sizes.
2 Theoretical background
Nuclear relaxation times are linked to rotational and translational motions of the spin carrying molecules through inter and intramolecular dipole-dipole interactions. If a molecule is viewed as a rigid sphere of radius a in a medium of viscosity η, the longitudinal and transverse relaxation times are linked to the viscosity of the medium and the radius of the molecule according to [4]:
| (1) |
For large molecules, the rigid sphere hypothesis is obviously a crude assumption but, to our knowledge, no theory is available for describing the various possible modes of relaxation. However, it should be pointed out that the rotational contribution is expected to be dominant for large molecules, and if the Stokes laws are still valid, a dependence with the molecular size is expected to persist, but not necessarily with the same sensitivity. Note that the dependence of T2 with viscosity is verified for a very large range of values [5] (1 to 105 cp) for crude oils (this is not true for T1). Therefore, the measurement of the longitudinal relaxation time at low field is expected to give information when aggregates are modified in a fluid.
3 Sample preparation
The asphaltenes considered in this study were extracted from the Prudoe–Bay crude oil by precipitating in n-heptane according to standardized procedures (NF T60-115). The dry solid residues were reduced to powder and mixed/homogenized with toluene in a sealed container during several hours at 30 °C. In parallel, 10-mm NMR tubes were modified to be easily and quickly sealed after introduction of a given solution. When ready, the solution is introduced into the NMR tube (about 100 μl) and a known quantity of n-heptane introduced before sealing the tube. Care was taken to not evaporate the solvents and modify the dilution. Using this method, we obtained three solutions using a deuterated toluene with different mass fractions of asphaltenes (C = 4.8, 8.2 and 12.0%) and five base solutions using protonated toluene with different mass fractions of asphaltenes (C = 2.5, 4.7, 7.6, 8.8 and 10.7%). To vary the solvent quality, about eight different mass fraction of n-heptane were introduced into the above five base solutions. The n-heptane fraction Φ relative to the total amount of solvent (toluene + n-heptane) varied from 0 up to 50%.
4 NMR relaxation measurements
All the NMR experiments were performed at a proton Larmor frequency of 60 MHz (‘Laboratoire de spectrométrie physique’, Grenoble, France). Several CPMG sequences were used to measure the transverse magnetization decays; for the short decays, echoes were recorded up to 8 ms using inter-echo times of 20, 50 100 μs, and for the long decays (up to 330 ms) characterizing the solvents, the inter-echo times were 500, 1000 and 1700 μs. For each decay, 64 scans are accumulated with a repeat delay of 10 s. Then, the data are combined to give a single curve. During this processing, we did not observe any mismatch, clearly indicating that there is no inter-echo time dependence and that the physicochemical processes studied were stable within the measurement time (in the order of 1–2 h). We subtracted also to the measured curves a parasitic constant probe signal extending up to 5 ms.
5 Relaxation data analysis
All the measured decay curves showed a sharp decrease at short time (10 μs – 5 ms) followed by a much slower decay representing the solvents. We show in Fig. 1 the data using the deuterated toluene (without n-heptane), for which most of the signal is due to the asphaltenes (a small signal still persists from the solvent due to residual protons). The magnetization decay is clearly multi-exponential, as shown by the curvature of the signal in semi-log scale (Fig. 1). For non-deuterated solvents, for which most of the signal is due to the solvents, the procedure is the following: first, the signal is scaled by the magnetization amplitude Mo obtained at 10 μs (first data point of the free induction decay); second, the signal is split according to:
| (2) |
| (3) |

Example of magnetization decay signals for three different asphaltene concentrations in deuterated toluene. These signals characterize the asphaltene aggregates. The straight lines indicate the relaxation time of the solvent (residual signal).
The multi-exponential model could be applied directly to the entire signal, but our experience indicates that the subtraction procedure yields a numerically stable and unique distribution of the short component. The coefficients Ai were calculated using standard inverse Laplace techniques where an optimum regularization term is calculated to avoid unstable solutions. For the stretch exponential model, the coefficients α and τ were calculated by linear regression in log(log(M))–t scale. The multi-exponential model has the advantage of visualizing rapidly the relaxation time distribution present in the system.
6 Aggregates characterization
The comparison between deuterated and protonated toluene experiments provided convincing evidence that the asphaltene aggregates could be characterized, even though the signal contribution in the later is relatively small. This is due to the relaxation-time contrast (several orders of magnitude) between the two terms Ma and Ms. It has important practical consequences. Hence, we focus here on the experiments performed in protonated toluene.
The measured decay curves Ma could be fitted precisely with both the multi-exponential and the stretch exponential models. In general, the aggregates are characterized by a large distribution of relaxation times (Fig. 2). Using the stretch exponential model, we found α values much smaller than 1. In the multi-exponential model, the distribution spans over more than one decade. In both models, the dominant relaxation time, presumably related to the size of the aggregates, lies at about 2 ms, except for the low concentration solution in which the dominant relaxation time is about two times larger. It is suspected that higher dilution will produce smaller aggregates and hence larger relaxation times. Furthermore, the relaxation rate 1/T2s of the solvent varies linearly with the asphaltene concentration (Fig. 3) according to:
| (4) |
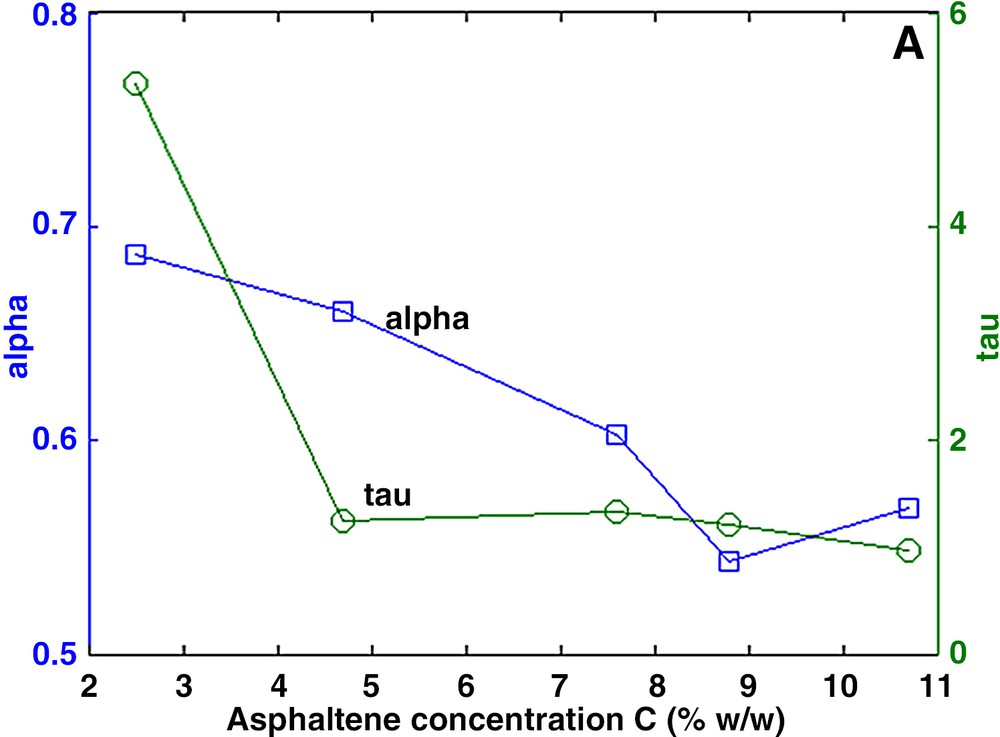

a and b. Characterization of asphaltene aggregates in toluene. Left: parameters α and τ of the stretch exponential model. Right: amplitude Ai of the multi-exponential model.
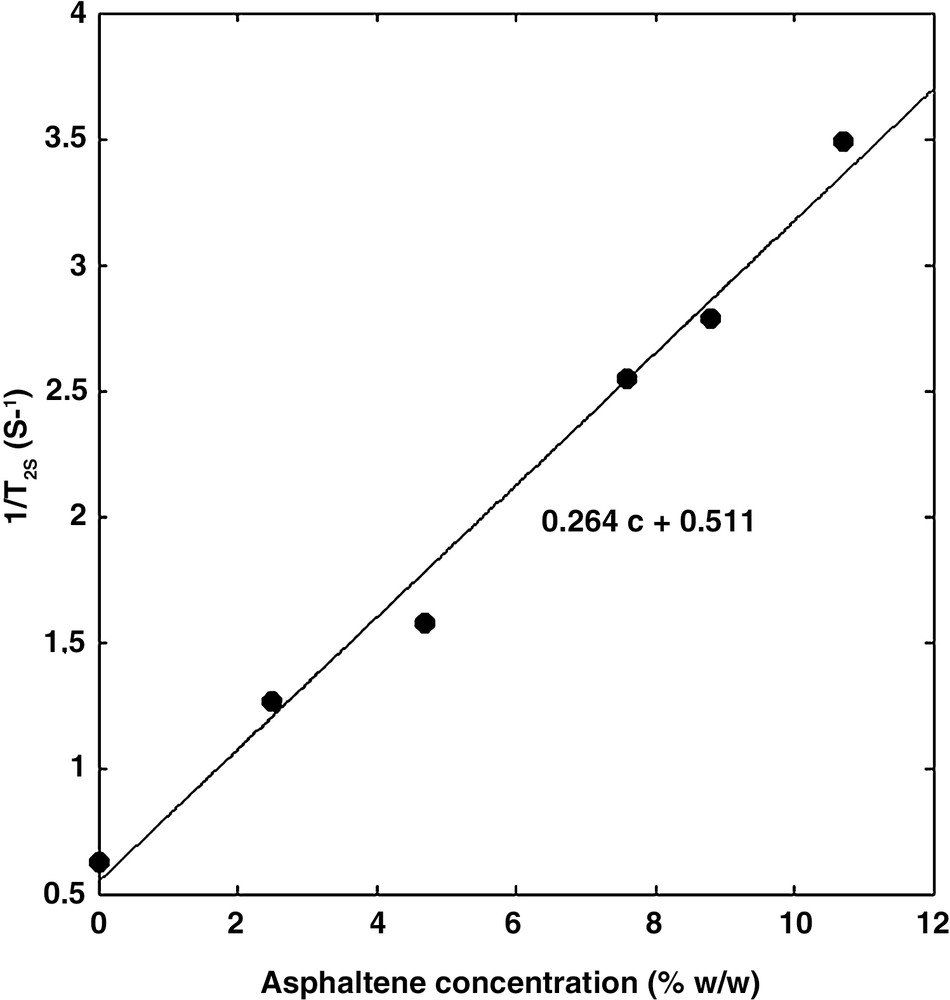
The relaxation rate 1/T2s of toluene increases as the asphaltene concentration increases.
7 Flocculation
Since NMR relaxation times are related to the size of the asphaltene structures, the NMR signal is expected to vary during the flocculation process. From the base solution with different initial asphaltene concentrations Ci, various quantities of n-heptane were introduced in order to induce flocculation. The data were analysed as explained above. The relaxation time of toluene and n-heptane are respectively 1590 and 1670 ms. Therefore, the relaxation time of the binary mixture does not vary very much in all the experiments. It is however influenced by the asphaltenes, as will be seen later.
The first approach is to detect the changes in relaxation time when the quantity of n-heptane is increased gradually. We present the results obtained on two solutions with initial asphaltene concentration of 2.5 and 8.8% w/w (Fig. 4). For the two solutions, we see that the distribution is split into two distinct relaxation modes when the n-heptane concentration is close to the flocculation threshold. Far above this threshold, there is no signification change, although the solution is considered to be flocculated by visual examination of the tube. However, for one solution (7.6%), the splitting into two relaxation modes was not observed, and for the other solutions it was less pronounced.


a and b. Relaxation time distributions of the asphaltene aggregates for two initial asphaltene concentrations and various fractions Φ of n-heptane (w/w) in the toluene/n-heptane mixture. The star indicates the instances when the solution is considered as flocculated, as observed visually.
The second approach is to follow the quantity As (Eq. (1)) corresponding to the number of protons with a long relaxation time (the solvent). For the initial base solution, we verified that As decreases linearly with the asphaltene concentration. When adding n-heptane to the base solution, the total proportion of solvent increases in the mixtures and therefore, As increases (Fig. 5). However, for n-heptane fractions above the flocculation threshold (about 35%), As decreases although the total amount of solvent still increases. This means that protons from the solvent are relaxing faster and have shifted at smaller relaxation time. This strongly suggests the existence of trapped solvent molecules inside the aggregates as the flocculation proceeds. This phenomenon was not observed on the other solutions presumably due to a lack of measurement sensitivity of As at low concentration C.
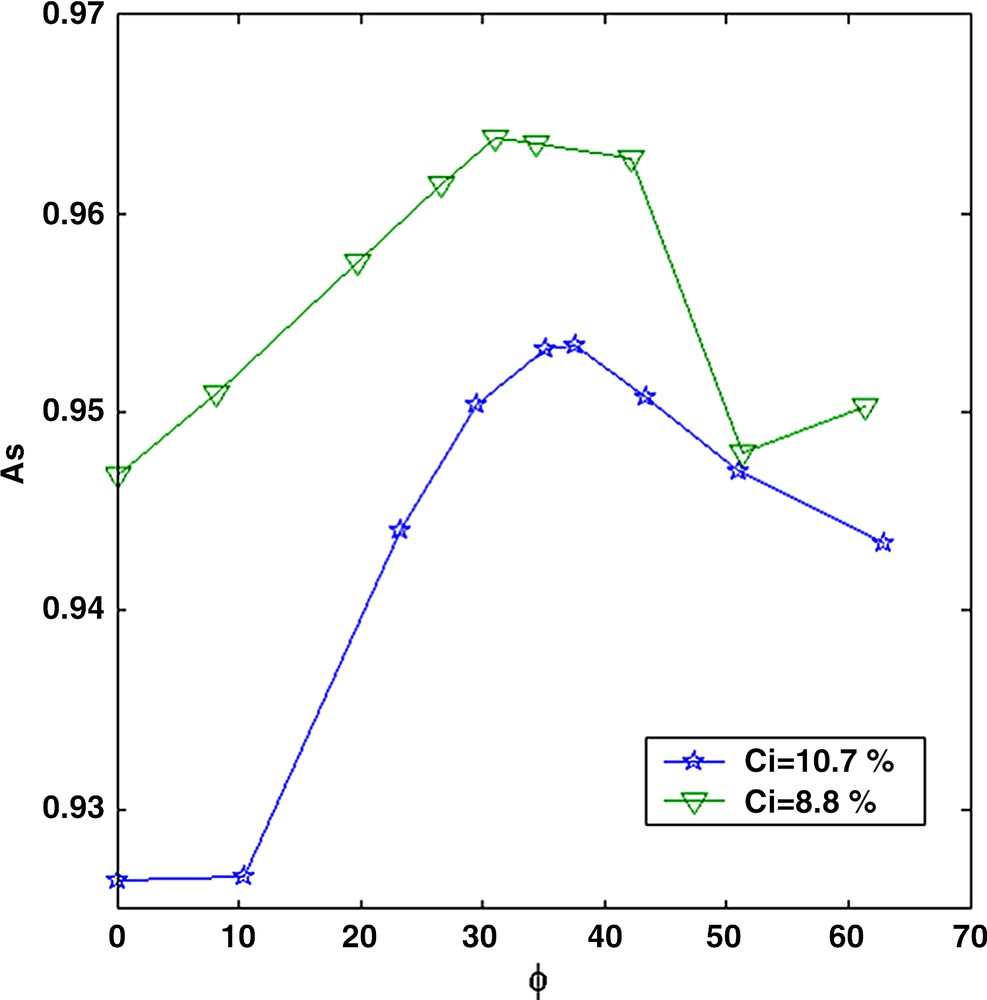
Magnetization amplitude As as a function of the n-heptane fraction Φ in the toluene/n-heptane mixture.
Finally, it is also of interest to analyse the influence of the asphaltenes on the solvent properties (term Ms in Eq. (1)). The relaxation time of a mixture of toluene and n-heptane is nearly constant and we have seen above (Fig. 3) that the toluene relaxation rate depends on asphaltene concentration (Eq. (4)). In a similar way, the relaxation rate of the solvent 1/T2s (Eq. (2)) for all the asphaltene–toluene–heptane solutions varies linearly with the asphaltene concentration (Fig. 6) according to:
| (5) |
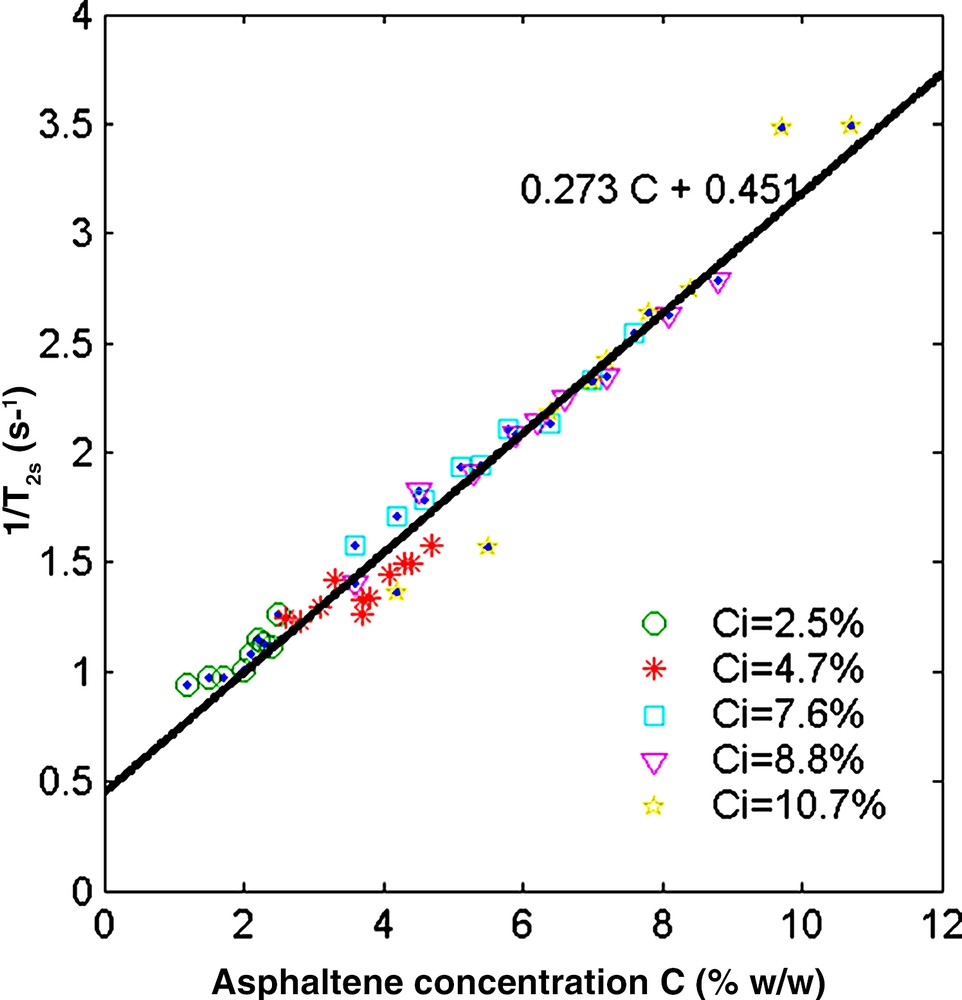
Relaxation rate of the solvent binary mixture as a function of the asphaltene concentration C. The different symbols indicate the initial asphaltene concentration Ci of the solutions. The unique slope indicates that there is no sharp viscosity transition during flocculation.
The slope is close to the one found for asphaltene/toluene solutions. Note that the graph in Fig. 6 gathers all the data points before and after flocculation.
8 Discussion
The NMR relaxation data collected are consistent with the flocculation process: as the quality of the solvent decreases (i.e. the n-heptane fraction increases), the aggregate size increases (the relaxation time decreases) up to the point where a solid-like structure is formed (the splitting of the relaxation time distribution of the asphaltenes). The bimodal signature is observed near the flocculation threshold and has been observed for all solutions except one. Therefore, we think that it might be a good indicator of the onset of flocculation but other independent measurements should be performed. Note that the two modes are separated by a factor of ten yielding a very robust signature in terms of numerical analysis. The absence of a bimodal signature at higher n-heptane concentration above the flocculation threshold is in apparent contradiction with the proposed signature. We suspect that the lower relaxation mode becomes gradually undetectable using standard CPMG sequences.
The flocculation threshold is also indicated by the decrease of the amplitude of the solvent (As), interpreted with a trapping mechanism of the solvent molecules inside the aggregates. However, analysing the solvent relative amplitude is a less sensitive method.
The linear relationship of the solvent relaxation rate with the asphaltene concentration can be interpreted as a viscosity effect. Unfortunately, viscosity measurements are not available and we rely on published data on similar systems. In the range of concentration considered, the solution studied can be considered in the dilute domain [6,7] for which the viscosity increases linearly with concentration. For similar solution, Fenistein et al. [6] and Henault et al. [7] found a viscosity increase of a factor of about 2 to 3 when C increases from 0 up to 10% (w/w). If we interpret the variation of the solvent relaxation rate as linked to viscosity, the measured slope (Eq. (4)) indicates an increase of a factor of 2.6, in agreement with these authors. Furthermore, since the dominant relaxation time of the asphaltene aggregates is not linked linearly with concentration (Fig. 2) and is nearly constant above C = 2.5%, the viscosity changes can therefore only be reproduced by the changes of the relation time of the solvent. However, we expect to observe a viscosity transition near the flocculation threshold [6] and this is not shown by the relaxation rate of the solvent for the flocculated solutions (Fig.6 , Eq. (5)). Therefore, the solvent relaxation time may not indicate all viscosity fluctuations. NMR dispersion and diffusion experiments could be useful to provide a better understanding of these phenomena.
9 Conclusion
Using asphaltenes extracted from the Prudoe-Bay crude oil, we measured and analysed the relaxation-time distribution of asphaltene-toluene solutions and asphaltene/toluene/heptane solutions. The asphaltene concentrations varied from 2.5 up to 10.6% and are considered in the dilute regime. The n-heptane/toluene fraction varied from 0 up to about 50%, covering the flocculation threshold. The asphaltene aggregates have a signature at low relaxation time (1 ms), while the solvent is seen at about 1.5 s. During flocculation, the asphaltene signature changes from a wide unimodal to a bimodal relaxation time distribution. The relaxation rate of the solvent varies linearly with the asphaltene concentration. These variations can be interpreted as a variation of viscosity, in agreement with measurements on similar solutions published in the literature.
Acknowledgements
We thank L. Nabzar (IFP) for providing some asphaltene samples and D. Broseta and J.-F. Argillier for helpful discussions.