

1 Introduction
The proanthocyanidins (PAs) belong to the condensed tannins' group [1]. They possess a common repeated flavan-3-ol group. The most frequently encountered structures are presented in Fig. 1. Oaks, and especially Quercus robur and Quercus petraea, are able to synthesize PAs. Large amounts are generally found in leaves, acorns [2], and bark [3]. Very small amounts are likely to be present in the heartwood [3,4]. PAs can contribute to the color evolution of oak wood, which can have an impact on its commercial quality. They can also have a potential influence on the gustative properties of beverages aged in oak barrels.

Structures of flavanols and some procyanidins.
We have conducted a complete investigation in order to estimate the average amount of PAs present in oak heartwood and to elucidate their structures after appropriate purification. NMR techniques have allowed the characterization of the polymeric and oligomeric forms.
2 Materials and methods
2.1 Sample origin
The oak samples were made up of heartwood from approximately 120-year-old trees, from homogeneous and appropriately maintained forest compartments. Different oak wood species were studied: Q. petraea from the center of France, and Q. robur. Only the first quarter of the trunk, the cooperage grade timber, was used for the study. The wood was chopped or sawed and then naturally dried for 24 months. The different samples were planed and then crushed to sawdust in liquid nitrogen, before being strained so as to keep only particles smaller than a 60 mesh size. The samples were freeze-dried, stored and analyzed within a period of 2 months.
2.2 Extraction of PA
Hundred grams of heartwood sawdust (60 mesh) were extracted with 1000 ml of acetone/water (7:3, v/v). After 24 h of continuous agitation at room temperature, we filtrated the extract and evaporated acetone under reduced pressure (T < 35 °C). Then, we conducted liquid–liquid extraction to isolate specifically the PA product: three successive extractions with ethyl acetate (30 ml) were necessary. The three organic layers were evaporated under reduced pressure and the dried extract was solubilized in MeOH/water (3:7, v/v).
2.3 Bate–Smith reaction
This method is based on oxidative depolymerization of PAs, with heat in a mineral acidic medium, and the formation of anthocyanins absorbing at 550 nm (red color). The method used was butanolysis in a hydrochloride medium with ferrous salts (FeSO4) as catalyst.
One milliliter of a methanol solution containing 0.01% (w:v) tannins, 6 ml butanol/HCl (95:5, v:v) and 0.2 ml of a ferrous reagent solution at 2% (w:v) was added to a glass test tube (10 ml) with a Teflon screwcap. The tube was hermetically sealed, shaken and the reaction left to develop for 40 min in a water-bath at 95 °C. The solution was cooled in ice-water. The intensity of the color that developed was measured at O.D. 550 nm (Anthelie Secomam™ spectrophotometer). The absorbance was subtracted from the absorbance of the unheated control sample. Results were measured from a standard curve for procyanidins prepared in the laboratory (hydroalcoholic maceration of seeds and then extracted with ethyl acetate).
2.4 p-Dimethylaminocinnamaldehyde (DMACH) method
One milliliter of tannin solution (1/20 diluted in methanol) and 5 ml of DMACH reagent (100 mg of corresponding aldehyde in 12 ml of hydrochloric acid) were added to a glass test tube. After 10 min, the optical density at 640 nm was measured using a 1-mm cell (D1). The experiment was repeated with methanol as the control. The value obtained was D2. The final absorbance was: dDMACH = (D1 – D2) × 10.
2.5 Thioacidolysis and desulfuration
2.5.1 Thioacidolysis
The major peaks of each HPLC chromatogram were collected off the column, and the solvent was evaporated (T ≤ 30 °C). The residue obtained was redissolved in 40 μl of reagent (5% solution of toluene-α-thiol in MeOH containing 1.7% HCl) in a glass ampoule. After sealing the ampoule, the mixture was shaken and heated at 100 °C for 1 h. Forty microliters of water were added in the hydrolyzed solution to avoid the formation of asymmetrical peaks and to improve chromatographic resolution. The solution obtained was then analyzed directly by HPLC.
2.5.2 Desulfuration
The solvent was evaporated and 30 μl of Raney Nickel (RaNi) were added. After sealing the ampoule, the mixture was shaken and heated at 50 °C for 1 h.
2.5.3 HPLC analysis
The extract was analyzed by reverse phase chromatography on a Waters™ HPLC system 600 E, equipped with a Waters™ 600 E pump. The column was an Interchrom™ C18 10 μm (250 × 4.6 mm) with a guard column of the same material. The eluant was a mixture of two solvents filtered through 0.45-μm membrane filters, solvent A: MeOH/H3PO4 999:1, solvent B: H2O/H3PO4 999:1. The injection volume was 20 μl (Rheodyne™ 7725i; manual injection). The elution program was performed at a constant flow-rate of 1 ml min–1, at a temperature of 20 °C, passing from 70% of B (for 5 min) to 10% of B in 40 min, and then rising to 70% of B in 10 min (for 5 min). The program included washing and reconditioning of the column. Detection was performed with a variable wavelength detector (Waters™ 486 MS) at 280 nm.
2.6 Polymerized PA fractionation
HPLC analysis of procyanidins with a degree of polymerization greater than 2 was difficult since we have isolated few pure molecules, and their hemisynthesis resulted in a low yield. In addition, HPLC analysis under our conditions did not allow the fractionation of polymerized forms that, whilst only being present in small amounts at the end of chromatography, tend to occur as a clump. The latter was isolated by repeated rounds of chromatography and was subjected to further fractionation on a LH20 column as described by [5]. Briefly, the clump isolated by semi-preparative HPLC was applied to a LH20 column, then fractionated first by elution with MeOH/water (60:40 acidified with 0.5% acetic acid) followed by acetone/water (80:20 acidified with 0.5% acetic acid). According to the authors, fraction I should contain oligomer PAs (1 < N < 4) and fraction II the polymerized forms (N > 4). The lyophilized fractions were analyzed by 13C NMR in their native form, and the spectra were interpreted as described by Thompson and Pizzi [6].
2.7 NMR spectra
All 1D spectra were recorded on a DPX 400 Bruker equipped with a 5-mm inverse broadband probe.
1H spectra were recorded with a spectral width of 2004 Hz, and a pulse width of 6.8 μs (corresponding to a rotation angle of 90°). A scan number of 16 and an interpulse delay of 10.2 s (8.2 s for the acquisition time and 2 s for the relaxation delay) were used. Processing, which was performed without any multiplication, was carried out with 32 000 data points.
The proton decoupled 13C spectrum was recorded with a spectral width of 14,125 Hz with 32 K data points using the standard jmod pulse programme with a delay (1/JCH = 0.00769 s) allowing us to distinguish CH and CH3 from CH2 and quaternary carbons. A scan number of 2500 and an interpulse delay of 3.2 s (1.2 s for the acquisition time and 2 s for the relaxation delay) were used. Exponential weighting with a line-broadening factor of 1 Hz was applied before the Fourier transform.
3 Results and discussion
3.1 Detection and characterization of PAs
Oxidative depolymerization of PAs in butanol–hydrochloride solution [7] gives rise to anthocyanidin. The resulting red color of the solution can be measured at O.D. 550 nm. Oak wood samples extracted in an acetone–water mixture, as well as the corresponding ethyl acetate soluble fraction were subjected to this reaction. It should be noted that the reaction was only very slight in aqueous medium and was barely detectable in some samples. In butanol solution, the characteristic red color was visible by eye and the reaction could be further intensified by adding 150 mg l–1 of iron as FeSO4. The majority of products responsible for the red color on hydrolysis could be extracted with ethyl acetate. The spectrum at 400–600 nm is characteristic of the presence of PAs.
After hydrolysis, the anthocyanidins formed were extracted with isoamyl alcohol [8]. The spectrum obtained was similar to that obtained with grape seeds, which are rich in procyanidins [9,10]. The ethyl acetate soluble fraction allowed the specific concentration of tannins.
Reverse phase HPLC revealed the presence of mainly cyanidin and delphinidin. Therefore, oak heartwood condensed tannins consist of a mixture of procyanidins and prodelphinidins. Their solubilization in ethyl acetate indicates that they are most likely present as the oligomer form.
3.2 Estimation of PA and flavanols content by various methods
The amounts of PAs and flavanols were measured in several Q. robur, Q. petraea and C. sativa samples. PAs were estimated by the standard oxidative depolymerization method in a butanol hydrochloride solution with FeSO4. Flavanols were estimated in the diethyl ether soluble fraction as described by Scalbert et al. [3]. Under these conditions, contaminating PAs were eliminated. The ability of aldehydes to be protonated in a strong acid environment and to combine with phloroglucinol nucleophile to give a soluble colored complex was exploited. DMACH was used [11]. These results are presented in Table 1.
Polyphenol index and quantification of flavanols and PAs in oak and chestnut heartwood extract (results are expressed in O.D. unit g–1 of dry wood for polyphenol index, mg g–1 eq. Procyanidins from seed e for procyanidins, mg g–1 eq. (+)-catechin for flavanols. t, total extract; e, EtOEt soluble fraction)
| Polyphenol indexa | Procyanidinsb | Flavanolsc | |||||||||
| d280t | IFCt | a/b | d280e | (H2O/HCl) | (BuOH/HCl) | c/d | (Vanillin) e(DM A CH)e e/f | ||||
| a | b | c | d | e | f | ||||||
| Q. robur | |||||||||||
| 1 | 14.3 | 17.3 | 0.82 | 0.62 | 0.53 | 0.78 | 0.68 | 4.35 | 2.16 | 2.0 | |
| 2 | 16.1 | 17.0 | 0.94 | 0.65 | 0.26 | 0.39 | 0.66 | 1.20 | 0.98 | 1.2 | |
| 3 | 15.0 | 16.7 | 0.90 | 0.58 | 0.19 | 0.26 | 0.73 | 4.35 | 2.73 | 1.6 | |
| Q. petraea | |||||||||||
| 1 | 14.7 | 15.4 | 0.95 | 0.71 | 0.46 | 0.54 | 0.85 | 2.80 | 1.13 | 2.5 | |
| 2 | 15.6 | 16.3 | 0.95 | 0.68 | 0.22 | 0.29 | 0.76 | 1.60 | 0.78 | 2.0 | |
| C. sativa | |||||||||||
| 1 | 17.9 | 17.0 | 1.05 | 0.32 | 0.26 | 0.32 | 0.81 | 3.15 | 1.92 | 1.6 | |
| 2 | 19.4 | 18.2 | 1.06 | 0.36 | 0.22 | 0.36 | 0.61 | 4.08 | 2.67 | 1.5 |
a d280, O.D. 280 nm; IFC, Folin–Ciocalteu index.
b H2O/HCl, hydrolysis in aqueous solution; BuOH/HCl, hydrolysis in butanol solution.
c Vanillin method and DMACH method.
They show that, for the oaks studied, few low molecular weight phenolic composants were solubilized in diethyl ether. The average amount of soluble procyanidins present in the acetone/water mixture varied from 0.3 to 0.8 mg g–1 of dry wood. The average amount of flavanols was between 0.8 and 2.7 mg g–1.
3.3 Identification of oligomer procyanidins
The identification of oligomer procyanidins was performed on the ethyl acetate soluble fraction corresponding to the majority of condensed tannins in oak. Concentration of the organic phase allowed analysis by reverse phase HPLC. Procyanidin dimers B3 and B6 were produced by hemisynthesis and purified by low-pressure chromatography on a TSK (HW-40(S)) column as described by Freitas [10]. Other type-B procyanidins and the C1 trimer were kindly provided by Freitas (University of Porto, Portugal). The procyanidin A2 dimer was isolated from the skin of Aesculus hyppocastanum fruit and characterized by NMR [12]. The HPLC conditions used were as described by Freitas [10]. The presence of procyanidins was confirmed by collecting the major peaks, thiolysis with toluene-α-thiol and HPLC analysis of the flavan-3-ols produced after desulfurization of the thioethers by Raney Nickel (RaNi).
The chromatogram in Fig. 2 compares the retention times and UV spectra of the eight dimer procyanidins, a galloylated procyanidin and a trimer. However, only four procyanidins could be isolated in sufficient quantity for thiolysis; only B1, B2, B6 and B8 were identified. Thiolysis of total extract gave more flavan-3-ols than procyanidins identified, suggesting the presence of other non-identified procyanidins on the chromatogram. Forms with a degree of polymerization greater than 2 are likely to be present.
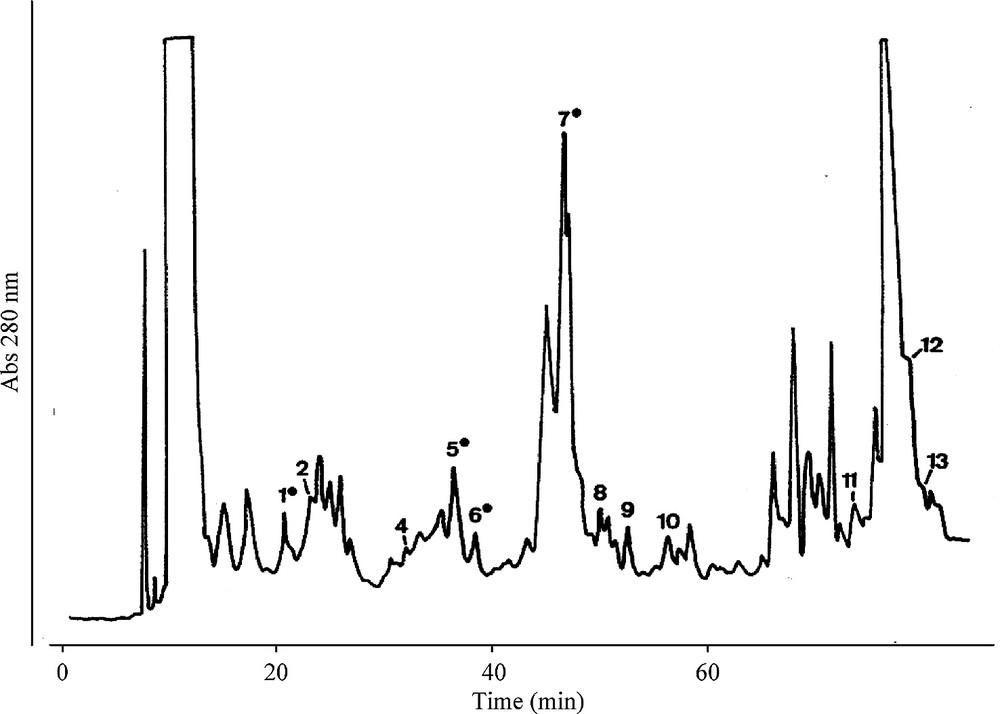
HPLC chromatogram (reverse phase) of the ethyl acetate soluble fraction of the Q. robur wood acetone–water extract.
The peaks were identified by comparison of Tr. And UV spectra with available reference compounds.
Numbers with (=) indicate that the attribution was confirmed by peak collection, thioacidolysis and identification of flavan-3-ols produced after RaNi desulfuration.
Identification of peaks: 1, procyanidin B1; 2, B3; 4, B4; 5, B2; 6, B6; 7, B8; 8, trimer C1; 9, B2 monogalloylated; 10, B7; 11, monogalloylated epicatechin; 12, B5; 13, A2.
3.4 Characterization of polymerized forms of PAs
13C NMR spectra of fractions I and II and their respective DEPTs are illustrated in Fig. 3. In Fig. 4, we present an enlargement of the DEPT of the 25–40-ppm area.
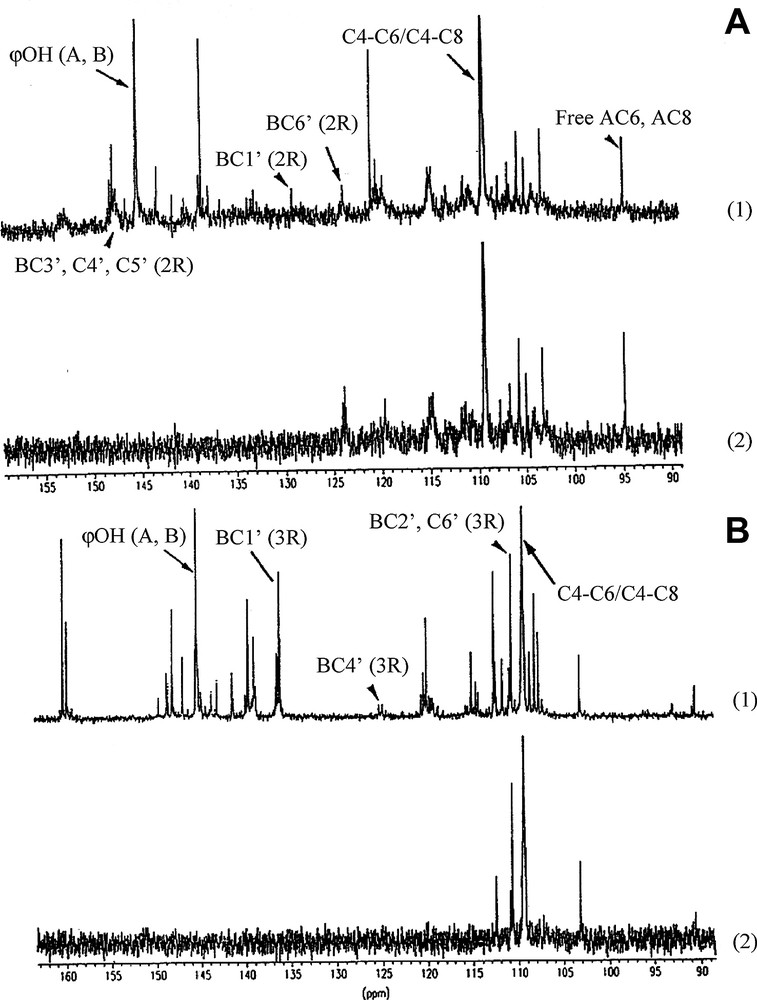
13C NMR (1) and DEPT (2) spectra of fraction I (A) and II (B).
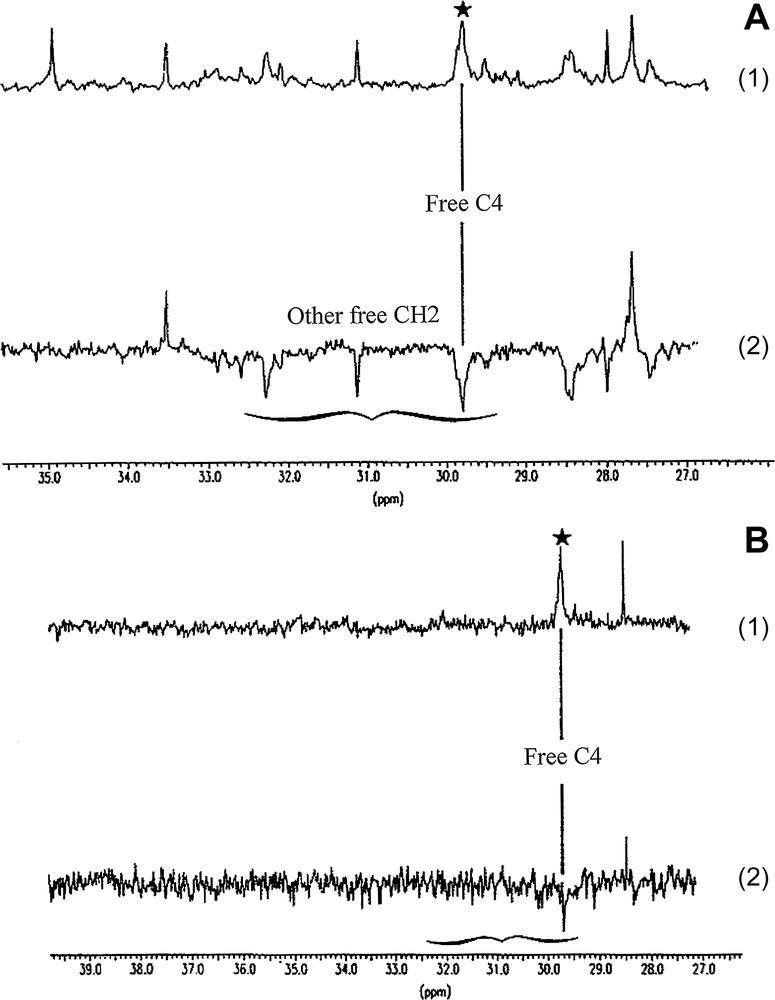
Enlargement of the CH2 area on the 13C and DEPT spectra (A, 13C; B, DEPT/1, fraction I and 2, fraction II).
3.4.1 Study of fraction I proanthocyanidols
On the 13C NMR spectrum at 145 ppm, A and B aromatic ring phenolic OHs are evident. The presence of a phloroglucinol A ring is characterized by the signal at 95 ppm attributed to free AC6 and AC8. The B ring is a catechol (o-dihydroxylated) ring indicating that fraction I consists mainly of procyanidins. The signals at 130 ppm for BC1′ catechol, 124 ppm for BC6′ catechol, 113 ppm for BC2′ and 148 ppm for BC3′, C4′, C5′ catechol allows the confirmation of the catechol nature for the B ring. Finally, the presence of C4–C6/C4–C8 linkages is indicated by the strong signal at 110 ppm. DEPT analysis should confirm the nature of the attributed carbons (quaternary, CH, CH2).
3.4.2 Study of fraction II PAs
Fraction II is clearly distinct from fraction I. The characteristic signals of PA structures (A and B aromatic ring, phenolic OH groups, free AC6 and AC8 and C4–C6/C4–C8 linkages) are present. However, the main signals attributed previously to o-dihydroxylated, e.g. pyrocatechol are absent (BC1′(2R), BC6′(2R), BC3′, C4′, C5′ (2R)). The signal close to 135 ppm can be attributed to BC1′ pyrogallol (o-trihydroxylated), the signal at 111 ppm to BC2′ and to BC6′, and the signal at 125 ppm to BC4′ pyrogallol, indicating that fraction II consists mainly of prodelphinidins. The weak signal at 148 ppm suggests the presence of a small amount of procyanidins.
3.4.3 Comparison of 13C NMR spectra of the two fractions
The main difference between the two fractions is due to the type of PA present. Fraction I contains procyanidins and fraction II consists mainly of prodelphinidins. In addition, we confirm the results of Kantz and Singleton [5] showing that fraction I contains oligomer PAs, whereas fraction II contains polymerized procyanidins. Fig. 3 shows that the signals for free AC6 and AC8 are almost absent in fraction II and, in addition, it can be seen in the enlargements (Fig. 4) that the procyanidins in fraction I possess more free CH2.
4 Conclusion
In this study, we made the demonstration of a significant amount of flavanols and related compounds like PA. The amount represented 2–4 mg g–1 for all the wood flavanols and less than 1 mg g–1 specifically for the PA. So in comparison to ellagitannin contents (20–150 mg g–1), this type of phenols represents a secondary product. But the powerful of color intensity of PA in comparison of total color of the wood can have a significant influence on the wood coloration. We know that in the wood industry the visual aspect of the wood represents an important parameter for its value. Probably, at this concentration, the wood is not able to affect the astringency and bitterness of beverage ageing in wooden casks. Concerning the variability of PA in heartwood, we found every time in all the analyzed samples (more or less 350 samples) a detectable quantity of PA. But the variability of the results represents ± 85%. Probably, it is due to the growing rate of the tree and the genetic variability of the PA synthesis. Some additional researches are useful to answer to this observation.
In addition, this work presents a structural study of the polymerized fraction of oak heartwood PAs. To our knowledge, this is the first such study. We have revealed the presence of an oligomer fraction (N > 3) of procyanidins and a polymerized fraction of prodelphinidins.