

1 Introduction
Real-time monitoring of chemical reactions and product streams has become more and more important in the polymer and plastics industry. This is due to the growing economic and legislative demands on product quality and on environmental protection. There is a need for rapid, reliable, non-invasive and cost effective analytical methods for process monitoring. Conventional process analytical methods are physical measurements like temperature and pressure. However, these physical data do not supply all the necessary information to process monitoring. Vibrational spectroscopic methods like attenuated total reflectance (ATR)-infrared (IR), near IR (NIR) and Raman and also ultrasonic measurements can deliver all the information for a qualitative and quantitative analysis during the process [1]. We use these methods for in-line monitoring of polymerization reactions to stop the reaction as soon as the end point has been reached and for the determination of the composition of polymer melts, e.g. in extruders [2,3]. Recent works for in-line spectroscopy applied to polymer synthesis are in [4–10] and papers to the application of NIR and ultrasonic spectroscopy applied to extrusion are in [11–15].
The aim of the present paper is to show that spectroscopic and ultrasonic methods are excellent in situ methods for monitoring polymerization processes and for the in-line determination of the composition of polymer blends and additives during extrusion processes. First example is the in-line monitoring of the modification of the OH endgroups of novel highly functionalized hyperbranched poly(urea-urethane)s with ATR-IR spectroscopy, which have applications in blends, at surfaces and in microelectronics. Second example is the in situ characterization of the synthesis of a halogen-free amino-functionalized poly(methyl methacrylate) (PMMA) by Raman spectroscopy. Third example is the real-time determination of the content of the flame retardant melamin cyanurate (MC) in polyamid (PA)12 during extrusion by NIR spectroscopy. Last example is the determination of the composition of the blend polyethylene/polystyrene (PE/PS) during extrusion by NIR and ultrasonic spectroscopy.
2 Quantitative analysis—chemometrics
The chemical information of vibrational spectra are in the band positions, which give information about the appearance of certain chemical compounds in mixtures. Band intensities have the quantitative information of these compounds. For using spectra for quantitative analysis it is necessary to find a relationship between the spectra and the concentrations of the compounds. This relation is the calibration. The best way to determine the content of a chemical compound is to measure the change of the intensity of a well resolved band that clearly belongs to the desired compound. However this case is possible in Raman spectra but not very often in NIR spectra. Mostly the mixture of different chemical compounds give spectra with overlapping bands and the intensities are not directly related to the content of a single compound. In these cases it is necessary to use multivariate methods called chemometrics to extract the information from the spectra. The most used chemometric method is the principal component analysis (PCA). This is a data reduction method, which separates the spectral data into independent spectral variations called factors. These factors are directly related to the concentrations of the components. Quantitative models based on PCA are the principal component regression (PCR) and the partial least square (PLS) method. A detailed description of these methods is in [16–18]. It is important to carry out a careful calibration, which can be frequently complex and time consuming. After building the calibration model it is necessary to validate the model with independent data for testing reliability and robustness. This validation guarantees a long-term stability of an in-line process system.
3 Experimental
3.1 In situ ATR-IR spectroscopy of the modification of the OH endgroups of hyperbranched poly(urea-urethane)s
The synthesis of the hyperbranched poly(urea-urethane) is fully described in [19] and our investigated terminal group modification is shown in Fig. 1. This reaction was carried out in a 250 ml flask under Argon atmosphere at room temperature under stirring. The reaction time was 3 h.
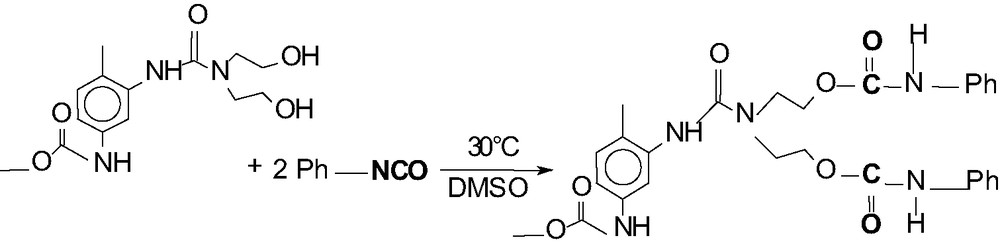
Reaction equation for the modification of the OH terminal groups of hyperbranched poly(urea-urethane).
3.1.1 Analytical techniques
We collected in situ in the flask every minute an IR spectrum with an ATR-IR dipping probe. This probe has a silicon crystal as tip and was connected with the ReactIR 4000 system (Mettler-Toledo). The spectrometer works in the range from 4000 to 650 cm−1 with a resolution of 4 cm−1 and 32 co-added scans by using a MCT detector and gold coated moveable tubes as light pipe from the spectrometer to the flask. It is a compact bench top instrument designed for real-time in situ analysis of chemical reactions.
3.2 In situ Raman spectroscopy of the formation of halogen-free amino-functionalized PMMA by ATRP
In the present study we used essentially the same method as reported by Schön et al. [20]. The used catalyst system, CuBr/PMDETA = 1:2 and an initiator containing a protected amino functionality, in ATRP of MMA results in amino-functionalized PMMA. To hinder amino-caused side reactions and interfering of the amino-group with the catalyst system, the amino functionality of the initiator was protected before use. In order to obtain low molecular weight polymers, which can be analyzed with sufficient accuracy, a relatively high initiator to monomer ratio of 1:20 was chosen. The ATRP was carried out in solution at 25 °C in a flask.
3.2.1 Analytical techniques
The kinetics of the polymerization was studied in anisole by in-line Raman spectroscopy and off-line 1H NMR spectroscopy. We collected in situ every 2 min a Raman spectrum with an in-line probe, which was directly immersed into the reaction medium. Cleaning of the probe head surface is required from time to time to avoid excessive fouling. The probe was connected via optical fibers with the Raman spectrometer Holo-Probe 785 (Kaiser Optical Systems). The system has a diode laser operating at 785 nm and a CCD camera as detector with a resolution of 4 cm−1. The exposure time was 5 s for one scan and for one spectrum 10 scans were accumulated.
3.3 Quantification of the flame retardant melamine cyanurate (MC) in PA 12 by NIR spectroscopy
We used PA 12 powder (Vestosint; Degussa) and the flame retardant MC (Melapur; Nordmann and Rassmann). The mixing of both components was carried out in a twin screw extruder (Micro-Leistritz) at 20 bar and 225 °C.
3.3.1 Analytical techniques
We collected in-line NIR spectra in a melt-at-die interface which was adapted between extruder exit and nozzle at the end of the extruder (Fig. 2). A NIR diffuse reflectance probe as well as pressure and temperature probes were in this interface. The NIR probe was connected to the NIR process spectrometer SentroProcNIR (Sentronic GmbH) by two optical fibers. The spectrometer is based on the diode array technology and works in the spectral range from 900 to 1700 nm (5800–11000 cm−1). The measure time was 5 s for one scan and we used 10 scans for one spectrum. NIR probes are not pressure sensitive in a range of ±10 bar. On the other hand a NIR spectrum is temperature-sensitive. On this reason the temperature should have not more than ±2 °C deviation during processing.
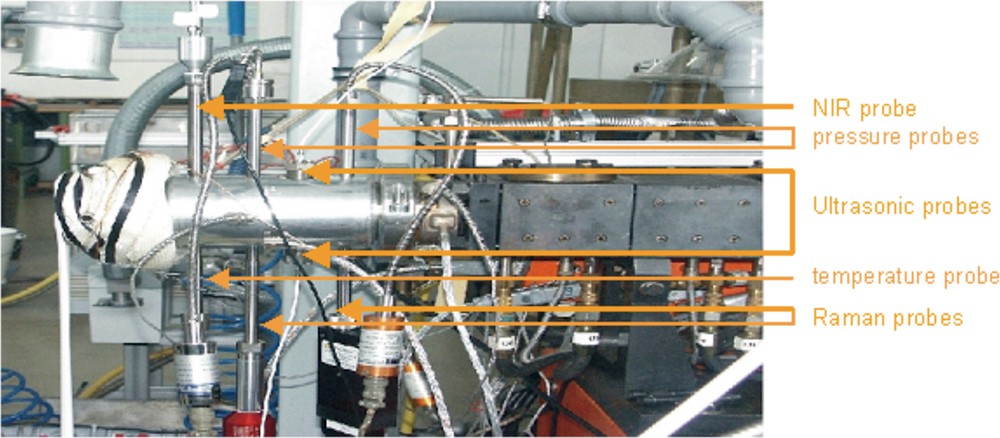
Melt-at-die interface adapted between extruder exit and nozzle with NIR, Raman, ultrasonic, pressure and temperature probes.
3.4 Quantification of the composition of the blend PE/PS by NIR spectroscopy and ultrasonic measurements
Eleven different PE (Lupolen 3020D; Basell)/PS (PS 168N; BASF) blends from 0% to 100% PS content were extruded in a twin screw extruder (Micro-Leistritz) at 200 °C and 70 bar.
3.4.1 Analytical techniques
We collected the in-line NIR spectra as well described above in Section 3.3. For the ultrasonic measurements we used two ultrasonic probes with 5-MHz working frequency in the same melt-at-die interface where the NIR probes are adapted. Both ultrasonic probes are connected to transmitter and receiver PC plug-in cards which are assembled in a standard PC with electrical wires. The ultrasonic probes are home-made in collaboration with the DKI (German Plastic Institute Darmstadt) according to constructional drawings from the DKI [21]. Parallel to the ultrasonic measuring, temperature and pressure are measured and the measured ultrasonic data are immediately temperature and pressure corrected in real-time by calibration methods done with polyethylene. The reason is that ultrasonic data are very sensitive to temperature and pressure changes. For these measurements we used a combined temperature–pressure probe (Gefran ISI Inc.) with a thermocouple M32 (type J) and a melt pressure transducer M32 (extension measurement with a liquid membrane).
4 Results and discussion
4.1 In situ ATR-IR spectroscopy of the modification of the OH endgroups of hyperbranched poly(urea-urethane)s
We monitored the reaction in situ with the observation of three different IR bands. First, we observed a decrease of the NCO isocyanate bands at 2281 and 2261 cm−1. This group indicates the consumption of the phenyl isocyanate compound. Second, we observed an increase of the C=O urethane band at 1709 cm−1. This group indicates simultaneously the formation of the urethane terminal groups (Fig. 3). The conversion calculated from the ATR spectra shows clearly that the reaction has reached a conversion of approximately 97% after 60 min (Fig. 4). Inspecting the new C=O band shows a small further increasing of this band for additional 50 min. However we could not clear approve this in the conversion plot in Fig. 4, because this calculation has an average error of ±3% and so the increasing up to 100% conversion is in the range of the error of the calculation.
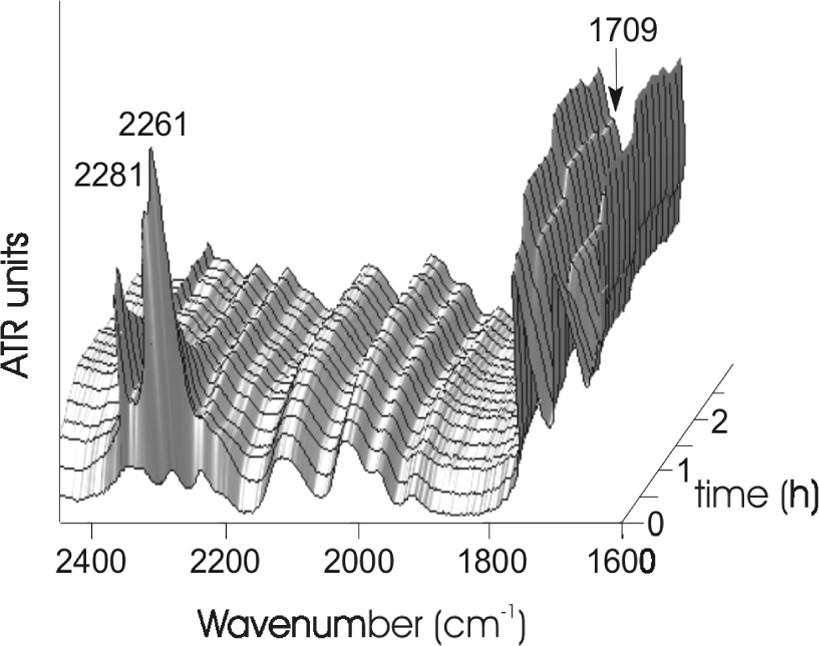
In situ ATR-IR spectra of the modification of hyperbranched poly(urea-urethane), time: 3 h.
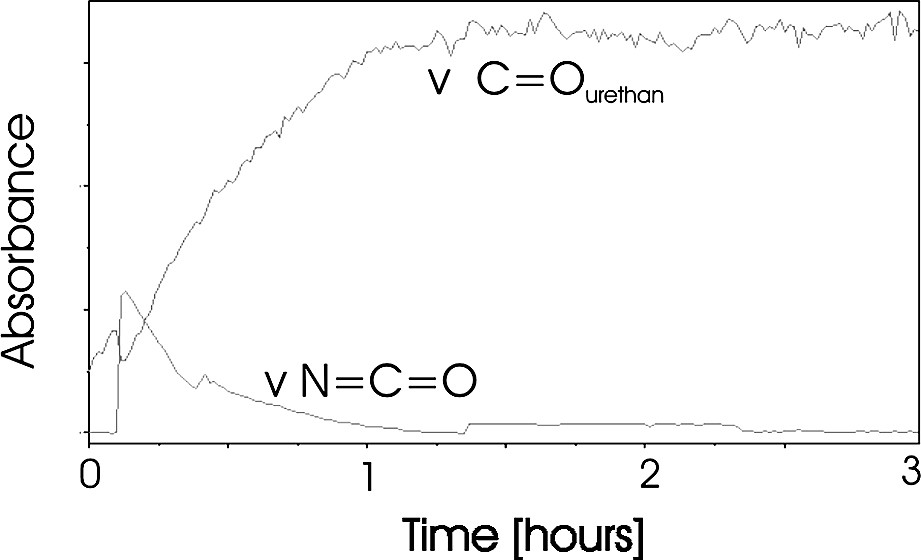
In situ conversion curve of the modification of hyperbranched poly(urea-urethane), calculated from the ATR-IR spectra.
4.2 In situ Raman spectroscopy of the formation of halogen-free amino-functionalized PMMA by ATRP
The in situ Raman spectra are shown in Fig. 5. The vinyl stretching at 1641 cm−1 is characteristic for the C=C bond of the monomer and decreases as a function of the monomer concentration. The 785 cm−1 peak is characteristic for the solvent anisole (CH bond of the aromatic ring) and is taken as inner standard for the quantification of the monomer consumption. The change of the intensity ratio between both bands and the residual MMA content with time is shown in Fig. 6. The change of the intensity ratio between both signals with time presents the conversion and is shown in Fig. 7.
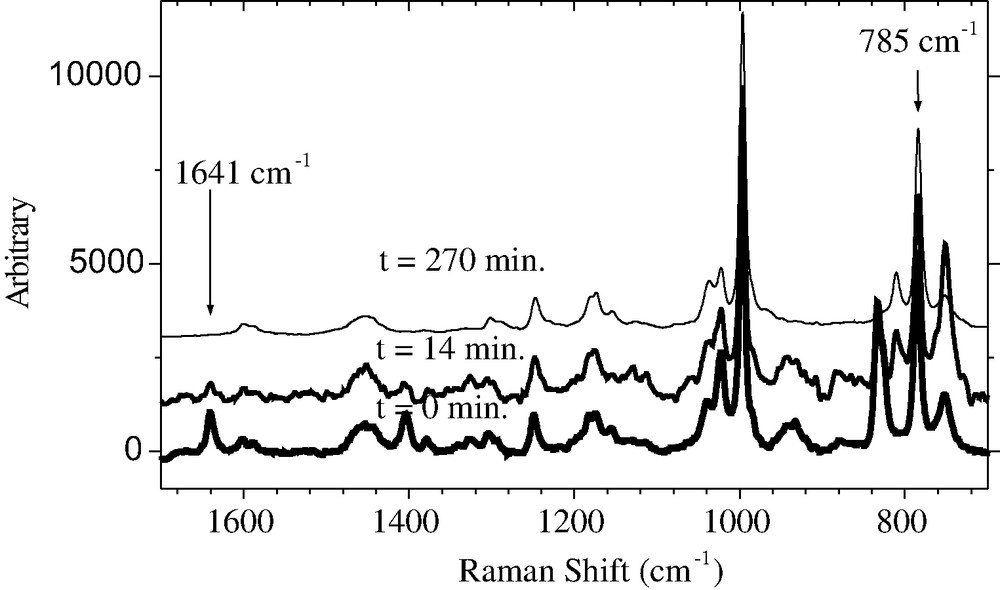
In situ Raman spectra of the ATRP of MMA in anisole at different times.
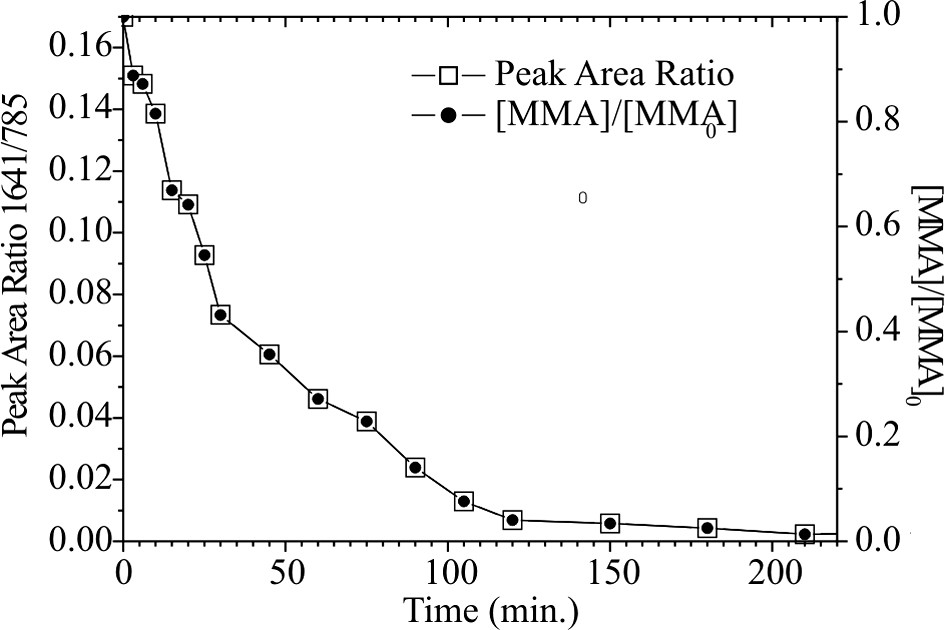
Time dependence of the band area ratio (A 1641 cm−1/A 785 cm−1) and the relative monomer content calculated of it.
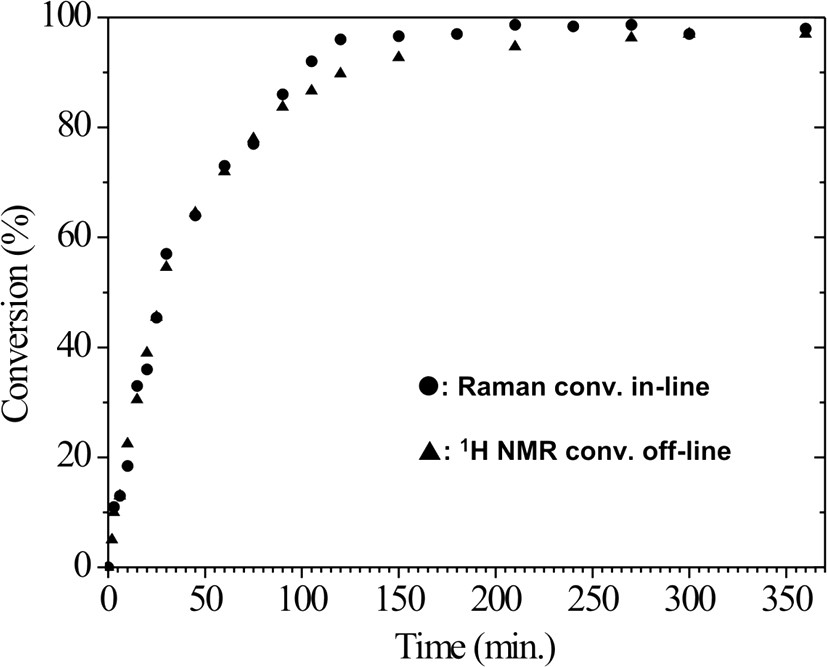
Comparison of the monomer conversion curves of MMA, calculated by in-line Raman and off-line NMR spectroscopy.
Off-line 1H NMR was also successfully used to determine the monomer conversion with time. The residual monomer content was determined by the integral peak intensity ratio between 5.56 and 1.2–0.7 ppm, which corresponds to olefinic protons of the monomer and methyl protons of the polymer, respectively. The results of both methods agree well (Fig. 7). The in-line Raman spectroscopy detects a thin layer (about 500 μm) direct on the surface of the probe. At high conversion rates the highly viscous material starts to stick at the probe, therefore it has to be cleaned from time to time. Furthermore, the accuracy may be reduced due to insufficient material exchange at the probe surface. Therefore, we evaluated the Raman spectra only up to a conversion of 98.5%.
4.3 Quantification of the flame retardant MC in PA 12 by NIR spectroscopy
PA is widely used in industry and for household products. It is flammable and so it is necessary to add a flame retardant. The content of MC varies between 5% and 16% according to application. All measured spectra for calibration and validation were in-line spectra during twin screw extrusion in real-time under the same processing conditions. We used for the calibration, carried out by chemometric methods, 21 different PA/MC mixtures (126 spectra, six for every mixture) and for an independent validation three mixtures. By using the PLS method from the software GRAMS32/PLSplus/IQ (Galactic) and three different data pretreatments (without pretreatment, multiplicative scattering correction (MSC), standard normal variation (SNV)) in the wavelength region from 1132 to 1622 nm (8830–6165 cm−1) the correlation coefficient R2 was for all three pretreatments better than 0.99 by using each with three main components in the PLS procedure. The standard error of cross validation (SECV) was equal for all three calibrations (0.06%). With these calibrations we could determine excellent real-time values for the three mixtures that were not included in the calibration with prediction errors clearly below 0.1%. All determined validation values are shown in Fig. 8.
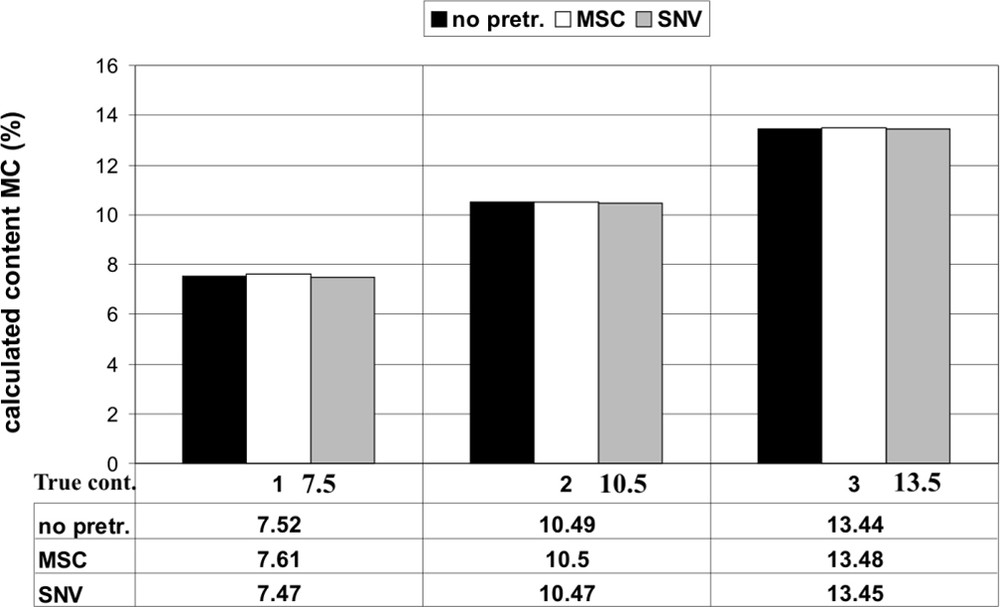
Determination of the content of the flame retardant MC in PA during extrusion (true values: 1: 7.5%, 2: 10.5%, 3: 13.5%) by three different data pretreatments.
4.4 Quantification of the composition of the blend PE/PS by NIR spectroscopy and ultrasonic measurements
The objective of this study was the application of NIR and ultrasonic spectroscopy to real-time monitoring of the composition of a PE/PS model blend during extrusion. Variations in the concentration ratio of these both polymers in the blend lead to a better impact strength of the blend. Therefore, it is desirable to monitor the contents of both polymers. The accuracy and reproducibility was explored by using chemometric methods, like describes above in Section 3.3.
By using the PLS method for the quantitative analysis we calculated with the NIR spectra in the wavelength region from 1132 to 1622 cm−1 a correlation coefficient R2 of 0.997 (six main components) and a standard error (SECV) of 0.97%. The validation with two mixtures (40% and 65%) has a prediction error of about 1% (Fig. 9).
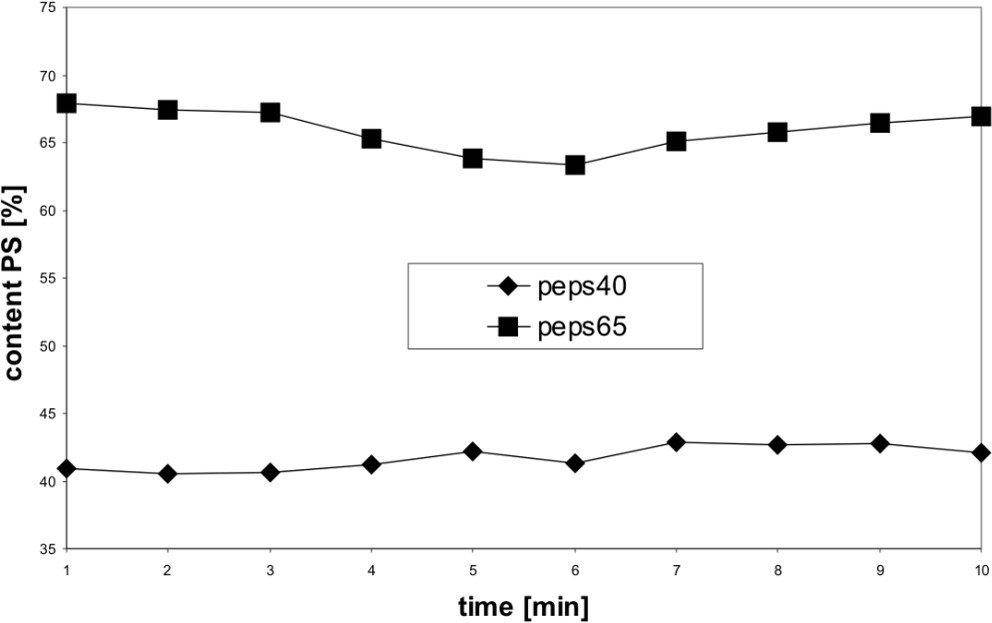
Determination of the content of PS in the polymer blend PP/PS by NIR spectroscopy.
The quantitative evaluation of the ultrasonic values result in a prediction error for the correlation of ultrasonic damping and concentration (% PS content) of 1.9% and for the correlation of ultrasonic velocity and concentration (% PS content) of 2.2%, shown in Fig. 10. It should be noted that the measured value for the ultrasonic velocity at 75% PS content is an outlier and so this measurement should not be considered. Furthermore we could find that the measured ultrasonic damping value for the pure PE is zero and so we have by adding 25% PS content a strong increasing. The same effect is in the pure PS ultrasonic velocity measurement and then the velocity is higher than in the mixtures. Strictly speaking we have linearity for the ultrasonic velocity measurements in the range from 0% to 75% PS content and for the ultrasonic damping measurements from 25% to 100% PS content.
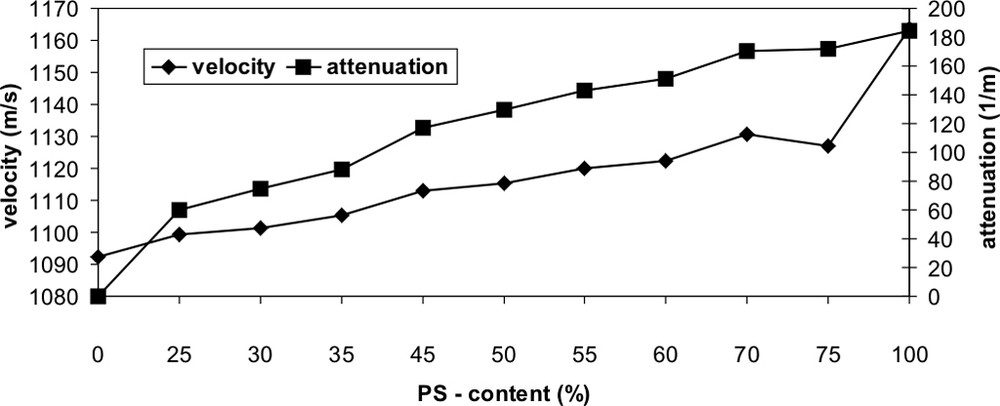
Determination of the content of PS in the polymer blend PP/PS by ultrasonic measurements.
5 Summary
Real-time monitoring of polymerization processes and mixing of polymers and additives is a smart method for both research and industrial process control. We demonstrated that ATR-IR, NIR and Raman in situ spectroscopy, and ultrasonic measurements are excellent monitoring methods for diverse processes.
Both ATR-IR and Raman spectroscopy have been utilized for the investigation of the modification of endgroups of hyperbranched polyurethanes and for the polymerization of MMA. In both processes we could determine the OH endgroup modification and the monomer conversion with time.
Furthermore we have demonstrated that NIR spectroscopy is a powerful method for process analysis; especially for monitoring polymer melt mixtures in extrusion processes.
Quantitative analysis carried out with chemometric methods can determine the composition of multicomponent polymer mixtures and predict real world samples in real-time during extrusion. An additional alternative, robust and cheap method for process analysis can be in the future the in-line ultrasonic method.