1 Introduction
The formation of thin films with desirable properties can result from the self-assembly of single molecules into highly ordered monolayers. The stability of these systems often depends on the strength of the interactions between the deposited molecule or adsorbate and the surface. Recently, a large number of systems of this type have been developed by self-assembly of sulfur adsorbates on gold surfaces, mostly involving organic molecules [1–4]. The self-assembly of organometallic compounds is rarer and could allow new applications, in the fields of nanoelectronics, molecular sensors or catalysis [5–12]. It is well established in the literature that thiols [1,4,13], disulfides [1,14–25], thioethers [1,26–41], dithiocarbamates [8,42], thiocarbaminates [43], thioureas [44], xanthates [45], thiophenes [10] and, more recently, thiocyanates [46,47] can interact with gold covered surfaces and lead to highly ordered monolayers. The reactivity of these sulfur-containing groups depends on their nature, the thiol groups being the most reactive. Among the different procedures described to generate self-assembled monolayers (SAMs) on gold [1,4], the most common is the immersion of a freshly prepared or clean substrate into a dilute solution of the sulfur-containing substrate [1]. We will focus our study on this immersion method, and in addition use the spin coating method of the sulfur-containing species onto a gold surface. This will allow us to compare these two methods and we will see that the spin coating process does not allow an efficient attachment of the sulfur-containing species onto the surface, contrary to the immersion procedure.
The synthesis and study of organometallic mixed-metal complexes and clusters have been largely developed over the last 30 years [48] and these compounds are attractive “single source precursors” in material sciences [49,50]. Some of us reported the first use of heterometallic molecular clusters as precursors to catalytic nanoparticles which were shown to possess improved properties compared to monometallic nanoparticles [51,52]. It was also found that the impregnation of a mesoporous xerogel or of an organized porous material such as MCM-41 with an organic solution of the heterometallic cluster [NEt4][Co3Ru(CO)12], followed by thermal treatment under an inert atmosphere, led to highly dispersed magnetic nanoparticles under milder conditions than when conventional metal salts are used as precursors [53]. High-quality Co2P nanoparticles have been obtained from diphosphine-substituted tetracobalt carbonyl clusters anchored into an SBA-15 matrix [54]. We have also studied the formation of thin films from Fe–Mo–S molecular precursors having different intermetallic ratios [55]. The anchoring by physisorption of such molecular precursors onto mesoporous matrices (MCM 41, SBA 15…) or the formation of thin films by vaporisation methods (chemical vapor deposition CVD) does not require the presence of functional groups in the complex able to interact with the substrate. However, functionalization of the complex is a way to secure their fixation or chemisorption on a surface or a matrix, and the interactions generated by the chemical reaction between the complex and the substrate stabilizes the whole structure [56].
The centrosymmetric cluster [Mo2Pd2(η5-C5H5)2(CO)6(PR3)2] (1) (1a, R = Et; 1b, R = Ph), synthesized in our laboratory almost thirty years ago [57,58], was the first mixed-metal cluster used to form catalytic nanoparticles and these were found to have better performance than conventional catalysts in the carbonylation reaction of organic nitroaromatics in the corresponding isocyanates [51].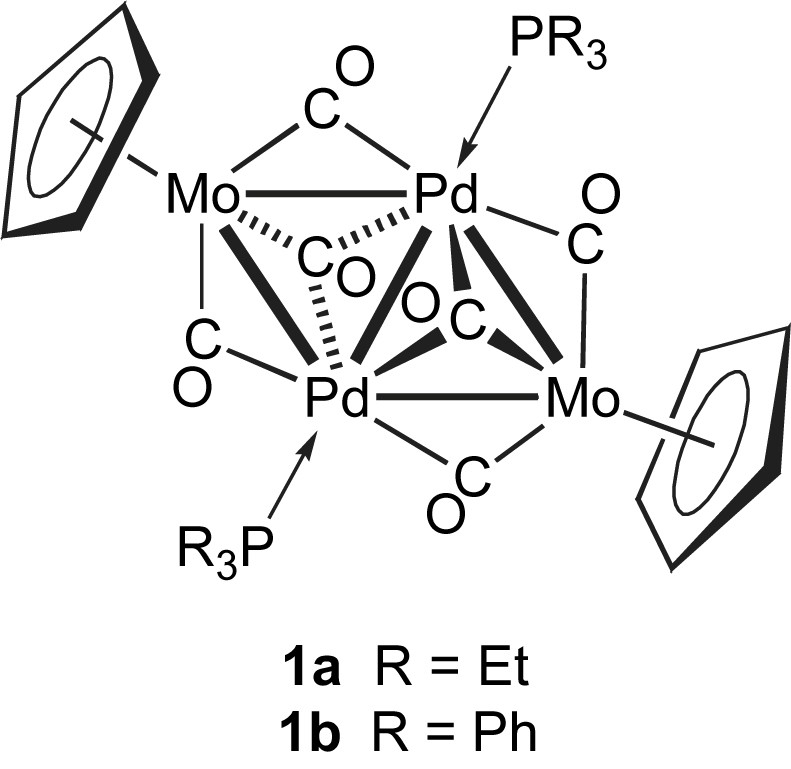
Then, the Ford Motor Company studied Mo–Pd and Mo–Pt bimetallic catalysts for abatement of automobile emissions: Kawi et al. adsorbed 1b on an MgO powder and after two successive heat treatments under hydrogen at 400 °C and 500 °C, they found that a bilayered compound was produced at the surface of the MgO support which consisted of molybdenum cations interacting with the support and providing a platform for highly dispersed palladium [59]. It was recently found that impregnation of solutions of clusters 1a or 1b into amorphous xerogels or ordered SBA-15, followed by their thermal decomposition under a reducing atmosphere, resulted in the formation of nanoparticles of a new bimetallic phosphide of composition PdxMoyP, isostructural with Mo3P, but lacunar, which were more uniformly distributed in the SBA-15 framework [60]. It is also interesting to note that the analogous platinum cluster [Pt2Mo2(η5-C5H5)2(μ3-CO)2(μ2-CO)4(PPh3)2] [61] has been used as a precursor to zirconium-doped mesoporous silica supported bimetallic catalysts for the hydrogenation of tetralin [62].
We set out in the present work to use functional derivatives of cluster 1a and of the two trinuclear, linear chain complexes trans-[Pt{Mo(η5-C5H5)(CO)3}2(CNt-Bu)2] (2) [63] and trans-[Pt{Mo(η5-C5H5)(CO)3}2(NCPh)2] (3) [61] which would contain a thioether group in order to generate heterometallic monolayers on gold surfaces by self-assembly and to reveal their properties by XPS.
Since the synthesis of these heterometallic complexes requires multiple reaction steps, we decided to functionalize the cyclopentadienyl group with a dialkyl sulfide (or thioether) group instead of a too reactive thiol. We will first describe the synthesis of the thioether-functionalized complexes and clusters and then describe the deposition processes and analysis by different methods (ellipsometry, scanning tunneling microscopy and XPS) of the thickness, topography and composition of the resulting monolayers.
2 Results and discussion
2.1 Synthesis and characterization of the heterometallic complexes
The aim of the synthetic work was to obtain derivatives of 1a, 2 and 3 containing a dialkyl sulfide pendant function. Since the organometallic building block common to these three compounds is the metallate [Mo(η5-C5H5)(CO)3]−, it appeared a good strategy to first functionalize the cyclopentadienyl ring of this fragment and synthesize the new metalate Li[Mo(η5-C5H4CH2CH2SCH2CH3)(CO)3]·2DME (4). The syntheses of the desired heterometallic complexes were performed by reactions between 4 and palladium(I) or platinum(II) precursor complexes.
2.1.1 Synthesis of the thioether-functionalized tricarbonylmolybdate Li[Mo(η5-C5H4CH2CH2SCH2CH3)(CO)3]·2DME (4)
The new complex 4 was prepared by reaction of the anion Li(C5H4CH2CH2SCH2CH3), whose synthesis is described in the literature [64], with [Mo(CO)6] in refluxing DME, using a procedure similar to that reported for Na[Mo(η5-C5H5)(CO)3]·2DME [65].
Complex 4 was obtained in 91% yield and characterized by 1H NMR and infrared spectroscopy (ν(CO) = 1899, 1793 and 1732 cm−1).
2.1.2 Synthesis of the palladium–molybdenum cluster [Mo2Pd2(η5-C5H4CH2 CH2SCH2CH3)2(CO)6(PEt3)2] (5)
Complex 4 was reacted with the metal–metal bonded complex [Pd2(NCMe)6](BF4)2 and 2 equiv. PEt3 in THF at −78 °C. After chromatography on a silica column, the violet cluster 5 was obtained in 79% yield and characterized by X-ray diffraction. It was shown to adopt a planar, triangulated centrosymmetric structure analogous to that of cluster 1 [57].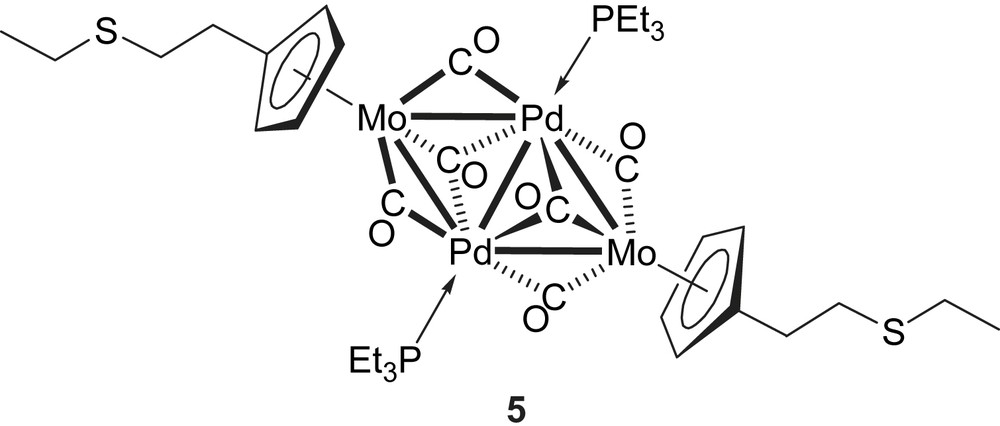
An ORTEP view of the crystal structure 5 is shown in Fig. 1 with the main distances and angles. The Pd–Mo distances are almost equal (Pd–Mo 2.860(2) Å and Pd′–Mo 2.806(2) Å) and longer than the Pd–Pd′ distance (Pd–Pd′ 2.598(2) Å). These distances, and other bonding parameters, are similar to those observed in analogous Mo2Pd2 clusters and are therefore not discussed further [57,66,67].
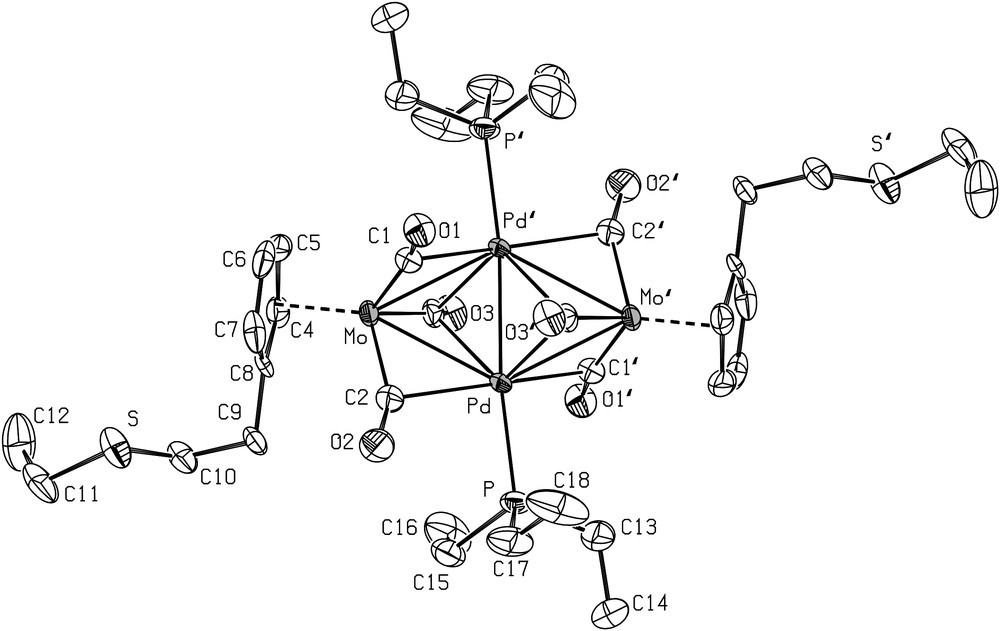
ORTEP view of the structure 5 with the atom-numbering scheme. Thermal ellipsoids enclose 50% of the electron density. H atoms omitted for clarity. Selected bond distances (Å) and angles (°): Pd–Pd′ 2.598(2), Pd′–Mo 2.806(2), Pd–Mo 2.860(2), Pd–P 2.319(3), Pd′–C(1) 2.409(9), Pd–C(2) 2.348(9), Pd′–C(3) 2.317(9), Pd–C(3) 2.515(9), Mo–C(1) 1.983(9), Mo–C(2) 1.973(9), Mo–C(3) 2.030(9), C(1)–O(1) 1.16(1), C(2)–O(2) 1.17(2), C(3)–O(3) 1.17(1); Pd–Pd′–Mo 63.78(5), Mo–Pd–Mo′ 125.43(5), Pd′–Pd–Mo 61.65(5), Pd–Mo–Pd′ 54.57(5), Pd′–Pd–P 173.29(7), Mo–C(1)–O(1) 166.9(7), Mo–C(2)–O(2) 155.2(8), Mo–C(3)–O(3) 159.4(7), Pd′–C(1)–O(1) 114.1(6), Pd–C(2)–O(2) 122.4(7), Pd′–C(3)–O(3) 116.6(3), Pd–C(3)–O(3) 119.8(6). Symmetry operator for equivalent positions: a = 1−x, −y, 1−z.
2.1.3 Synthesis of the platinum–molybdenum complexes trans-[Pt{Mo(η5-C5H4CH2CH2SCH2CH3)(CO)3}2(CNt-Bu)2] (6) and trans-[Pt{Mo(η5-C5H4CH2CH2SCH2CH3)(CO)3}2(NCPh)2] (7)
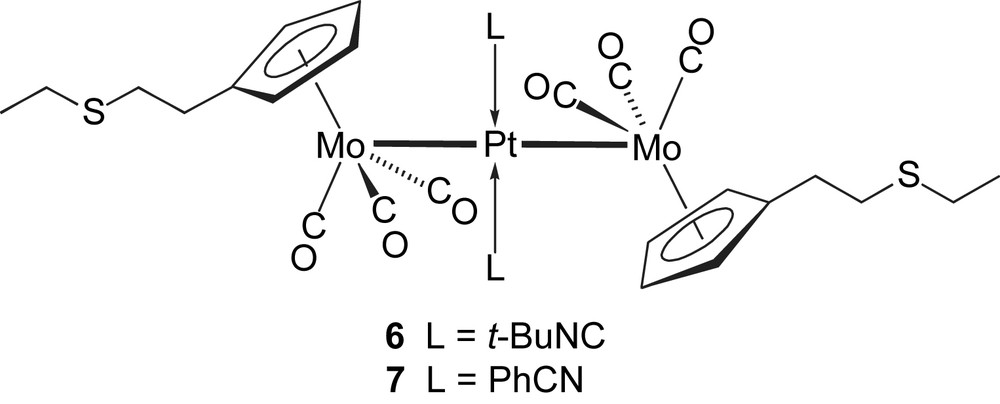
Following the procedure used for the preparation of the analogous complexes trans-[Pt{Mo(η5-C5H5)(CO)3}2(CNt-Bu)2] (2) [63] and trans-[Pt{Mo(η5-C5H5)(CO)3}2(NCPh)2] (3) [61] containing the η5-C5H5 ligand, addition of the isonitrile complex trans-[PtCl2(CNt-Bu)2] or of the nitrile complex trans-[PtCl2(NCPh)2] to a THF solution of 4 afforded the orange complexes 6 and 7, respectively. They were characterized by X-ray diffraction and views of their crystal structures are shown in Figs. 2 and 3, respectively, together with the main distances and angles. The geometries of both molecules are very similar, with the platinum atom lying on an inversion centre.
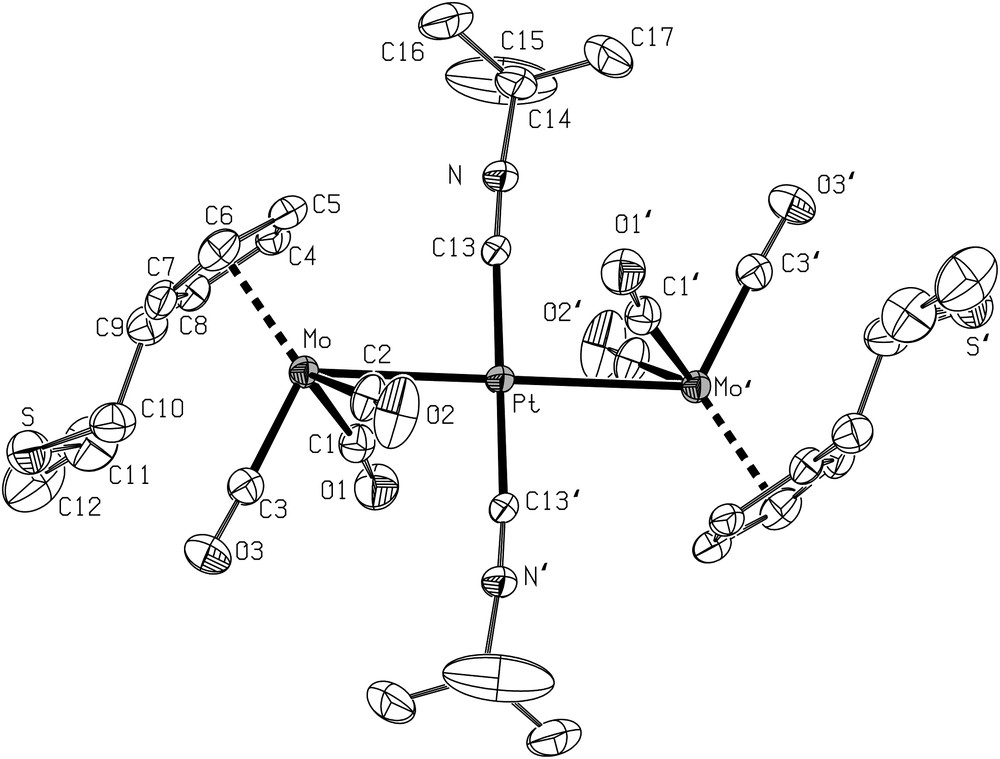
ORTEP view of the structure 6 with the atom-numbering scheme. Displacement ellipsoids enclose 50% of the electron density. H atoms omitted for clarity. Selected bond distances (Å) and angles (°): Pt–Mo 2.8888(5), Mo–C(1) 1.963(5), MoC(2) 1.979(6), Mo–C(3) 1.930(5), Pt–C(13) 1.964(5), C(1)–O(1) 1.171(6), C(2)–O(2) 1.151(6), C(3)–O(3) 1.166(6); Mo–C(1)–O(1) 170.8(4), Mo–C(2)–O(2) 172.7(5), Mo–C(3)–O(3) 177.8(5), Mo–Pt–C(13) 87.2(2), Mo–Pt–C(13)′ 92.8(2), Pt–Mo–C(1) 62.4(2), C(1)–Mo–C(2) 110.3(2), C(1)–Mo–C(3) 82.4(2), C(2)–Mo–C(3) 82.2(2), C(2)–Mo–Pt 64.6(2). Symmetry operator for equivalent positions: a = 1−x, 1−y, −z.
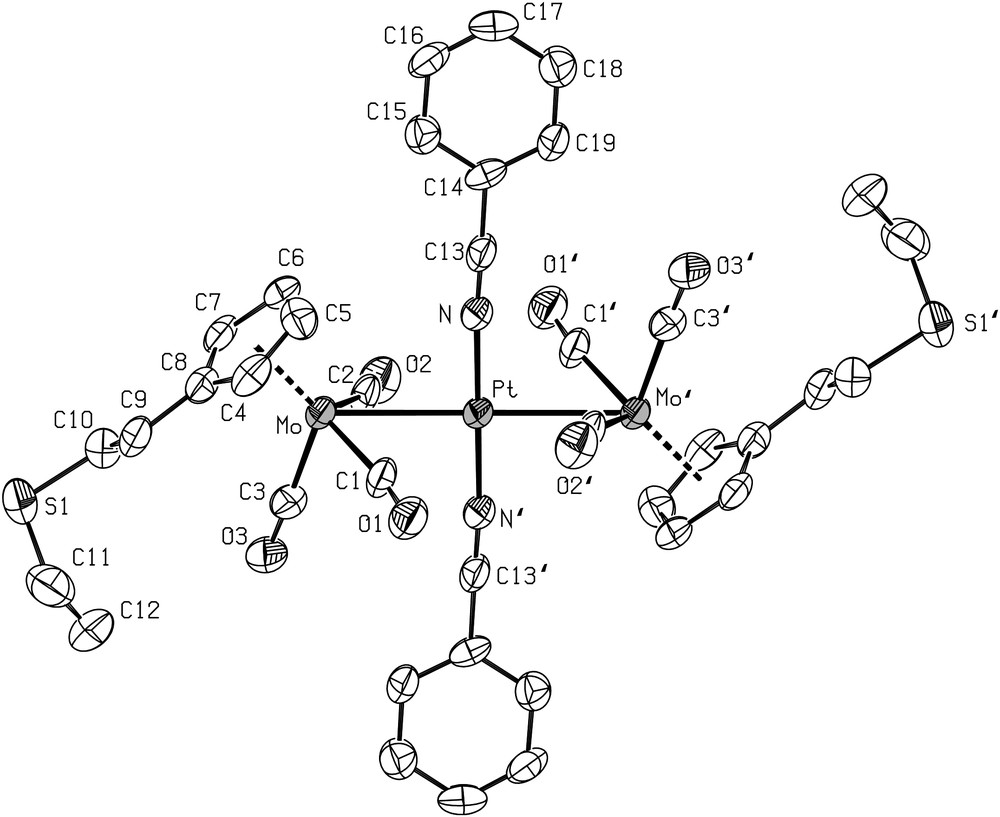
ORTEP view of the structure of 7 with the atom-numbering scheme. Displacement ellipsoids enclose 50% of the electron density. H atoms omitted for clarity. Selected bond distances (Å) and angles (°): Pt–Mo 2.879(1), Pt–N(1) 1.94(1), Mo–C(1) 1.97(2), Mo–C(2) 1.96(2), Mo–C(3) 1.94(2), C(1)–O(1) 1.15(2), C(2)–O(2) 1.16(2), C(3)–O(3) 1.16(2); Mo–C(1)–O(1) 171(2), Mo–C(2)–O(2) 169(2), Mo–C(3)–O(3) 178(2), Mo–Pt–N(1)′ 92.6(3), Mo–Pt–N(1) 87.4(3), Pt–Mo–C(1) 59.8(4), C(1)–Mo–C(2) 112.3(5), C(1)–Mo–C(3) 85.6(5), C(2)–Mo–C(3) 82.3(5), C(2)–Mo–Pt 60.1(4). Symmetry operator for equivalent positions: a = −x, 1−y, 1−z.
The Mo–Pt distances in the trinuclear metal chain are comparable in both compounds (2.8888(5) Å in 6 and 2.879(1) Å in 7). The structures of these complexes are very similar to those of the linear chain complexes trans-[Pt{Mo(η5-C5H4NMe2)(CO)3}2(CNt-Bu)2] (Mo–Pt–Mo) [68] and trans-[Pt{Mo(η5-C5H4NMe2)(CO)3}2(NCPh)2] (Mo–Pt–Mo) [68] in which the cyclopentadienyl was functionalized with a dimethylamino group.
From the reaction leading to 7, the red complex (8) was isolated from the fraction soluble in toluene. An improved synthesis of 8 is presented in Section 4.
A view of the crystal structure of 8 is shown in Fig. 4 together with the main distances and angles. The sulfur atom in 8 coordinates the molybdenum as a result of substitution of a carbonyl group and the chloride present in the molecule originates from the platinum precursor trans-[PtCl2(NCPh)2] since no chlorinated solvent was used. The two remaining carbonyls are in a cis position and complete the four legged piano stool environment around the molybdenum.
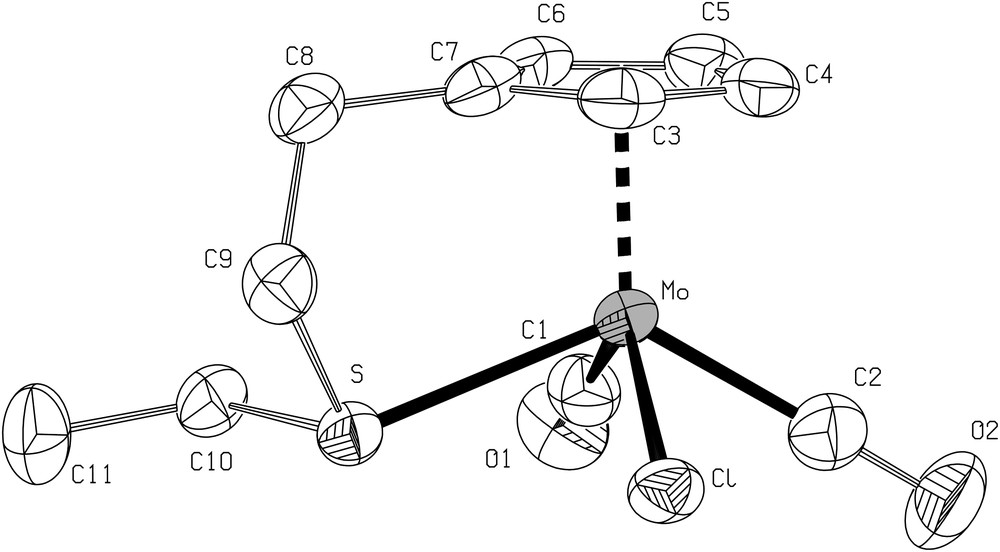
ORTEP view of the structure 8 with the atom-numbering scheme. Displacement ellipsoids enclose 50% of the electron density. H atoms omitted for clarity. Selected bond distances (Å) and angles (°): Mo–S 2.507(2), Mo–C(1) 1.952(5), Mo–C(2) 1.968(6), Mo–Cl 2.515(2), C(1)–O(1) 1.154(6), C(2)–O(2) 1.161(7); C(1)–Mo–C(2) 76.8(2), C(1)–Mo–S 83.9(2), C(2)–Mo–Cl 79.7(2), S–Mo–Cl 75.80(4).
2.2 Preparation of the samples and analyses of the resulting layers
All the physical method-based calculations concerning the surface coverage, the thickness of the films, the ratios between bound and unbound sulfurs and the disposition of the atoms are based on standard techniques and routines not detailed here.
2.2.1 Spin coating experiments with cluster 5
The preparation of the gold substrates is detailed in Section 4. Various spin coating experiments have been performed with different concentrations and gold surfaces.
2.2.1.1 First spin coating experiment
The gold surface (gold sputtered on highly oriented pyrolytic graphite) was first analysed by ellipsometry and revealed a refraction index of 0.3934 and a thickness of ∼48 nm, i.e., for an experimental technique with high surface sensitivity, such as photoelectron spectroscopy, the film thickness is equivalent to infinity. The solution used for coating contained 2 mg (1.8 × 10⁻⁶ mol) of 5 (0.90 mM) dissolved in 2 mL of freshly distilled toluene. The violet solution was spin coated at 5450 rpm (rotation per minute). The surface was not washed with toluene after the spin coating experiment. Ellipsometric measurements revealed a thickness of 5 nm and a refraction index of 1.7234 for the obtained layer. STM experiments were performed before (Fig. 5a) and after spin coating (Fig. 5b). After the spin coating the STM pictures of the sample showed the presence of spherical particles of the deposited cluster 5 with diameters ranging from 1 to 5 nm. (Fig. 5b-1 and b-2).
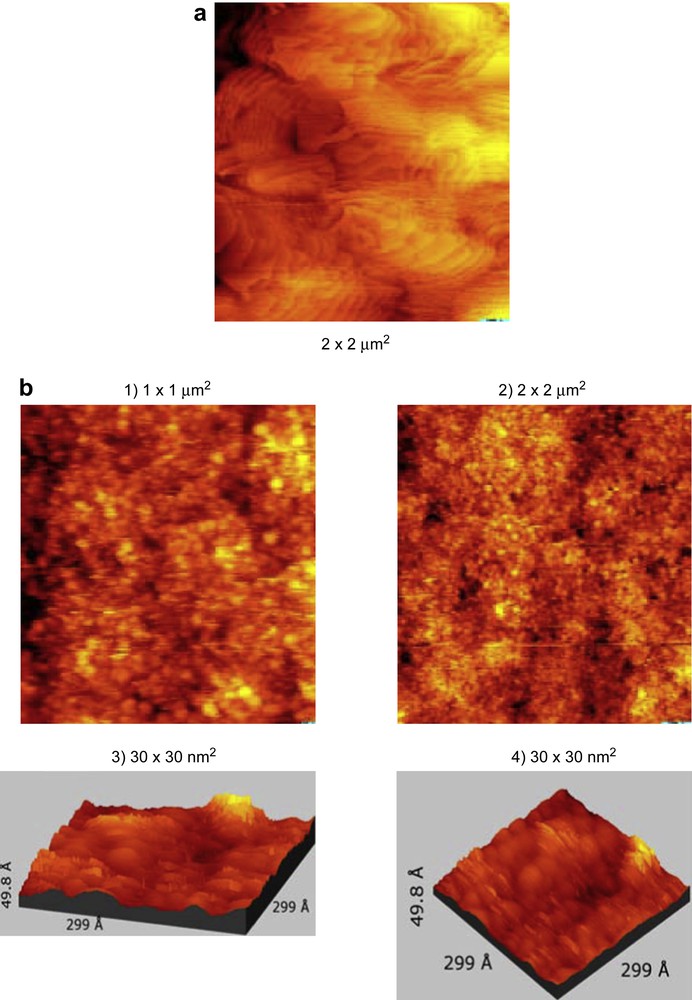
(a) STM picture of the gold surface before spin coating. (b) STM of the spin coated sample from Section 2.2.1.1 prepared from 5.
2.2.1.2 Second spin coating experiment
A violet solution containing 7 mg (6.27 × 10⁻⁶ mol) of 5 (6.27 mM) dissolved in 1 mL of freshly distilled toluene was spin coated on a gold surface similar to that used in Section 2.2.1.1 at 4700 rpm. The surface was not washed after the spin coating. Ellipsometric measurements revealed a thickness of 8 nm.
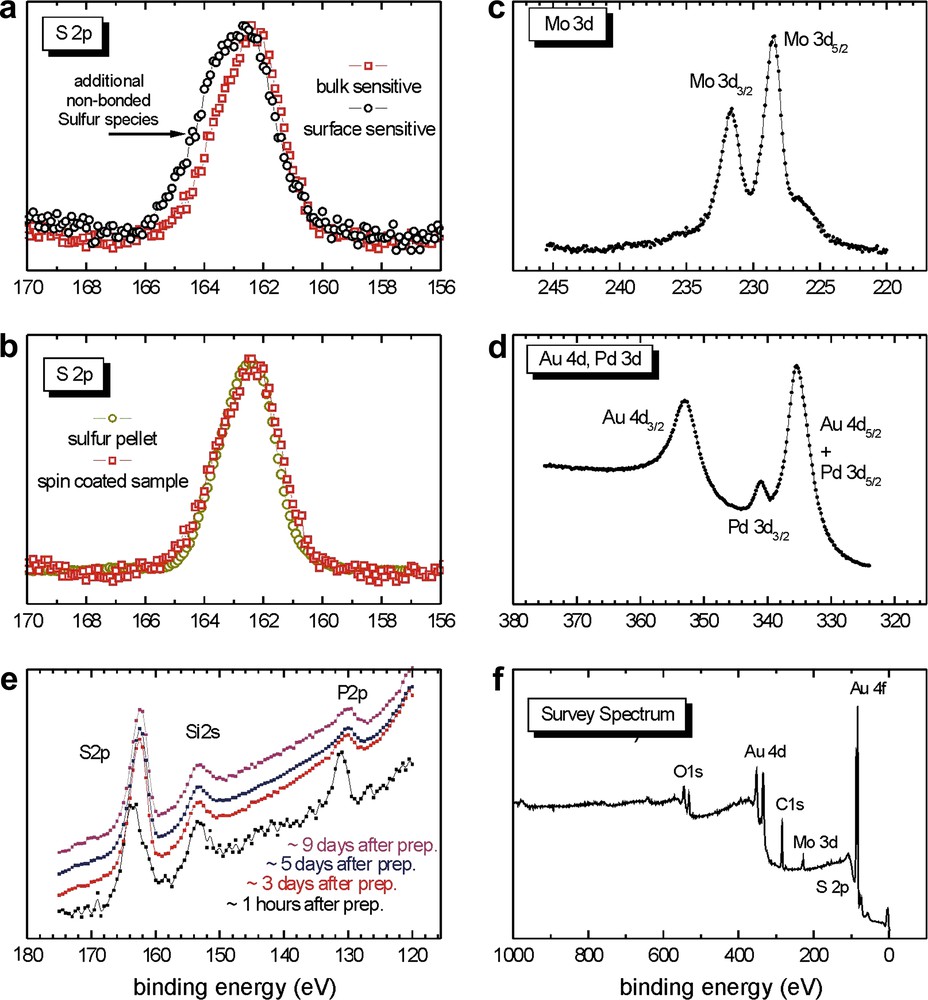
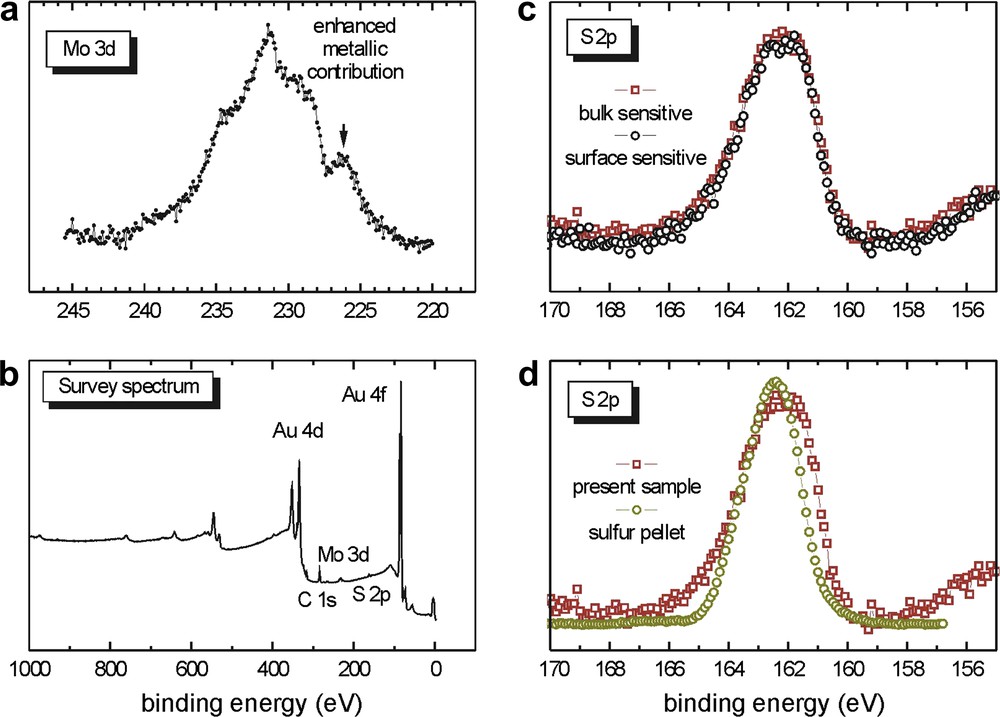
The XPS data are presented in Fig. 6 and the different curves represent the evolution of the spectra with increasing temperature (for temperatures, refer to the survey spectrum, Fig. 6e). As a reference, the black curve on the survey spectrum represents the gold surface before spin coating. All the chemical elements contained in 5 are present on the surface after the spin coating deposition. For sulfur (Fig. 6b), the signal corresponding to the binding energy of the S 2p electrons at 162.2 eV is very narrow and indicates a single environment for the sulfur atoms. At this stage, we suppose that we have only unbound sulfur and this will be confirmed later (see below). According to the binding energy (162.2 eV), it seems that the cluster molecules are just deposited on the surface but have not reacted with it. The spin coating process thus appears to be too rapid to allow a reaction between the dialkyl sulfide group and the gold surface. The Mo 3d signal (Fig. 6a) exhibits a distinct doublet structure and is consistent with a unique environment of the molybdenum atoms on the surface. With increasing temperature, the intensity of the Pd (Fig. 6c and d) and P signals decreases (the latter is not shown in detail, but the decrease of the intensity of the P signal can also be extracted from the survey spectra).
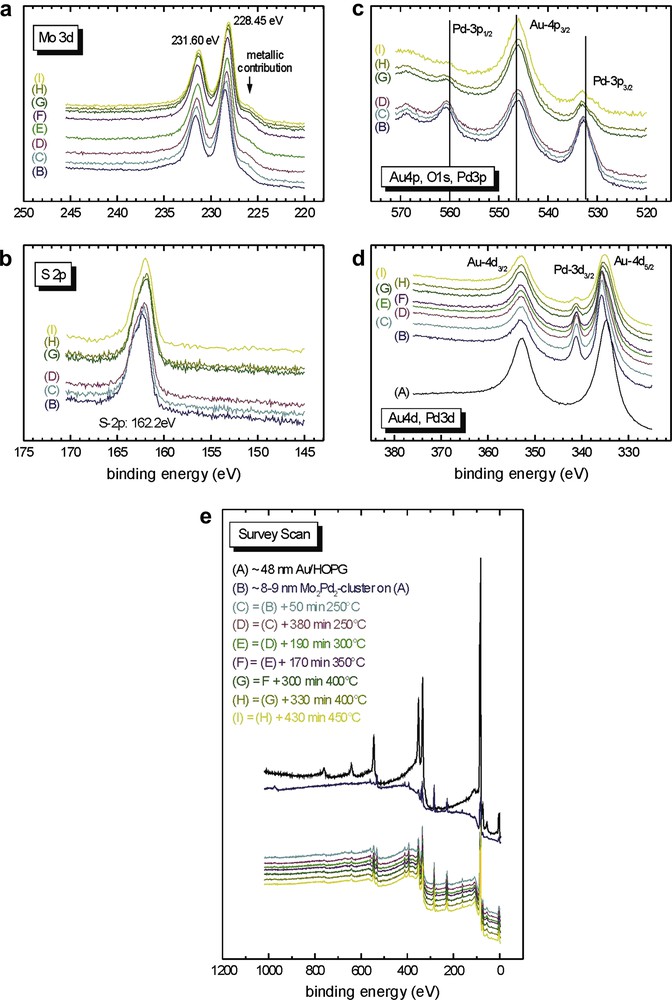
XPS data of the spin coated sample from Section 2.2.1.2 for an 8 nm thick film of Mo2Pd2 clusters on 48 nm Au (this value was obtained from the ellipsommetry measurement).
2.2.1.3 Third spin coating experiment
A violet solution containing 1 mg (9 × 10⁻⁷ mol) of 5 (6.40 mM) dissolved in 0.14 mL of freshly distilled toluene was spin coated at 4700 rpm on a gold surface different to those used in Sections 2.2.1.1 and 2.2.1.2 (gold sputtered on stainless steel).
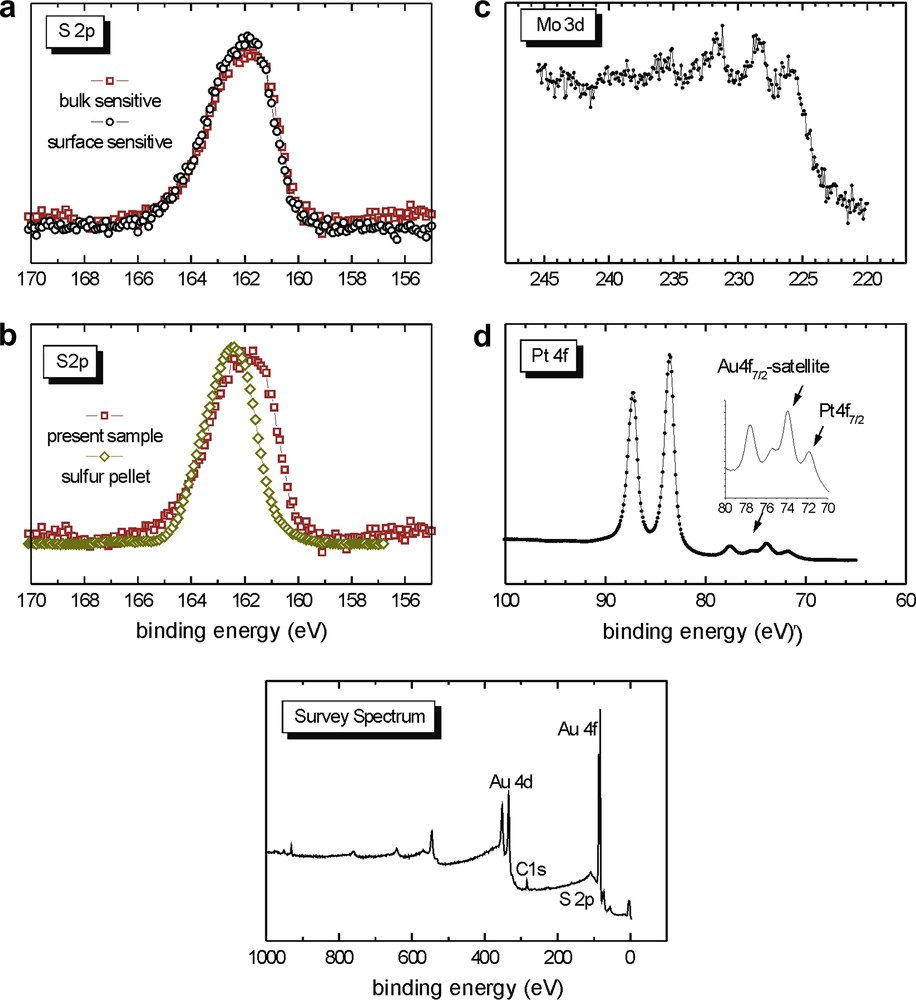
The observations are similar to those made in the previous spin coating experiment (Section 2.2.1.2). The cluster does not seem to react with the gold surface, it is just deposited on it and the S 2p line width predicts the presence of only one species. According to the binding energy, this species represents unbound sulfur (see Fig. 7a and b). For comparison, a sulfur pellet (with a single sulfur environment) was measured by XPS, providing an S 2p signal as broad as the S 2p signal observed in Fig. 7b, confirming a single environment of the sulfur atoms for the present sample (for the sulfur pellet, the binding energy of the corresponding S 2p spectrum is shifted arbitrarily in order to show that both S 2p spectra exhibit nearly the same line shape and line width). However, in this case, we observe an additional non-bonded sulfur species at higher binding energies (see Fig. 7a). This contribution is probably attributed to another component of unbound sulfur, namely at the surface of the layer, because this component is not visible in the S 2p signal of the bulk material. This additional component may be related to chemical shift throughout the thickness of the film (ca. 6 nm in this case, measured by ellipsometry). Furthermore, it was observed that the intensity of the P 2p signal (Fig. 7e) decreases with respect to the measurement time. This phenomenon could be related to a decomposition of the cluster by cleavage of the Pd–P bond, probably caused by the X-ray beam (radiation damage). The most spectacular P 2p intensity differences are observed between the spectra recorded after 1 h (Fig. 7e, black curve) and after 3 days (Fig. 7e, red curve1). After three days, the P 2p signal does not decrease anymore. The P 2p signal was not recorded in the previous spin coating experiment and this observation can therefore not be compared with the Section 2.2.1.2 case. In Fig. 7e, there is also an Si 2s signal probably caused by contaminations from the presence of silicon grease in the sample. Contrary to the P 2p signals, the S 2p intensity does not change as a function of the measurement time.
In conclusion, the spin coating experiments provide evidence that there is no reaction between cluster 5 and the gold surface, probably because the contact time between them is too short to give rise to Au–S bonding. Nevertheless, these experiments indicate the sulfur electron binding energies and the line shape of the non-attached cluster as references and these data will provide useful comparisons between bound and unbound sulfurs for the experiments discussed below. In the following, an alternative procedure was used to allow the reaction between the cluster and the surface to take place by increasing the contact time: the immersion of the gold surface into a solution of the heterometallic complex.
2.2.2 Immersion of gold surfaces into solutions of cluster 5
For all these samples, ellipsometric measurements were performed on the immersed samples. The thickness of the films was not easy to determine exactly and was approximately 0.5 nm.
2.2.2.1 First immersion experiment with 5
20 mg (1.8 × 10⁻⁵ mol) of 5 (0.60 mM solution) were dissolved in 30 mL of CH2Cl2. The film was prepared by immersion of the gold foil into the solution. After 18 h of immersion at room temperature, the sample was taken out of the solution, washed abundantly with CH2Cl2 (20 mL) and dried with a nitrogen stream. The surface was kept under nitrogen before it was inserted into the XPS instrument.
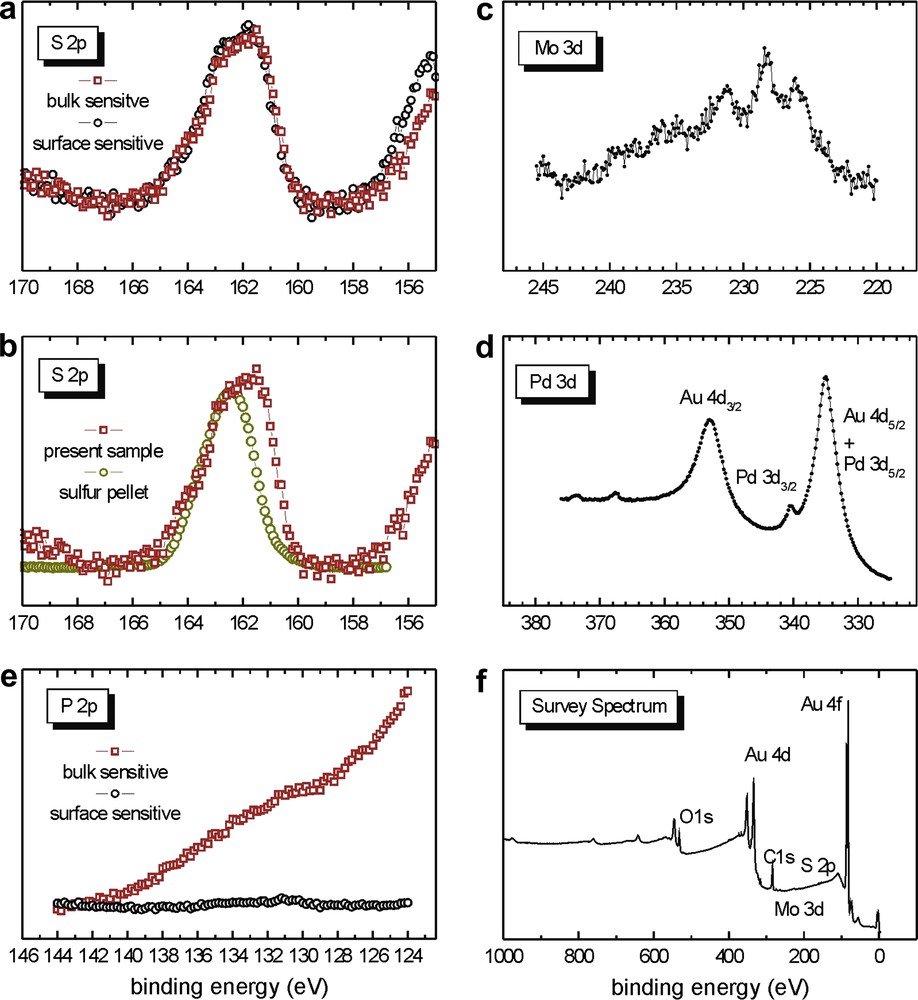
The S 2p line widths (Fig. 8a and b) are very different from those observed for the spin coated samples. The signal is broader than in the case of the spin coated samples and therefore, the presence of two sulfur species can be expected: the contribution at higher binding energy indicates the presence of unbound sulfur while the additional contribution at lower binding energy corresponds to the presence of bound sulfur. For thiols and dialkylsulfides, it is well known that adsorption on gold results in a positive shift of about 1.5 eV for the XPS signal of the S 2p electrons [69], as schematically shown in Fig. 9. The lower binding energies observed are therefore consistent with bound sulfur atoms on the surface. The immersion time of 18 h seems to be sufficient to allow the reaction between cluster 5 and the surface to take place. However, the calculated surface coverage by the cluster is around 45% and could perhaps be increased by increasing the immersion time. Unbound sulfur atoms are still observed in this sample but they are fewer when compared to the bound sulfur. The enhanced width of the S 2p signal simply results from the superposition of the bound and unbound S species (Fig. 9).
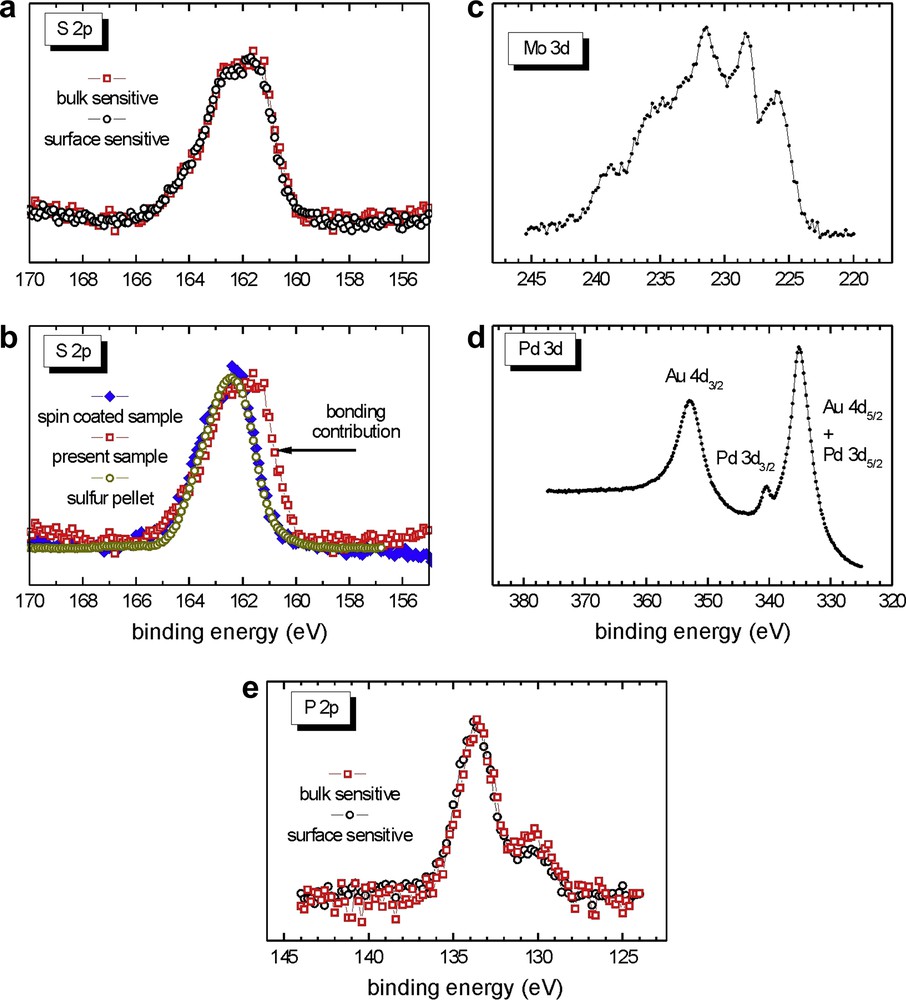
XPS data of the immersion coated sample from Section 2.2.2.1 prepared from 5.
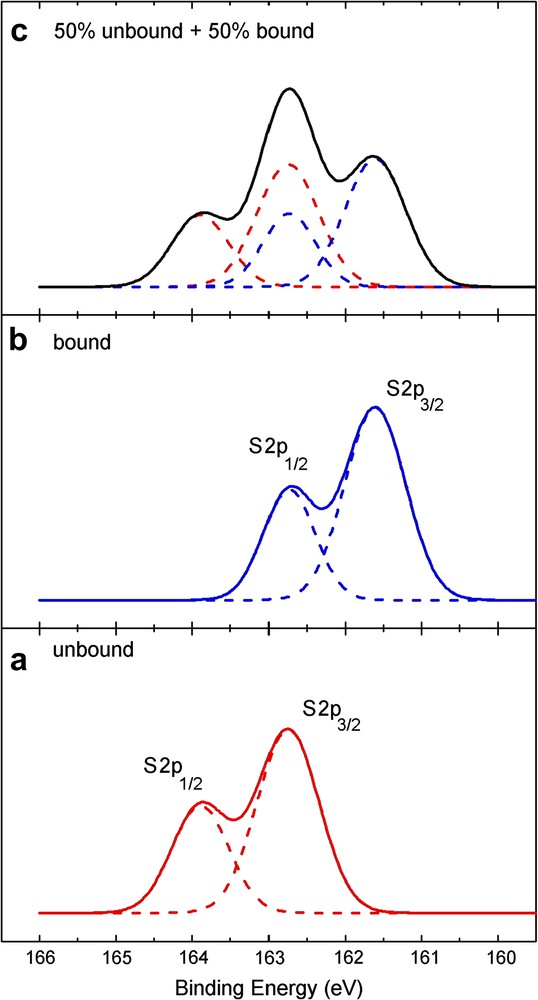
XPS-(S2p) signal of a monolayer of an adsorbate with multiple attachment points using about 3 or 5 sulfur units. (a) Theoretical XPS S 2p doublet for unbound sulfur; (b) Theoretical XPS S 2p doublet for bound sulfur; (c) Resulting XPS S 2p signal from a 1: 1 superposition of (a) and (b), according to Ref. [69]. Note that the resolution of this simulation is twice as high as that of the experimental data presented in this study.
From the analysis of the bulk and surface sensitive XPS data, it is evident that all sulfur atoms of the sample are located in the same plane, parallel to the gold surface. When the detection angle between the photoelectrons and the surface normal is changed from 0° (Fig. 8a, red curve1: bulk sensitive) to 75° (Fig. 8a, black curve: surface sensitive case), the line shape remains exactly the same, which indicates that the ratio between bound and unbound sulfur does not vary. Since both S contributions are affected in the same way by changing the surface/bulk sensitivity of the experiment, both S species should not differ in their z-coordinate along the surface normal. Otherwise, with increasing the surface intensity of the experiment, the intensity contributions for the species located closer to the interface/surface would decrease/increase, respectively. This phenomenon is also observed for phosphorus (Fig. 8e). Calculations reveal that the plane containing the sulfur atoms lies between the gold surface and the plane containing the phosphorus atoms. This could indicate a well ordered disposition of the clusters on the surface. In Fig. 10, we propose a tentative, simplified representation of the cluster monolayer (the values are given in units of the electron mean free path λ that is typically in the range of 1 nm for the kinetic energies used in the experiment).
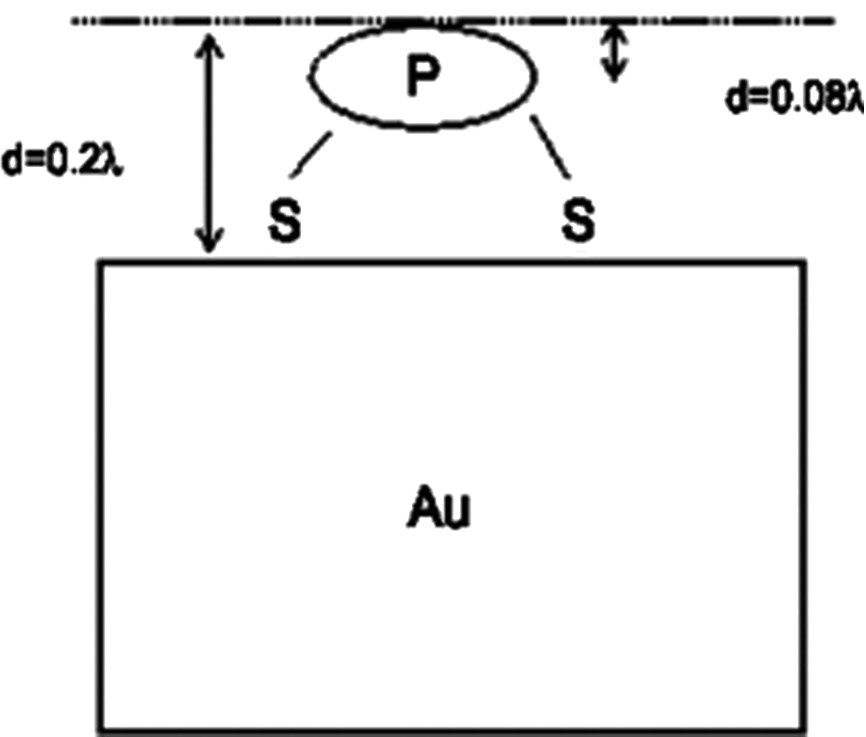
Tentative, simplified representation of the cluster position on the surface.
The molybdenum signal is very broad and not as well defined as in the spin coating cases (Fig. 8c). In Fig. 8d, the Pd 3d3/2 binding energies are visible and confirm the presence of the cluster on the gold surface. However, the Pd 3d3/2 signals are very small compared to the Au 4d5/2. Apart from the slightly smaller cross-section of the Pd 3d electrons, the larger Au 4d intensities result from the fact that only about 45% of the Au surface is covered by the clusters, as given by a detailed analysis of the XPS intensities for varying the surface sensitivity of the experiment via the detection angle (not shown).
2.2.2.2 Second immersion experiment with 5
A film was prepared by immersion of the gold sample (gold sputtered on stainless steel) into a solution containing 23 mg (2.06 × 10⁻⁵ mol) of cluster 5 (1.29 mM solution) dissolved in 16 mL of freshly distilled CH2Cl2. After immersion for 72 h, the sample was removed from the solution, thoroughly washed with CH2Cl2, dried with a nitrogen stream and kept under argon until the XPS measurements were performed.
In this case, it seems that most of the dialkyl sulfide groups of 5 have reacted with the gold surface. The molybdenum signal (Fig. 11a) is still very broad and not as well defined as that of the spin coated samples. Unbound sulfur atoms are still observed, as in Section 2.2.2.1 (Fig. 11c and d). In Fig. 11d, the S 2p spectrum of the present sample (red line1, open squares) is compared to that of a sulfur pellet (yellow line1, open circles). The enhanced width of the S 2p curve confirms the superimposition of two S 2p signals for the immersed sample and the situation is similar to that illustrated by the signal (c) in Fig. 9. Surprisingly, no phosphorus is visible in this case. At this stage, we cannot explain this phenomenon and further investigations will be required. The cluster surface coverage has increased when compared to that in Section 2.2.2.1 and this could logically be attributed to the longer immersion time.
XPS data of the sample from Section 2.2.2.2 prepared from 5.
2.2.2.3 Third immersion experiment with 5
The film was prepared by immersion of the gold sample (similar to that in Section 2.2.2.2) into a solution containing 6 mg (5.38 × 10⁻⁶ mol) of 5 (1.34 mM solution) dissolved in 4 mL of freshly distilled CH2Cl2. After immersion for 24 h, the sample was removed from the cluster solution, washed abundantly with CH2Cl2, dried with a nitrogen stream and kept under argon until the XPS measurement.
Again, the S 2p signal reveals the presence of bound as well as unbound sulfur and the situation is almost the same as in Section 2.2.2.2 (see Fig. 12a and b). The immersion time is shorter than in Section 2.2.2.2 but the ratio bound/unbound sulfur is very similar in these two experiments. No P 2p signal is observed in this case (Fig. 12e), which is similar to the experiment in Section 2.2.2.2. Consequently, the immersion time does not seem to play a role in the absence of phosphorus. Rather, this could be related to the nature of the surface, since in the cases of Sections 2.2.2.2 and 2.2.2.3, for which the surface was similar, no P 2p signal was visible, whereas in the case of the immersed gold foil Section 2.2.2.1, the P 2p signals were present, as in the case of the spin coated samples. The intensities of all the signals are lower than in the case of Section 2.2.2.2, which could be attributed to the shorter immersion time and to a smaller coverage of the gold surface by the cluster.
XPS data of the sample from Section 2.2.2.3 prepared from 5.
Finally, it seems that the attachment of 5 through its two dialkyl sulfide functions has been possible in all the immersion cases. In the case of the gold foil in Section 2.2.2.1, the coplanarity of the sulfur atoms and that of the phosphorus atoms may indicate an organisation of the cluster on the surface (Fig. 10). Nevertheless, in the cases described in Sections 2.2.2.2 and 2.2.2.3, the absence of P 2p signals is not easy to understand. We can suppose that a cleavage of the Pd–P bonds in the clusters liberates free triethylphosphine which is volatile and therefore eliminated under vacuum. However, it does not explain why in one immersion case (Section 2.2.2.1), phosphorus is still present on the surface. We would like to perform two further experiments to see whether the nature of the gold surface (a gold foil in Section 2.2.2.1 and gold sputtered on stainless steel in Sections 2.2.2.2 and 2.2.2.3) plays a significant role. The first would be to reproduce the experiment of Section 2.2.2.1 and see whether phosphorus is still present. The second experiment would be to perform a spin coating on a gold foil, analyze the P 2p signal and its evolution with respect to the measurement time and compare the spectrum with those of Sections 2.2.1.3, 2.2.2.2 and 2.2.2.3.
2.2.3 Immersion of gold surfaces into solutions of complex 6
2.2.3.1 First immersion experiment with 6
11 mg (1.1 × 10⁻⁵ mol) of 6 (0.71 mM solution) were dissolved in 15 mL of freshly distilled CH2Cl2. The film was prepared by immersion of the gold foil into the solution. After 18 h of immersion at room temperature, the surface was taken out of the solution, washed with CH2Cl2 (20 mL) and dried with a nitrogen stream. The surface was kept under nitrogen until the XPS measurements were performed.
As shown in Fig. 13a, the black (circles) and red (squares) S 2p data1 for complex 6 nearly match with the yellow (diamonds) data of the S pellet, i.e., there is one contribution to the line width, similar to Fig. 7b, for the spin coated sample. The data in Fig. 13a thus differ from those of the other immersion coated samples in Figs. 8b, 11d and 12b, whose S 2p data display two line widths (additional intensities at lower binding energy). In other words, in Figs. 8b, 11d and 12b, the S 2p signal is broader than the S 2p reference signal from the S pellet, whereas in Fig. 13a the S 2p signal is nearly as broad as the S 2p reference signal from the S pellet, suggesting the presence of only unbound sulfur. However, the molybdenum signal (Fig. 13b), not very intense and very broad, could be consistent with a loss of molybdenum during the adsorption process. Contrary to the case of Section 2.2.2.1 where the signals for phosphorus could be observed, allowing a determination of the disposition of the cluster (Fig. 5), the nitrogen signals which could allow a similar deduction are too weak to allow conclusions to be made concerning the disposition of the complex on the surface.
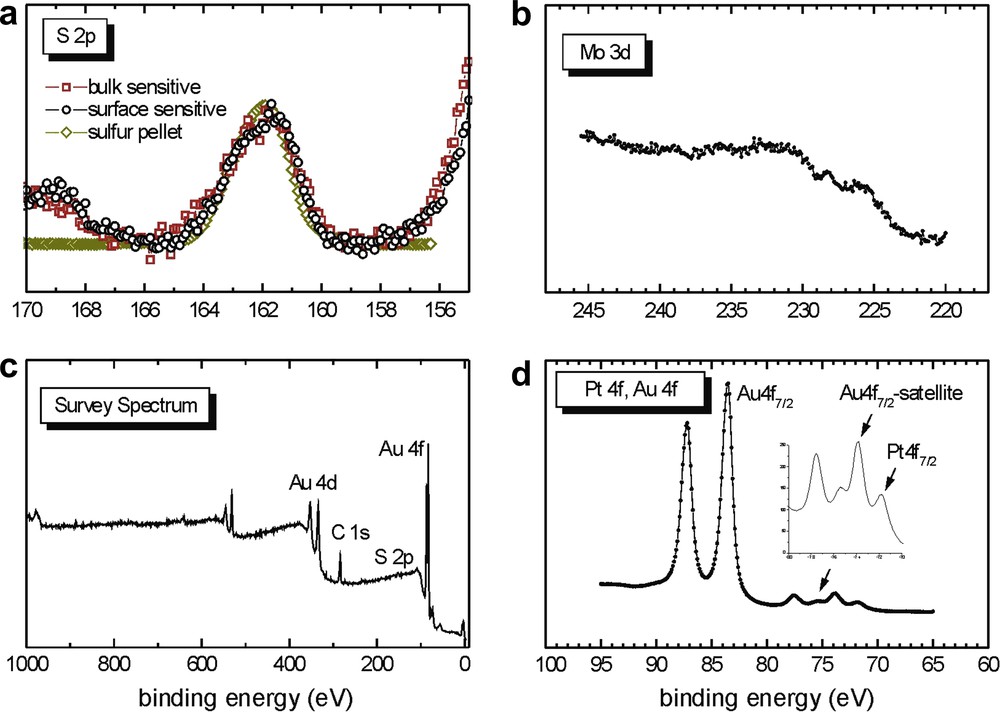
XPS data of the sample from Section 2.2.3.1 prepared from 6.
2.2.3.2 Second immersion experiment with 6
The film was prepared by immersion of the gold sample (gold sputtered on stainless steel) into the solution containing 7 mg (6.81 × 10⁻⁶ mol) of 6 (1.14 mM solution) dissolved in 6 mL of freshly distilled CH2Cl2. After immersion for 72 h, the sample was removed from the solution, washed abundantly with CH2Cl2, dried with a nitrogen stream and kept under argon until the XPS measurement.
The situation here is different to that in Section 2.2.3.1. The broad (i.e., 2 components) S 2p signal in Fig. 14b contrasts with the narrow (i.e., one component) S 2p signal in Fig. 13a. It may be that in Section 2.2.3.1, the 18 h immersion period was too short to allow for the formation of bonded species while in 2.2.3.2, the longer immersion period of 72 h appears sufficient to allow the dialkyl sulfide groups of complex 6 to react with the surface (Fig. 14a and b). The Mo 3d signals are not very visible (Fig. 14c).
XPS data of the sample from Section 2.2.3.2 prepared from 6.
For the two immersions of 6, 2.2.3.1 and 2.2.3.2, it is difficult to know the exact nature of the layer. The comparison of the S 2p signal widths in 2.2.3.1 and 2.2.3.2 gives evidence that the ratio of bonded to non-bonded species increases with immersion time (72 h against 18 h).
3 Conclusion
In this work, we have presented the synthesis of five new organometallic complexes and clusters 4–8 containing a thioether (dialkyl sulfide) function attached to a cyclopentadienyl ring. The aim of the work was to study the reactivity of the dialkyl sulfide groups present in these molecules toward gold surfaces to generate self-assembled organopolymetallic monolayers. Therefore, we used two procedures of attachment and analysed the surfaces by XPS, ellipsometry and STM. In the cases of the spin coating of 5 on gold surfaces, the cluster does not seem to react with the surface, probably because of a too short reaction time, to allow the desired Au–S bonding interaction to develop. When immersion procedures were applied to 5 and 6, the attachment of the complexes on the surface was observed, as evidenced in XPS by the enhanced S 2p line width. By varying the parameters (immersion time, concentration, nature of the gold surfaces), we could perform different measurements leading to the conclusion that in all the immersion cases an attachment of the heterometallic species has occurred. However, it is difficult to know the exact nature of the monolayers and whether the complex remains intact on the surface. Some of the results are not understood so far, for example the absence of phosphorus in the cases of Sections 2.2.2.2 and 2.2.2.3. What really happens on these surfaces and the role of the initial surface for the formation of molybdenum–palladium-containing layer should be the subject of future experiments. A better understanding and control of the formation of SAMs with heterometallic complexes could allow the preparation of heterometallic systems with specific properties (electronic, catalytic, magnetic).
4 Experimental part
4.1 Preparation of the gold substrates
4.1.1 Gold samples used in Sections 2.2.1.1 and 2.2.1.2
Small pieces of highly oriented pyrolytic graphite (HOPG), ZYA grade from Advanced Ceramics, of about 5 × 5 × 1 mm3, were fixed onto stainless steel plates with Torr Seal© Epoxy Resin for vacuum applications. The surface was then sputtered with gold (about 50 nm) in vacuum (∼10−5 mbar) by using a ROTH RAU MicroSys 350.
4.1.2 Gold samples used in Sections 2.2.2.1 and 2.2.3.1
Commercially available Goodfellow 50 × 50 × 0.05 mm3 gold foils (purity 99.95) were cut into 10 mm × 10 mm × 0.05 mm foils. Before they were immersed into solutions of the heterometallic complex, the foils were washed abundantly with CH2Cl2 and dried with a nitrogen stream.
4.1.3 Gold samples used in Sections 2.2.2.2, 2.2.2.3 and 2.2.3.2
A stainless steel plate was polished with a grain size of 1/4 μm and then sputtered with gold (about 50 nm) by using a ROTH RAU MicroSys 350 in vacuum (∼10−5 mbar).
4.2 Instrumentation
The spin coater was a WS-200-4NPP/RV instrument by Fa. Laurell Technologies Corp., North Wales, PA, USA. The ellipsometer was an EP3 instrument by Nanofilm Technologies GmbH, Göttingen, Germany and the XPS was an ESCALab MkII instrument by Vacuum Generators. The photon energy is 1486.6 eV (Al Kα). The spectra were recorded in normal emission in bulk-sensitive mode (polar angle θ = 0°) and in surface sensitive mode (polar angle θ = 75°).
The STM analyses were performed on an SPM Model by RHK Technology, constructed by Dr. H. Zhang, Department of experimental physics, Saarland University, Germany.
4.3 Synthesis of the heterometallic complexes
4.3.1 General procedures
All reactions were carried out under an atmosphere of nitrogen by means of conventional Schlenk techniques. Solvents were dried according to standard procedures. Elemental analyses were performed by the “Service de microanalyses”, Université Louis-Pasteur, Strasbourg. The NMR spectra were recorded on a Bruker Avance 300 (1H and 1H{31P}, 300 MHz; 13C{1H}, 75.47 MHz; 31P{1H}, 121.49 MHz). Chemical shifts (in ppm) were measured at ambient temperature and are referenced to external TMS for 1H and 13C and H3PO4 (84%) for 31P. The spectra were recorded at 298 K. Assignments are based on APT and DEPT spectra and 1H, 1H-COSY and 1H, 13C-HMQC experiments. IR spectra were recorded in the region 4000–400 cm−1 on an FT-IR IFS66 Bruker spectrometer.
The following compounds were synthesized according to the literature procedures: Na(C5H5) [65], [Pd2(NCMe)6](BF4)2 [70], trans-[PtCl2(CNt-Bu)2] [63], trans-[PtCl2(NCPh)2] [65,71]. The salt Li(C5H4CH2CH2SCH2CH3) was synthesized by deprotonation of C5H5CH2CH2SCH2CH3 [64] with butyllithium by −78 °C in hexane.
4.3.1.1 Preparation of Li[Mo(η5-C5H4CH2CH2SCH2CH3)(CO)3]·2DME (4)
To a solution of lithium(5-(2-ethylsulfanyl-ethyl)-cyclopenta-1,3-dienate) (3.201 g, 19.97 mmol) in 100 mL 1,2-dimethoxyethane (DME) was added molybdenum hexacarbonyl (5.27 g, 19.97 mmol). The mixture was refluxed for 4 h with constant stirring. The disappearance of [Mo(CO)6] was monitored by IR spectroscopy. After concentration of the solution and precipitation with pentane (200 mL), compound Li[Mo(η5-C5H4CH2CH2SCH2CH3)(CO)3]·2DME (4) was isolated, washed with pentane (3 × 50 mL) and dried in vacuo to give a brown oil. Yield 9.46 g, 91%. IR (THF): ν(CO) = 1899s, 1793s, 1732s cm−1. 1H NMR ((CD3)2CO): AA′XX′ spin system δ 5.00 and 4.88 (pseudo-triplets, 4H, Cp), 3.48 (s, 8H, DME), 3.30 (s, 12H, DME), 2.68 (m, 4H, CH2CH2S), 2.54 (q, 3J = 7.4 Hz, 2H, SCH2CH3), 1.24 (t, 3J = 7.4 Hz, 3H, SCH2CH3).
4.3.1.2 Preparation of [Mo2Pd2(η5-C5H4CH2CH2SCH2CH3)2(CO)6(PEt3)2] (5)
To a stirred solution of 4 (0.70 g, 1.34 mmol) in THF (20 mL) was added at −78 °C a suspension of [Pd2(CH3CN)6][BF4]2 (0.43 g, 0.67 mmol) in THF (10 mL). The solution turned immediately dark blue. After 10 min, triethylphosphine (198 μL, 1.34 mmol) was added to the solution which turned violet. Under constant stirring, the temperature was slowly raised to reach 20 °C in 1 h. The resulting dark violet mixture was evaporated to dryness, and the residue was chromatographed on a silica gel column. Elution with a THF/pentane mixture (1/10) gave a red solution of [Mo2(η5-C5H4CH2CH2SCH2CH3)2(CO)6] (IR(THF): 1950s, 1910 m cm−1). Elution with a THF/pentane mixture (1/2) gave a dark violet solution the desired cluster [Pd2Mo2(η5-C5H4CH2CH2SCH2CH3)2(CO)6(PEt3)2] (5). Yield: 0.59 g, 79%. Anal. Calc. for C36H56Mo2O6P2Pd2S2: C, 38.76; H, 5.06. Found: C, 38.77; H, 5.08%. IR (CH2Cl2): ν(CO) = 1836vs, 1775br. IR (KBr): ν(CO) = 1840vs, 1775br cm−1. 1H{31P} NMR (CDCl3): AA′XX′ spin system δ 5.12 and 5.10 (m, 8H, Cp), 2.65 (m, 8H, CH2CH2SCH2), 2.51 (q, 3J = 7.4 Hz, 4H, SCH2CH3), 1.73 (q, 3J = 7.6 Hz, 4H, PCH2), 1.24 (t, 3J = 7.4 Hz, 6H, SCH2CH3), 1.02 (t, 6H, PCH2CH3). 13C{1H} NMR (CDCl3): δ 241.9 (CO), 110.25 (Cipso, Cp), 90.69 (2C, Cp), 89.10 (2C, Cp), 33.20 (CH2CH2S), 28.74 (CH2CH2S), 26.04 (SCH2CH3), 16.97 (virtual triplet, PCH2CH3, |1J(PC) + 4J(PC)| = 20 Hz), 14.79 (SCH2CH3), 8.27 (PCH2CH3). 31P{1H} NMR (CDCl3): δ 21.69.
4.3.1.3 Preparation of trans-[Pt{Mo(η5-C5H4CH2CH2SCH2CH3)(CO)3}2(CNt-Bu)2] (6)
To a stirred solution of 4 (0.33 g, 0.63 mmol) in THF (20 mL) was added at −40 °C trans-[PtCl2(CNt-Bu)2] (0.14 g, 0.32 mmol). Under constant stirring, the temperature was slowly raised to reach 20 °C in 8 h. The solution was filtered through Celite and the solvent was evaporated to dryness. The major part of the orange solid was dissolved in toluene and filtered. Most of the toluene was evaporated under reduced pressure and an orange solid was precipitated by addition of pentane and filtered, affording a brown-orange solid 6 which was dried under vacuum. Yield: 0.28 g, 81%. Anal. Calc. for C34H44Mo2N2O6PtS2: C, 39.73; H, 4.31; N, 2.73. Found: C, 39.57; H, 4.40; N, 2.80%. IR (KBr): ν(NC) = 2168s, ν(CO) = 1911s br, 1860s, 1833s cm−1. IR (CH2Cl2): ν(NC) = 2169s, ν(CO) = 1918s, 1869sh cm−1. 1H NMR (CDCl3): AA′XX′ spin system δ 5.30 and 5.23 (pseudo triplets, 8H, Cp), 2.65 (m, 8H, CH2CH2SCH2), 2.51 (q, 3J = 7.4 Hz, 4H, SCH2CH3), 1.65 (s, 18H, CH3, t-BuNC), 1.26 (t, 3J = 7.4 Hz, 6H, SCH2CH3). 13C{1H} NMR (CDCl3): δ 229.1 (CO), 112.0 (Cipso, Cp), 91.3 (2C, Cp), 90.9 (2C, Cp), 59.53 (CMe3, t-BuNC), 33.1 (CH2CH2S), 30.3 (Me, t-BuNC), 29.4 (CH2CH2S), 26.1 (SCH2CH3), 14.8 (SCH2CH3).
4.3.1.4 Preparation of trans-[Pt{Mo(η5-C5H4CH2CH2SCH2CH3)(CO)3}2(NCPh)2] (7)
To a stirred solution of 4 (0.26 g, 0.49 mmol) in THF (20 mL) was added at −40 °C trans-[PtCl2(NCPh)2] (0.12 g, 0.25 mmol). After the reaction mixture was stirred for 3 h at −40 °C, the solvent was evaporated to dryness. The obtained solid was washed with toluene (3 × 5 mL) and dried under vacuum. The red-brown solid isolated by filtration is a very sensitive compound that has to be stored in the fridge. Recrystallization from a THF/pentane mixture afforded very sensitive orange-red crystals of 7. Yield: 0.166 g, 63%. Anal. Calc. for C38H36Mo2N2O6PtS2: C, 42.74; H, 3.40; N, 2.62. Found: C, 43.12; H, 3.76; N, 3.02%. IR (KBr): ν(CO) = 1943 m, 1893 s, 1852 s, 1813 s br cm−1. 1H NMR ((CD3)2CO): δ 8.05, 7.90 and 7.77 (m, 10H, PhCN), AA′XX′ spin system 5.49 and 5.39 (pseudo-triplets, 8H, Cp), 2.68 (m, 8H, CH2CH2SCH2), 2.56 (q, 3J = 7.4 Hz, 4H, SCH2CH3), 1.22 (t, 3J = 7.4 Hz, 6H, SCH2CH3). 13C{1H} NMR ((CD3)2CO): δ 233.85 (CO), 135.13 (1C para, Ph), 132.89 (2C, meta Ph), 132.08 (Cispo, Ph), 129.92 (2C, ortho Ph), 112.33 (Cipso, Cp), 110.24 (PhCN), 91.25 (2C, Cp), 90.70 (2C, Cp), 32.64 (CH2CH2S), 29.55 (CH2CH2S), 25.34 (SCH2CH3), 14.32 (SCH2CH3).
4.3.1.5 Preparation of (8)
Complex 4 (0.72 g, 1.39 mmol) was dissolved in a solution of CHCl3 (50 mL) which was stirred at room temperature for 6 days. The solution turned red after some minutes. The IR spectrum indicated the formation of [Mo(η5-C5H4CH2CH2SCH2CH3)(CO)3]2 followed by that of the chlorinated mononuclear complex 8 in which the sulfur group is coordinated to molybdenum. Anal. Calc. for C11H13ClMoO2S: C, 38.78; H, 3.85. Found: C, 38.57; H, 3.74%. IR (KBr): ν(CO): 1959s, 1853s. IR(CH2Cl2): ν(CO): 1975s, 1864s cm−1. 1H NMR (CDCl3): δ 5.81, 5.78, 5.27, 4.75 (4H, Cp), 4.01, 3.72, 2.90 and 2.53 (4 m, 4H, CH2CH2S), 2.78 (m, 2H, SCH2CH3), 1.40 (t, 3J = 7.4 Hz, 6H, SCH2CH3).
4.3.2 Crystal structure determinations
Diffraction data were collected on a Kappa CCD diffractometer using graphite-monochromated Mo Kα radiation (λ = 0.71070 Å). The relevant data are summarized in Table 1. The cell parameters were determined from reflexions taken from one set of 10 frames (1.0° steps in phi angle), each at 20 s exposure. Data were collected using phi-scans and the structures were solved by direct methods using the SHELXL97 software [72–74], and the refinement was performed by full-matrix least squares on F2. The absorption was not corrected. All non-hydrogen atoms were refined anisotropically. Hydrogen atoms were generated according to stereochemistry and refined using a riding model in SHELXL97. The crystallographic material has been sent to the Cambridge Crystallographic Data Centre, 12 Union Road, Cambridge CB2 1EZ,UK, as supplementary material CCDC 697393–697396 and can be obtained by contacting the CCDC (quoting the article details and the corresponding SUP number). See http://www.ccdc.cam.ac.uk/deposit for crystallographic files in .cif format.
Crystallographic data, data collection parameters, and refinement results.
| 5 | 6 | 7 | 8 | |
| Formula | C36H56Mo2O6P2Pd2S2 | C34H44Mo2N2O6PtS2 | C38H36Mo2N2O6PtS2 | C11H13ClMoO2S |
| fw | 1115.55 | 1027.80 | 1067.78 | 340.66 |
| Crystallographic system | Triclinic | Monoclinic | Triclinic | Monoclinic |
| Space group | P-1 | P21/c | P-1 | P21/n |
| a (Å) | 8.778(5) | 10.575(1) | 9.0020(9) | 8.1840(3) |
| b (Å) | 11.144(7) | 11.997(1) | 9.9490(8) | 12.7310(5) |
| c (Å) | 12.574(8) | 15.650(2) | 11.5220(12) | 12.9060(6) |
| α (°) | 67.62(5) | 90.00 | 66.681(4) | 90.00 |
| β (°) | 69.77(5) | 106.89(5) | 76.310(3) | 107.7300(15) |
| γ (°) | 79.64(5) | 90.00 | 86.075(4) | 90.00 |
| V (Å3) | 1065.6(11) | 1899.8(3) | 920.34(15) | 1280.81(9) |
| Z | 1 | 2 | 1 | 4 |
| Crystal size (mm3) | 0.13 × 0.10 × 0.08 | 0.10 × 0.10 × 0.10 | 0.10 × 0.10 × 0.10 | 0.10 × 0.10 × 0.10 |
| Color | Violet | Orange | Orange | Red |
| Dcalc (g cm−3) | 1.738 | 1.797 | 1.927 | 1.767 |
| μ (mm−1) | 1.619 | 4.476 | 4.624 | 1.377 |
| T (K) | 173(2) | 173(2) | 173(2) | 173(2) |
| F(000) | 558 | 1008 | 520 | 680 |
| Θ limits (°) | 2.19/27.46 | 2.01/30.03 | 1.98/27.52 | 2.30/29.94 |
| No. of data measured | 4829 | 5550 | 3913 | 3707 |
| 3726 | 3925 | 2479 | 2215 |
| No. of parameters | 226 | 214 | 232 | 145 |
| R1 | 0.1015 | 0.0365 | 0.0893 | 0.0452 |
| wR2 | 0.1568 | 0.0843 | 0.1318 | 0.1122 |
| GOF | 1.173 | 0.929 | 1.062 | 0.685 |
| Max/min res. dens. (e Å−3) | 1.336/−1.952 | 1.700/−1.596 | 1.159/−1.108 | 0.696/−0.723 |
Acknowledgments
We are grateful to the CNRS, the DFG, DFH/UFA and the Ministère de l'enseignement supérieur et de la recherche (International Research Training Group 532-GRK532) for a Ph.D. grant to P.C. and financial support.