

1 Introduction
Before the discovery of the glutamine synthetase/glutamate synthase (GS/GOGAT) cycle by Lea and Miflin in 1974 [1], glutamate dehydrogenase (GDH; EC 1.4.1.2) had been believed to be the main enzyme involved in ammonium assimilation in higher plants. Numerous studies have then been carried out to define the role of GDH, which has the capacity to assimilate ammonium by catalysing in vitro the reversible amination of 2-oxoglutarate to glutamate (Fig. 1). It was proposed that under particular physiological conditions, ammonium could be directly incorporated into 2-oxoglutarate to produce glutamate via the reaction catalysed by GDH in the mitochondria and subsequently into glutamine by cytosolic GS [2]. In most plant species, GDH is encoded by two distinct nuclear genes [3–5]. Each gene encodes a different subunit termed α- and β-polypeptides, which can be assembled as homo or heterohexamers composed of a different ratio of α- and β-polypeptides, thus leading to the formation of seven active isoenzymes [2]. In the Arabidopsis genome, a third putative GDH gene (At3g03910) encoding a β-subunit-like has been identified in silico [5]. Metabolomics provides a means for evaluating the phenotype of an organism, and can be defined by the pool of small molecules, whose levels of accumulation is altered in response to changes in gene expression either due to the genetic background or to environmental conditions [6]. This approach is therefore of particular interest for elucidating the function of new genes. In order to precise the function of GDH3, metabolic changes in mutants deficient or the corresponding isoenzyme were investigated by using 1H-Nuclear Magnetic Resonance spectroscopy followed by multivariate data analysis. One single analytical method cannot provide information about all the metabolites present in plants. However, NMR constitutes a first step of a metabolomic study from a macroscopic point of view [7]. It is a nontargeted and non-destructive analytical method, which has the advantage of allowing detection of very diverse groups of metabolites in a relatively short period of time [8].
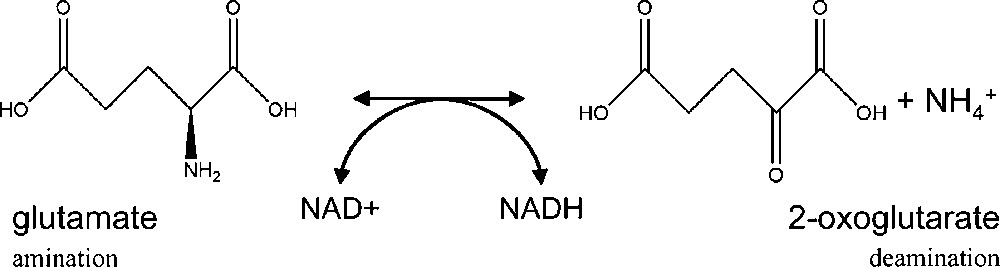
Reversible reaction of glutamate to 2-oxoglutarate catalysed by GDH.
2 Experimental
2.1 Plant material
Arabidopsis thaliana seeds were surface sterilised for 20 min in a 0.25% NaClO solution, washed three times in sterile water and placed on Petri dishes containing Murashige and Skoog medium [9] (MS, Duchefa, Haarlem, The Netherlands) solidified with 0.8% agar, and supplemented with 2% sucrose. After 48–72 h of incubation at 4 °C in the dark, the plates were transferred to a controlled environment growth chamber (16 h light, 8 h dark at 25 °C). After 3 weeks, seedlings were removed from the plates and transferred to hydroponic units with a nutritive solution containing 10 mM KNO3 and 2 mM NH4Cl [10]. Plants were placed in a controlled environment growth chamber (16 h light, 350–400 μmol photons.m-2.s-1, 25 °C; 8 h dark, 18 °C). Arabidopsis background: Col-0 (Columbia, N60000) and gdh3 mutants (SALK_137670) were obtained from the Nottingham Arabidopsis Stock Centre (NASC). The mutant plants homozygous for the T-DNA insertions were isolated from the seed stocks using the PCR screening protocol described by the Salk Institute web page http://signal.salk.edu.
2.2 PCR experiments
Genomic DNA was extracted from Arabidopsis leaves according to the method of Edwards et al. [11]. PCR was performed on a Eppendorf Mastercycler using a Taq DNA Polymerase (Sigma) in a final volume of 20 μl according to the manufacturer's protocol. The reaction was incubated for 10 min at 95 °C followed by 40 cycles of 30 s at 95 °C, 30 s at 63 °C and 2 min at 72 °C. Specific primers for the GDH3 gene were designed in the border regions of T-DNA insertion (forward primer 5’-GACTCTCTGATCAAATAAACCCAAA-3’ and reverse primer 5’-AAGGTTAAACTGCAATTAGCACA-3’, 2103 bp). To amplify the T-DNA insertion, other specific reverse primer was designed (5’-GTACGGAAGTTGACCGTGCT-3’, 1256 bp).
2.3 Extraction
Leaf, stem and root samples were separately frozen in liquid nitrogen and then reduced to a homogeneous powder using a grinder (MM301, Retsch, Germany). Each powder was stored at −80 °C and freeze-dried. Fifty milligrams of dried material were transferred to a 2 mL microtube and 1.5 mL extraction buffer (750 μL of methanol-d4 and 750 μL of KH2PO4 buffer in D2O containing trimethyl silyl propionic acid sodium salt (TMSP–d4) (pH 6.0)) was added to each sample. The tube was shaken at room temperature for 1 min with a vortex, before ultrasonication (25 min), and centrifugation at 14,000 rpm at room temperature for 30 min. Six hundred μL of the supernatant were then transferred into a 5 mm NMR tube. The experiment was done in six replicates.
2.4 NMR spectra measurements
All spectra (1H-NMR and J-resolved) were recorded at 300 K on a Bruker Avance DMX500 spectrometer operating at 500.13 MHz for 1H using a multinuclear broadband TXI 5 mm probe. Each spectrum consisted of 128 scans of 32 K data points with a spectral width of 5208 Hz and a water suppression pulse sequence with a relaxation delay of 5 s. The resulting 1H spectra were manually phased and baseline corrected, and calibrated to TMSP at 0.0 ppm, all using XWIN NMR (Version 3.3, Bruker). The FID was multiplied by an exponential weighing function corresponding to a line broadening of 0.3 Hz prior to Fourier transformation. Two-dimensional J-resolved and 1H-NMR spectra were acquired using eight scans per 256 increments that were collected into 32 K data points, using spectral widths of 5208 Hz in F2 and 50 Hz in F1.
2.5 Data analysis
The 1H-NMR spectra were automatically reduced to ASCII files using MestReNova (v. 5.2.5, Mestrelab Research, Santiago de Compostela, Spain). Spectral intensities were scaled to TMSP and reduced to integrated regions or “buckets” of equal width (0.04 ppm) corresponding to the region of δ 9.0 to δ −0.6. The region between δ 4.85 to δ 4.75 was removed from the analysis because of the residual signal of water. The residual proton signals corresponding to methanol-d4 (δ 3.33 to δ 3.25) and the proton signals corresponding to TMSP-d4 (at δ 0.0) were also removed. The generated ASCII file was imported into Microsoft Excel® for the addition of labels. Principal component analysis (PCA) and partial least squares discriminant analysis (PLS-DA) were performed with the SIMCA-P software (v. 11.0, Umetrics, Umeå, Sweden).
2.6 Statistical analysis
Each signal identified by PLS-DA as discriminant was integrated or deconvoluted by XWIN NMR. The resulting area was used to test the significance of the differences observed between wild types and mutants by a student test using the Microsoft Excel® software.
3 Results and discussion
3.1 Molecular and phenotypic characterization of gdh3 mutant
Prior to metabolic analysis, PCR was performed to verify that the T-DNA was inserted in the gdh3 mutant. The absence of PCR products (Fig. 2, lane 3) shows that the mutant does not contain the DNA fragment necessary for transciption of the corresponding RNA. On the contrary, the mutant contains a T-DNA insertion (Fig. 2, lane 4). Phenotypic comparison of a mutant and a wild type can provide information about the physiological impact of a mutation [12]. The gdh3 mutant exhibited a similar phenotype compared to the wild type (Fig. 3). It was thus necessary to develop a metabolic profiling approach to investigate the function of the GDH3 gene.

Separation of GDH3 gene PCR products in the gdh3 mutant and in the wild type. Lane M contains a molecular weight marker (SmartLadder, Eurogentec). Lane 1 and 2 contains PCR product from an untransformed Arabidopsis (WT). Lane 3 and 4 contains PCR product of Arabidopsis gdh3-deficent mutant. Lane 1 and 3 contains PCR product coming from GDH3 gene. Lane 2 and 4 contains PCR product coming from T-DNA insertion.
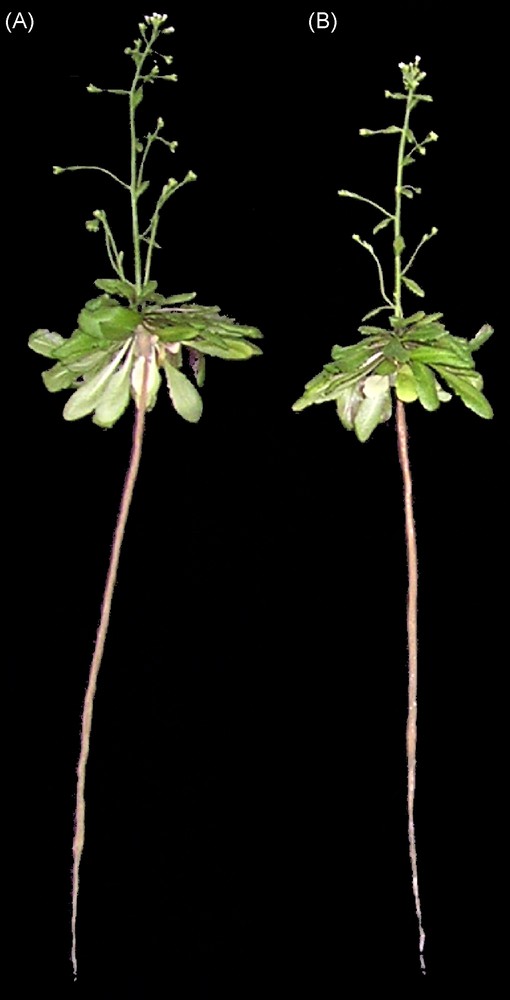
Wild-type (A) and mutant (B) phenotypes. Note that phenotype is similar between the wild type and the gdh3 mutant.
3.2 NMR assignments and multivariate data analysis
Previous 1H-NMR metabolomic studies of A. thaliana, clearly showed that various metabolites such as amino acids, carbohydrates, organic acids and phenolics can be detected in a single spectrum without magnifying a certain class of compounds [13,14]. These studies were carried out using a MeOH-water extraction. A similar extraction solvent was applied to leaves, stems and roots of A. thaliana wild type and mutant plants presented herein.
A number of primary and secondary metabolites were identified in the 1H-NMR spectrum. All metabolites were identified by comparison with chemical shifts of reference compounds or with the help of two-dimensional J-resolved NMR spectra, which provides the splitting pattern of each signal with the exact coupling constant, as examplified in Fig. 4. It was possible to identify amino acids such as alanine, proline, glutamic acid, glutamine, threonine, and valine, organic acids such as fumaric acid, malic acid, succinic acid and GABA; carbohydrates such as sucrose, glucose and fructose could also be identified thanks to their anomeric signals, by comparison with authentic standards. In addition, kampferol glucosides and conjugated phenylpropanoids such as sinapoyl malate were assigned on the basis of literature references [13,15] (Table 1). In order to select the resonances corresponding to the metabolites which were altered by the GDH3 mutation, multivariate data analysis were performed. For a first overview of metabolomic changes, the classical approach consists in applying a principal component analysis to the 1H NMR data. It is an unsupervised approach in which all tested samples are grouped on the basis of maximum variation within evaluated samples. This method could easily discriminate the different organs for the mutant or the wild type (Fig. 5). However, it was not possible to discriminate correctly the mutant from wild type whatever the organ (data not shown), indicating that the biological variations within the samples of the same groups could be bigger than between groups. In this case, a supervised multivariate data analysis using covariance is required to try to associate metabolites to the mutation. Partial Least Square Discriminant Analysis is such a supervised method. The results obtained with this method are presented in Fig. 6. As expected, a better separation occurred between wild types and mutants, comparing this to the PCA score plots (data not shown). According to the loading plots (Fig. 7), higher amounts of glutamic acid, malic acid, succinic acid and fumaric acid characterized the mutants whereas higher amounts of sucrose, isoleucine, alanine, and valine characterized the wild types in leaves. In stems, glutamate also appeared as a discriminant metabolite for the mutants, as well as sucrose, alanine, GABA and threonine, whereas glucose and fumaric acid were discriminant for the wild type. Root extracts mainly showed glutamate as the metabolite discriminating the mutant besides α-and β-glucose, and the wild type was slightly discriminated by glutamine, fumaric and malic acids. Since overlapping can occur in 1D-1H spectra, data obtained by buckets for PLS-DA analysis can be biased. J-resolved spectra were therefore used to detect individualized signals of identified discriminant metabolites. A t-test was then applied to the area corresponding to these signals in order to determine statistically significant signals between the mutant and the wild type. Most of the metabolites were confirmed as significantly differentiating the two groups of Arabidopsis at p < 0.05 (Fig. 6). These results corroborate the in silico studies, which identified a third putative gene encoding GDH, since glutamic acid is discriminant in the mutant whatever the organ examined. It would prove that GDH3 is effective for catalysing the deamination of glutamate into 2-oxoglutarate.

Representative 1H-NMR spectrum in the range of δ –0.5 to δ 8.5 (A) and 1H J-resolved spectrum in the range of δ 0.8 to δ 3 and in the range of δ 4 to δ 5.5 of mutant leaves (B). (1) isoleucine, (2) valine, (3) threonine, (4) alanine, (5) GABA, (6) glutamic acid, (7) glutamine, (8) proline, (9) succinic acid, (10) malic acid, (11) sucrose, (12) α-glucose, (13) β-glucose, (14) fumaric acid, (15) sinapoyl malate, (16, 17) kampferol derivatives.
1H representative chemicals shifts (δ) and coupling constants (Hz) of metabolites of Arabidopsis thaliana (CD3OD-KH2PO4 in D2O; pH 6.0).
| Compound | Chemical shifts (ppm) and coupling constants (Hz) |
| Alanine | 1.48 (β-CH3, d, J = 7.2 Hz) |
| α-aminobutyric acid (GABA) | 1.91 (β-CH2, q, J = 7.3 Hz), 2.36 (α-CH2, t, J = 7.3 Hz), 3.00 (γ-CH2, t, J = 7.5 Hz) |
| Sinapoyl malate | 7.66 (d, J = 16 Hz) |
| Fumaric acid | 6.60 (H2, H3, s) |
| β-Glucose | 4.57 (H1, d, J = 7.9 Hz) |
| α-Glucose | 5.17 (H1, d, J = 3.8 Hz) |
| Glutamic acid | 2.10 (β-CH2, m), 2.46 (γ-CH2, m) |
| Glutamine | 2.15 (β-CH2, m), 2.45 (γ-CH2, m) |
| Isoleucine | 0.95 (δ-CH3, t, J = 7.4 Hz), 1.02 (γ’-CH3, d, J = 7.0 Hz) |
| Kampferol derivatives | 7.80 (d, J = 8.8 Hz), 8.07 (d, J = 9.0 Hz) |
| Malic acid | 2.58 (H3a, dd, J = 16.0, 7.9 Hz), 2.80 (H3b, dd, J = 16.0, 4.6 Hz), 4.33 (H2, dd, J = 7.9, 4.6 Hz) |
| Proline | 2.00 (γ-CH2, m), 4.06 (α-CH, dd, J = 8.7, 6.3 Hz) |
| Succinic acid | 2.58 (H2, H3, s) |
| Sucrose | 4.16 (F-H3, d, J = 8.6 Hz), 5.40 (G-H1, d, J = 3.8 Hz) |
| Threonine | 1.33 (γ-CH3, d, J = 6.6 Hz), 3.50 (α-CH, d, J = 5.2 Hz), 4.22 (β-CH, m) |
| Valine | 1.00 (γ-CH3, d, J = 7.0 Hz), 1.05 (γ’-CH3, d, J = 7.0 Hz) |

PCA score plot of 1H-NMR data of different organs of wild types and mutants.
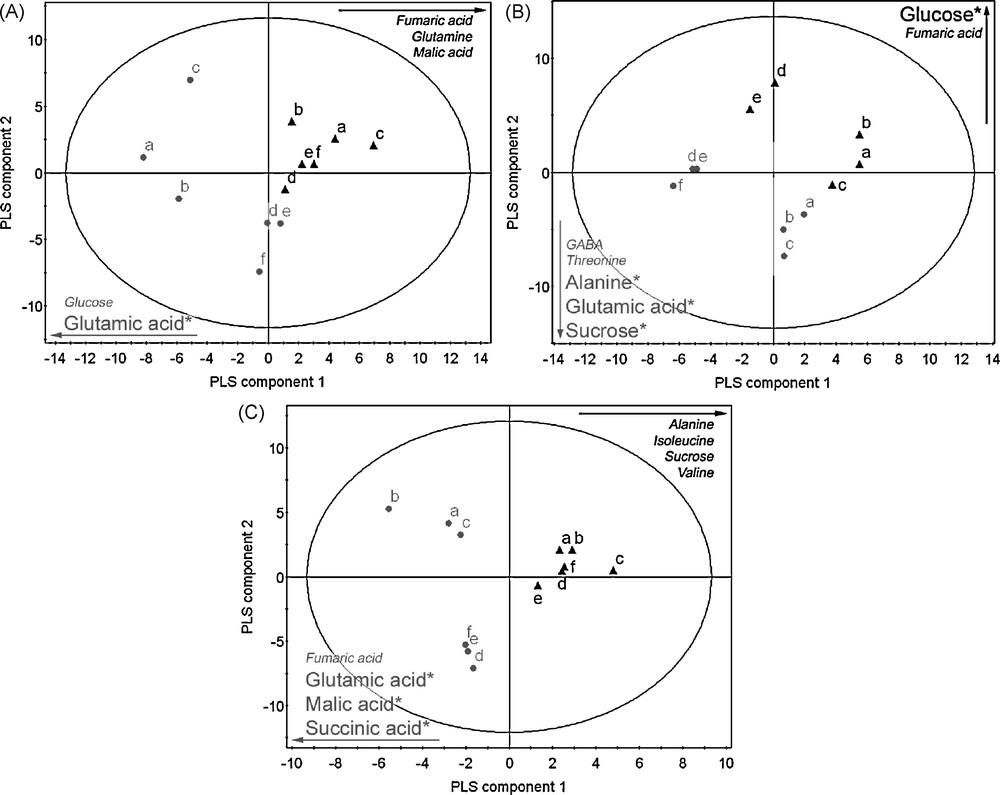
Score plot of PLS-DA in roots (A), stems (B), leaves (C) of wild type () and gdh3 mutant (). Statistically significant metabolites are labelled with an asterik (*) for p < 0.05.
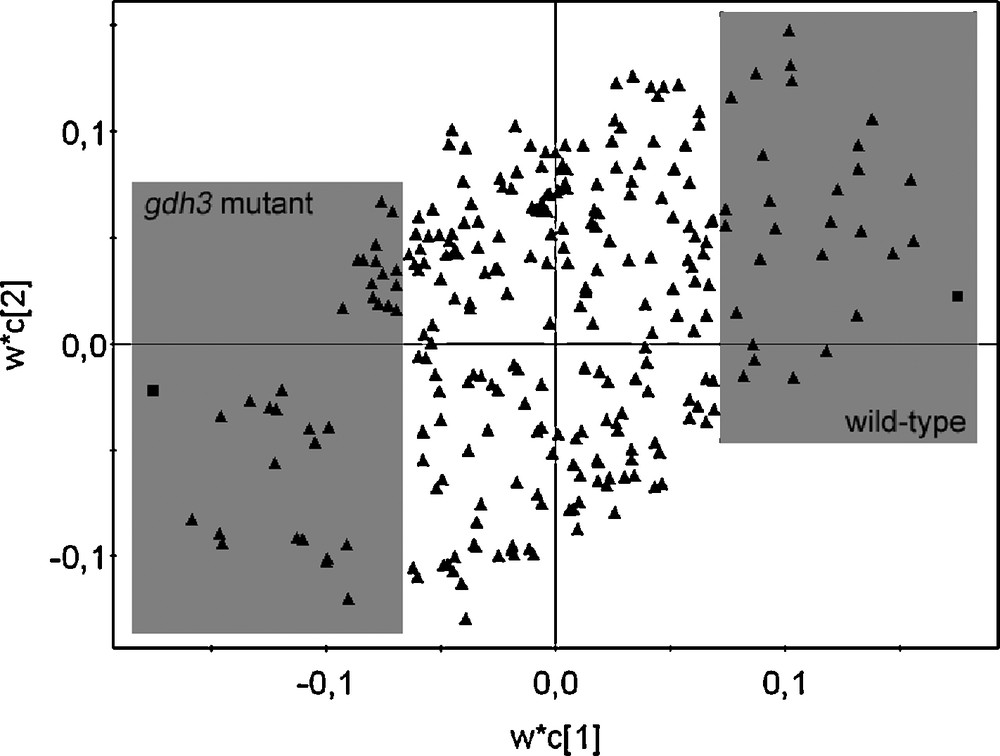
Loading plot of PLS-DA in leaves using two classes (class 1: wild type, class 2: gdh3 mutant). Each triangle represents the chemical shifts from bucketed 1H-NMR data. The grey frames show the discriminant chemical shifts of fumaric acid, glutamic acid, malic acid, succinic acid contained in gdh3 mutant (bottom left) and alanine, isoleucine, sucrose, valine contained in wild type (top right).
4 Conclusion
For the first time, we show that the metabolome of A. thaliana gdh3 mutants is modified. These modifications seem to indicate that GDH3 is not only involved in nitrogen assimilation [16], but would also play a role at the interface between carbon and nitrogen metabolism as revealed by the changes in carboxylic acids, carbohydrates and amino acids contents. In the future, it will be interesting to compare these results with the metabolic profiles of gdh1 and gdh2 knock out mutants and to determine the contribution of each of the two GDH isoenzymes to inorganic nitrogen assimilation.