

1 Introduction
Photocatalysis is an important domain in VOC remediation and water treatment, especially with the emerging problem of pharmaceuticals released in drinking water [1–3]. Photocatalysts can also be used for energy storage by hydrogen production from water splitting. Since the discovery of the photocatalytic splitting of water by titanium oxide under UV-light irradiation [4], many works have been devoted to this development [5–7]. As TiO2 exhibits a correct band gap for photon absorption, which is inexpensive and non-toxic, it has been widely studied for applications using its semi-conducting properties, like photovoltaic and photocatalysis. Nevertheless, the nature of the crystalline phase (anatase, rutile, brookite) and its crystallinity are important parameters, and the adequate electronic band structure goes along with a good absorption of light and the creation of stable electron-hole pairs [8]. The degradation efficiency of the organic molecules depends also upon their ability to interact with the catalyst, which means that a high specific surface area is expected for the catalyst, but also that the photoelectron created by the light irradiation must be easily transferred to form stable free radical groups. This illustrates the fact that the improvement of photocatalysts cannot be based only on trial-and-error, but must be the result of a full understanding of the different parameters that can modify the material properties.
Among the three crystalline phases of TiO2 – anatase, brookite, and rutile – the first two are metastable and the latter is the thermodynamically stable phase. It has been reported that pure anatase (EG = 3.2 eV) gives better results than rutile (EG = 3.0 eV) because of the higher reduction potential of photogenerated electrons. However, this assumption is partially contradicted by the excellent activity of a mixed structure of anatase and rutile, known as P25 from Degussa™, which means that other mechanisms should be involved. We tried in this study to optimise all crystalline, structural, and processing parameters of a nanocrystalline powder of pure TiO2 anatase, to evaluate how much the photocatalysis is relevant to those. This study allowed us to optimise both the material and the process, which was validated by comparison with a pure anatase material (Sigma™), from where we compared our performances with P25 (Degussa™) made of a mixed anatase–rutile heterostructure. Our study demonstrates that the full optimisation of anatase structural parameters lead to photocatalytic results as good as those obtained with the reference material from Degussa™, which let us think that future developments toward the creation of heterostructures should allow us to improve again the photocatalytic properties of titanium oxide obtained with this new method.
2 Experimental
2.1 Materials
BD BBL™ TB methylene blue, 250 mL (4/sp) (Becton, Dickinson and Company) buffer solution was used as received. Two types of commercial titanium oxide (TiO2) were used as a catalyst for comparison; the first (P25, Degussa™, Germany) is made of 75% of anatase and 25% of rutile and has a mean particle size of 18 nm[9]; the other is pure TiO2 anatase (Sigma™) with a 13 nm mean particle size. TiO2 anatase nanoparticles (6 nm) were synthesised at room temperature, according to a proprietary method previously published [10]. This method allowed us to prepare nanocrystalline titanium oxide and to adjust, not only the crystal size, but also the crystalline structure from pure anatase to a mixed anatase–brookite composition. Results reported in the following deal only with pure anatase, as the experiments carried out with anatase–brookite mixtures did not provide good photocatalytic results.
2.2 Instruments
X-ray diffraction (XRD) was carried out on a Bruker D8-Advance powder diffractometer using Cu Kα radiation (λ = 1.5405 Å) operating from 2θ = 10–90°. Sherrer formula was applied to calculate the crystallite size for the samples, the full width at half maximum (FWHM) being determined after a Gaussian fitting (Gaussian fit is allowed because of the large peak broadening). The UV–vis absorption of methylene blue was analysed with an Evolution 60 Thermo Scientific UV–vis Spectrometer. Methylene blue (MB) aqueous solution absorbs light of around 664 nm (absorption peak), and under the photocatalytic reaction of the TiO2, this peak decreases smoothly with a slight shift toward a shorter wavelength until the solution becomes colourless. The absorption was determined by the evaluation of the total absorption peak area, deduced after subtraction of the absorption base line (polynomial fit) from the raw data. The N2 adsorption isotherms were measured with a Quantachrome AUTOSORB-1. The samples were outgassed at 200 °C under vacuum for 12 h before the measurement. Surface area was determined by the BET method in a relative pressure range of 0.05–0.25. Pore size distribution was calculated with the Broekhoff and deBoer Model applied to the desorption branch [11,12]. A 254 nm wavelength, five 8 W bulbs with a typical intensity of 3500–4500 μW/cm2 (FB-UVXL-1000, Fisher Scientific) was used as the irradiation source. FTIR spectra were recorded from 400 to 4000 cm−1 (16 scans, 0.2 cm−1) by transmission with a Brucker Tensor 27 spectrometer (OPUS program). Absorption was adjusted by mixing the samples with KBr (Fisher Scientific).
2.3 Synthesis of TiO2 nanoparticles
A specific composition was chosen within the working area in the phase diagram for the preparation of pure TiO2 anatase, described previously [10]. In a typical synthesis, 2.9 mL of HCl was added drop-by-drop within 5 min under vigorous stirring (200 rpm) to 5 mL of Ti(O–n–Pr)4 left in an ice bath. Then, 2.86 mL formamide (FA) and 2.17 mL deionized water were mixed together before being added drop-by-drop to the previous solution within 15 min. After full addition, the sample was left for ageing in a thermostated bath at 30 °C for 24 h. The solution experienced a phase separation during this ageing phase with a physical gel formed at the bottom and a supernatant liquor on the top, which was removed. The gel container was covered and left at 60 °C for 1 week before drying. Ammonium chloride, a by-product of the reaction, was removed by washing the sample three times with 100 mL of deionized water, the powder being recovered by filtration afterward. At this stage, the gel could easily be dispersed in water by sonication. The samples were finally calcined in air for 4 h (100 °C.h−1 ramp) at different temperatures. The samples names used are RT-TiO2 for as-synthesised, and Txxx for RT-TiO2 thermally activated at xxx°C.
2.4 Photocatalytic activity
A stock methylene blue (MB) solution of 7.48 mM was used to create a 0.063 mM solution (2.1 mL MB in 250 mL DI water). Aliquots of 25 mL of this MB solution were used for test, and different mass of TiO2 was added. In the following, mass of TiO2 refers to the amount added into these 25 mL volumes. The suspension was kept under dark conditions (overnight) before experiments were carried out to allow the equilibrium to take place between the methylene blue solution and the catalyst. The methylene blue solution was exposed to UV irradiation source, and then, every 2 min, the samples were stirred for 30 s and then re-exposed to UV. The samples were centrifuged to separate the TiO2 from the solution, and the aliquots were taken for recording the spectra, before being poured back into the mother liquor. All the experiments were conducted at room temperature, and the top surface of all the beakers were open to air, since atmospheric air obviously provided enough oxygen for the oxidative degradation of the organics. The pH of the solution was changed during the experiment (pH = 2, 6, and 9). The progress of the reaction (degradation of the methylene blue solution) was achieved by integrating the area under the absorbance curve. The percentage removal of MB was calculated by using the equation given below:
| (1) |
3 Results and discussion
3.1 Structural characterisation
Fig. 1 shows the XRD patterns of the TiO2 nanoparticles treated thermally at different temperatures (RT, 350, 450, 500 °C and 600 °C) as well as the two types of commercial materials used as a reference in this study. A broad peak at 2Θ = 25.6°, corresponding to the (101) plane for anatase, is observed, and crystal size increases with temperature (6 nm, 7 nm, 10.5 nm, 10.8 nm, and 19 nm, for RT, 350 °C, 450 °C, 500 °C, and 600 °C, respectively). The similar diffraction peak broadening analysis for the commercial powders, Sigma™ and Degussa™, led to values of 13 nm and 18 nm, respectively.
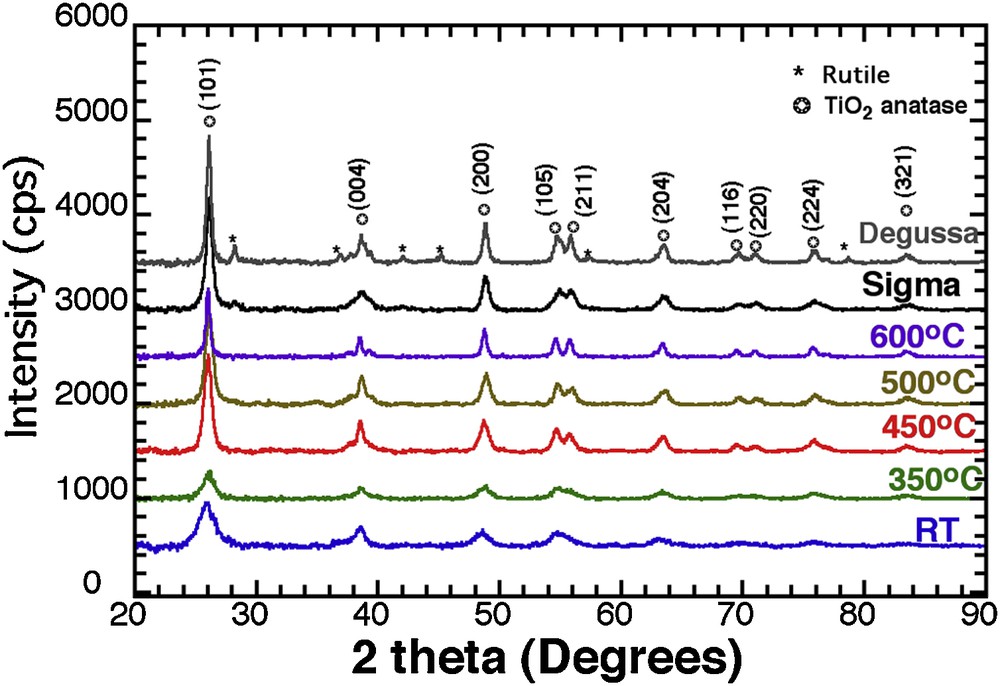
XRD patterns for TiO2 anatase at RT, T350, T450, T500, T600, and commercial TiO2 (Degussa™, and Sigma™).
The nitrogen isotherm (Supplementary data, Fig. S1) indicates that all samples, (as-synthesised, thermally treated, commercial) have a mesoporous structure with structural porosity marked by a significant specific surface area (ss) and porous volume (vol).
This is observed with T350 (ss: 144 m2.g−1; vol: 0.4 cm3.g−1), T450 (ss: 123 m2.g−1; vol: 0.4 cm3.g−1), and T500 (ss: 109 m2.g−1; vol: 0.34 cm3.g−1). The surface area decreased significantly after the sample was calcined at relatively high temperatures, but the major changes appears between 500 and 600 °C, with a drastic reduction of specific surface area (ss: 48 m2.g−1) and porous volume (vol: 0.15 cm3.g−1) for T600. FTIR analysis was carried out to investigate the presence of surface hydroxyl groups (Supplementary data, Fig. S2), and the comparison between the commercial powders and our samples did not display any major difference. FTIR spectra show a very broad band at 3400 cm−1, characteristic of O–H stretching of adsorbed water molecules along with one at 1630 cm−1, assigned to the H2O bending mode. A strong and representative broad band attributed to Ti–O stretching modes is seen from 400 to 700 cm−1, and an additional peak due to the O–H stretching mode of titanium-coordinated water molecules is observed at 3840 cm−1. With a rise in temperature from 25 to 500∘C, the progressive dehydration is illustrated by the reduction of the peak at 3400 cm−1, owing to the decrease in the surface hydroxyl groups on the surface of TiO2. TEM observations confirm the nanocrystalline structure (Supplementary data, Fig. S3).
3.2 Photodegradation with RT-TiO2
The potential efficiency of RT-TiO2 nanoparticles toward MB photocatalytic degradation was verified by several tests of a 20 ppm MB solution with (5, 10, 20, 50, 100 mg in 25 mL) TiO2, at pH = 6 under atmospheric pressure. No dye degradation was observed prior to the catalyst load, as for the MB solution left under UV with no catalyst. Before testing, the MB solutions with catalyst were kept in the dark overnight, and did not show any measurable decrease in the dye absorbance. The MB solution alone submitted to the same UV irradiation remains unchanged. The % of MB degradation as a function of time, for different amounts of RT-TiO2 (in 25 mL), is reported in Fig. 2.

Photocatalytic degradation of RT-TiO2 at different concentrations. Insert: % degradation after 300 min. Lines: 3rd degree polynomial fit.
All suspensions display the same, almost linearly, increasing of MB degradation with time, but the slopes of the curves depend on the amount of TiO2. From 5 to 50 mg, this photodegradation increases with increasing TiO2, but the photocatalytic activity of the 100 mg sample is very low. We plotted the MB % degradation after 300 min as a function of the catalyst amount (Fig. 2): a linear correlation is observed up to 20 mg of TiO2, as a proof that for the smallest amount, adding catalyst increases proportionally the photocatalytic yield. This effect remains restricted to 20 mg, as seen for the 50 mg sample that does not improve significantly the reaction. Moreover, increasing again the TiO2 concentration up to 100 mg leads to a limited photodegradation. RT-TiO2 offers small particle size and a high specific surface area (190 m2.g−1), which plays an important role in the catalytic activity by providing a higher surface for reaction. As the catalyst concentration increases, TiO2 particles will shield light, which will prevent light to penetrate further into the reaction vial (the reacting medium thickness was 0.5 cm, with the UV-light on the top).
As photocatalysis is a surface phenomena, and very sensitive to chemical species attached to the surface or part of the TiO2 framework, an excess of OH groups, not only affects the material band gap [10], but it also causes a detrimental effect of the photocatalytic oxidation, but small quantities are essential for sustained reaction [13,14]. The band gap excitation of TiO2 results in the generation of excitons (electron/hole pairs) that migrate to the surface of TiO2, in which a redox reaction occurs. The oxidation of the pollutants takes place through a surface-bounded hydroxyl radical (TiIVOH*+) [15,16], a strong oxidising agent produced by the interaction of photogenerated valence band holes and a surface bound OH− group TiIV(OH−), with a multiple step reaction mechanism [15], as observed with other metal oxides [17]. The experimental curves of MB degradation were used to propose a surface response model (Supplementary data, Fig. S4) from which we deduced that there is limits in photocatalysis efficiency of the RT-TiO2 sample, with a maximum of degradation at 45% after 280 min and an optimum of catalyst mass around 50 mg (Supplementary data, Fig. S5).
3.3 Photodegradation with thermally activated TiO2
The band gap and the amount of surface hydroxyl groups have a major effect on photocatalytic activity, and it was demonstrated that TiO2 prepared with a lower band gap contributed to increased catalytic activity [18], as a result of a higher photon absorption. Quantum size effects were thought to be responsible for the high photoactivity achieved on the nanoscale TiO2 catalysts prepared by sol–gel methods [14], and the influence of the semiconductor size on photocatalytic efficiency was reported in many works [15,19,20]. We used the ability of our synthesis process to adapt the band gap and crystal size by thermal treatment [10] to probe the influence of these parameters on the photodegradation efficiency of MB. The relationship between the post-treatment of our material and the resulting band gap is displayed in Supplementary data, Fig. S6 (for comparison: P25 Degussa™ = 3.1 eV; Sigma™ = 3.2 eV). Fig. 3 displays the photocatalytic degradation of MB (20 ppm) with a 100 mg suspension of RT-TiO2 thermally activated at 350 °C (T350), 450 °C (T450), and 500 °C (T500), respectively.
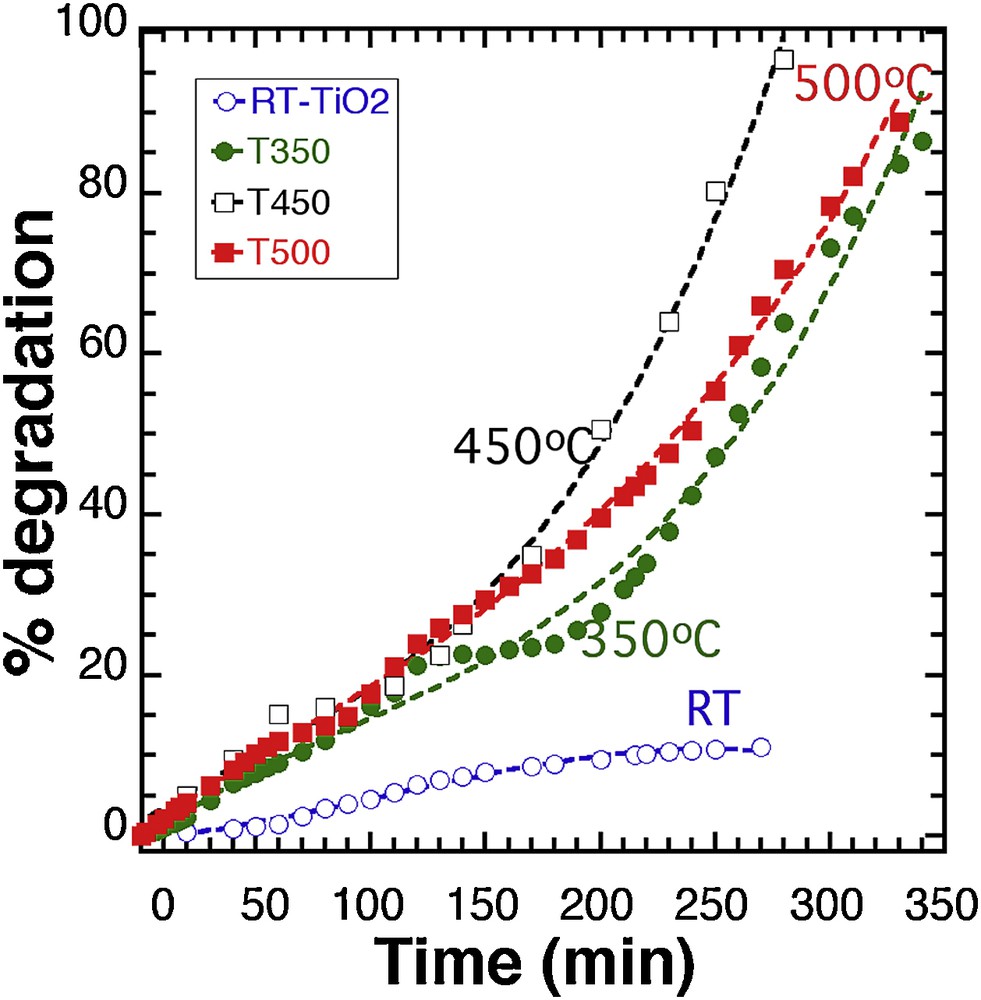
Photocatalytic degradation of a 100 mg suspension of TiO2 (our synthesis) thermally treated at different temperatures. Lines: 3rd degree polynomial fit.
Based on previous results, the 100 mg sample was chosen as it exhibits the lowest photocatalytic activity, which allowed us to better evaluate any actual improvement. It is clear that the thermal activation has a strong influence on the photodegradation yield, with the best result after 270 min being observed with T450 (90%), to be compared with the 10% yield initially obtained with RT-TiO2 after the same time. T350 and T500 offer a better efficiency than the RT sample, with 58% and 65.7% degradation after 270 min, respectively, and almost complete reaction after 350 min. However, the comparison between T450 and T500 demonstrates that the improvement based on temperature activation has a limited effect.
As confirmed by Supplementary data, Fig. S7 that displays the whole response map modeling of the photodegradation % as a function of time and activation temperature, it was deduced from the 3rd degree polynomial fitting of experimental curves in Fig. 3 (see Supplementary data, Fig. S8 for polynomial parameters fits) that as the temperature increases, the reaction yield increases up to 400–450 °C, where it reaches an almost steady value.
Applying temperature up to 450 °C has a limited impact on the crystal size, the average crystal size increasing only from 4 to 5 nm (Supplementary data, Fig.S6a), but it affects the band gap in a more important way (Supplementary data, Fig. S6b) with its value decreasing from 3.2 to 3.1 eV. In parallel, the sample crystallinity increases (Fig. 1) with a favourable growth of the {00l} family planes (see the {004}), which was identified as the best crystalline planes for photocatalytic activity [8]. As a result, the 450 °C thermal activation offers the best compromise between improving the crystallinity and reducing the band gap without increasing the crystal size.
The photocatalytic activity of nanoparticles is a surface phenomena, and very sensitive to chemical species attached to the surface of TiO2. An excess of OH groups causes a detrimental effect of the photocatalytic oxidation, but small quantities are essential for sustained reaction [14,21]. Hence, the catalytic activity results also from a fine balance between crystallinity, surface area and surface nature. We conclude that the TiO2 anatase prepared according to our method, and activated at 450 °C, offers the best compromise, with an optimal quantity of surface hydroxyl groups, and optimal surface area. Additional investigations were done for thermally treated sample at 600 °C and the result showed a very low degradation rate as a result of an abrupt decrease in the surface area and the amount of the hydroxyl groups (Supplementary data, Fig. S9).
3.4 Influence of the catalyst amount
To determine the optimum concentration of the catalyst so that using an ineffective excess amount is avoided, a series of experiments were conducted for various catalyst concentrations from 5 mg to 300 mg (for a 25 mL volume).
Fig. 4 illustrates the effect of catalyst concentration on the photodegradation ratio of methylene blue. Except for the 200 mg sample, which presents a small discrepancy with the whole series, all curves are rather similar but slightly steeper curves are actually observed for mass of T450 in the 50 mg range. This trend is still better illustrated with the 3D mapping deduced from the 3rd degree polynomial fitting (Supplementary data, Fig. S10) displayed in Supplementary data, Fig. 11.
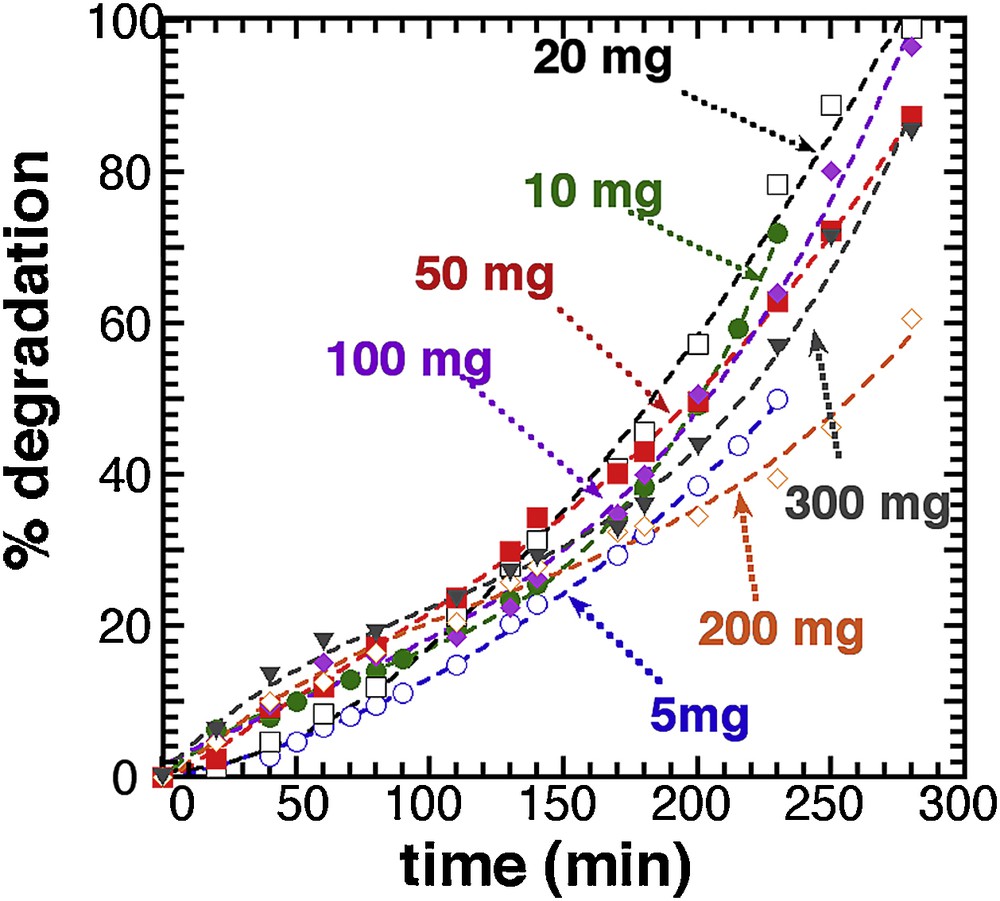
Photocatalytic degradation of different mass of T450. Lines: 3rd degree polynomial fit.
Compared with RT-TiO2 (Fig. 2), the thermal activation at 450 °C has almost leveled all the mass effect, and a 100% photodegradation yield is achieved with small amounts of photocatalyst, an optimum being around 20 mg (for 25 mL). Following this observation, all further analyses were carried out with a 20 mg T450 sample concentration.
Optimal concentration of the catalyst depends also on the working conditions and the incident radiation reflux [22–24]. According to the rate equation, the decomposition rate is expected to be directly proportional to the TiO2 concentration, which seems to be contradicted by our results. However, the concentration of TiO2 is not the only parameter as the reaction depends both on the availability of active sites on the TiO2 surface – which depends on the nature and structure of TiO2 – and on the intensity of light that actually reaches the surface of the catalyst– which depends on the optical path in the solution [25]. If the concentration of a given material increases, the amount of active sites increases, but the light penetration decreases due to the screening effect that masks part of the photosensitive surface [24,26,27].
3.5 Kinetic study
The reaction kinetic of photocatalytic oxidation of dyes over illuminated TiO2 is determined according to many parameters, for example, light intensity, concentration, and surface area. However, the combined effects of these variables are rather complex and require much in-depth analysis. These kinds of reactions are often described by first order decay kinetics, and previous studies showed that the photocatalytic degradation rate of textile dyes in heterogeneous photocatalytic oxidation systems under UV-light irradiation could be well explained in terms of the Langmuir–Hinshelwood mechanism [28–31]:
| (2) |
However, for diluted solutions (C < 10−3 M), KC becomes << 1, and the reaction is of the apparent first order, whereas for C > 5.10−3 M, (KC >> 1), the reaction rate is of the zero order [32]. In addition, the zero-order rate was observed for different systems, such as colloidal CdS (EG = 2.4 eV) for the degradation of methyl orange [33], modified doped TiO2 for the degradation of oxalic acid [34], and TiO2 doped by rare earth metals for the decomposition of nitrite [35]. The zero-order rate equation is as follows:
| (3) |
We used a set of experiments, with reaction parameters being [MB] = 20 ppm, pH = 6, T = 25 °C, and T450, and we tested the different kinetic orders expected from the evolution in MB concentration as a function of time, for a catalyst load, varying from 5 mg to 300 mg (in 25 mL). According to the kinetic order, a linear evolution of Ct = f(t) will mark a zero-order kinetic, a linear evolution of ln(Ct) = f(t) a first order, and a linear evolution of 1/Ct = f(t) a second order. All curves and linear fits are displayed in Supplementary data, Fig. S12I(A to D), and the reliability parameter R2 in Table S1, Supplementary data. Except for the 200 mg sample, where a different behaviour was already reported (Fig. 4), all the curves are better fitted with the zero-order model, which means that the concentration of MB has no influence on the reaction kinetics. Fig. 5 displays the evolution of 102.k, the kinetic constant, as a function of the mass of catalyst. This result illustrates that the best conformation for a high kinetic is to use the T450 material with a concentration of 0.8 g.L−1 (20 mg in 25 mL).
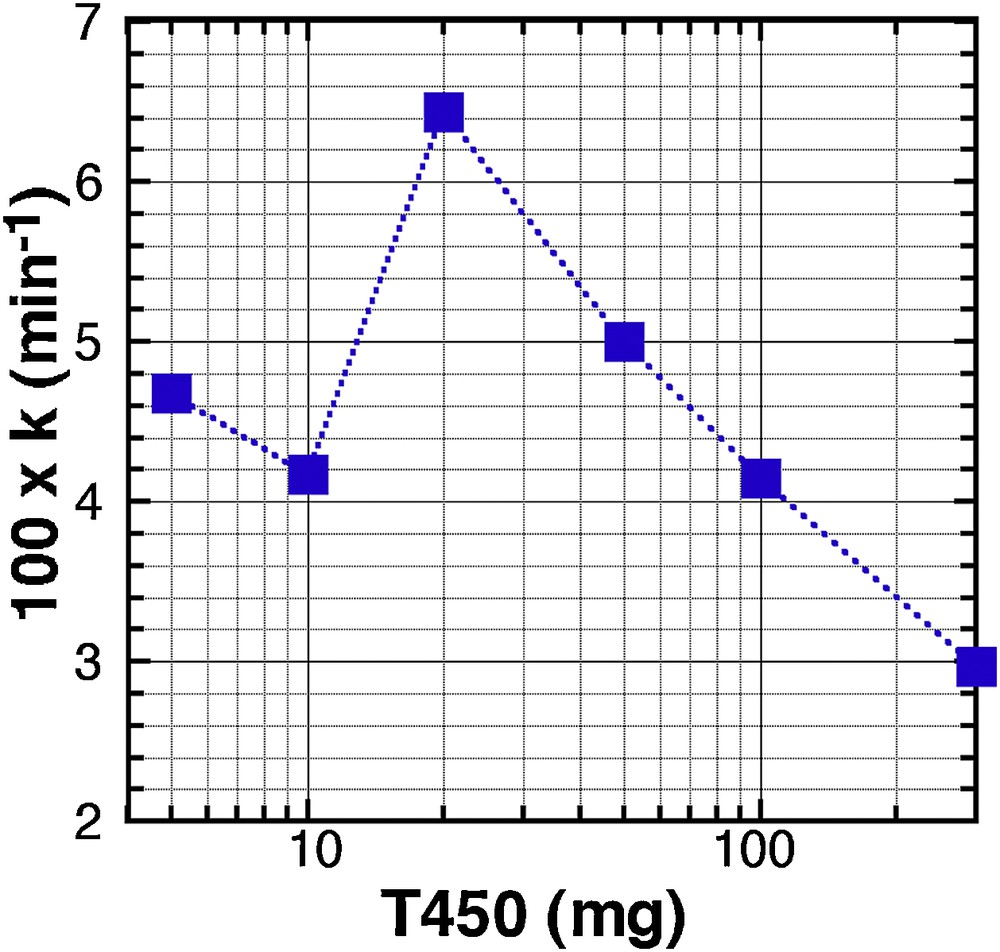
Evolution of the kinetic constant k, calculated for a zero-order kinetics, as a function of the mass of T450 catalyst used in 25 mL.
3.6 Influence of the dye concentration
We tested the zero-order kinetic model by running photocatalytic tests with 20 mg of T450 in 25 mL, for different initial concentrations in MB (4.8, 9.6 and 20 ppm) (Fig. 6). The zero-order model is confirmed for all concentrations and similar kinetic constants (9.4 10−2 and 9.6 10−2 min−1 for 4.8 and 9.6 ppm, respectively) are found for low concentrations, with actually a higher value for the 9.6 ppm sample. These kinetic constants are higher than that found for the 20 ppm MB solution (6.0 10−2 min−1). These differences are not relevant to the photocatalyst itself because it has been demonstrated that the dye concentration has a contradictory influence on the photocatalytic rate [36,37]. The degradation rate depends on the amount of hydroxyl radical formed on the surface of the catalyst, and the probability of these groups to react with the dye molecules. As a result, as the initial concentration of the dye increases from 4.8 to 9.6 ppm, the probability of interaction between the dye and the hydroxyl radical increases, which result in a higher constant value. However, increasing further the dye concentration above certain levels decreases the degradation efficiency [38], because of a higher light screening resulting from the high concentration in methylene blue. This shielding effect reduces the quantity of effective photons accessing the catalyst surface to produce the electron-hole pairs [39].
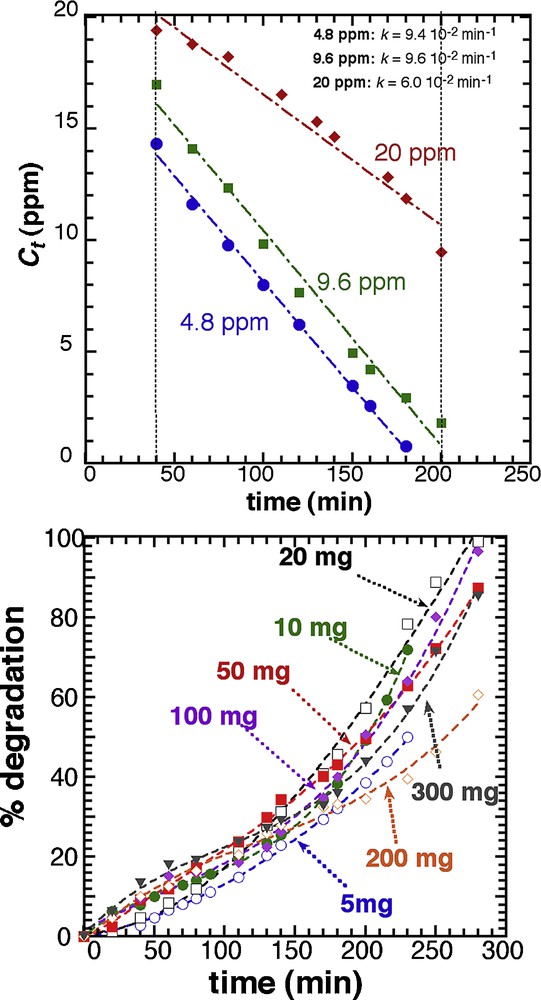
Zero-order fit of the evolution of the methylene blue concentration as a function of time for different values of the initial concentrations in MB (4.8, 9.6, 20.0 ppm), with 20 mg (in 25 mL) of T450.
It can be concluded that the higher kinetics can be achieved with 20 mg of T450 and a concentration in dye of 10 ppm. Nevertheless, it is worth mentioning that the absolute efficiency of the photocatalyst is higher for the 20 ppm solution since 10 ppm are destroyed after 200 min, whereas only 4.8 ppm are destroyed after 180 min for the lowest dye concentration.
3.7 Influence of pH
As pH is a major factor with a significant effect on the rate of photocatalytic reaction, and as it can modify the rate of hydroxyl radical at the surface of the photocatalyst [40,41], we carried out photocatalytic tests with solution set at different pH values (2, 6, and 9) (Fig. 7). All other operative conditions remained constant; the T450 catalyst load was fixed at 20 mg in 25 mL (0.8 g.L−1), and the methylene blue concentration was set to 20 ppm.
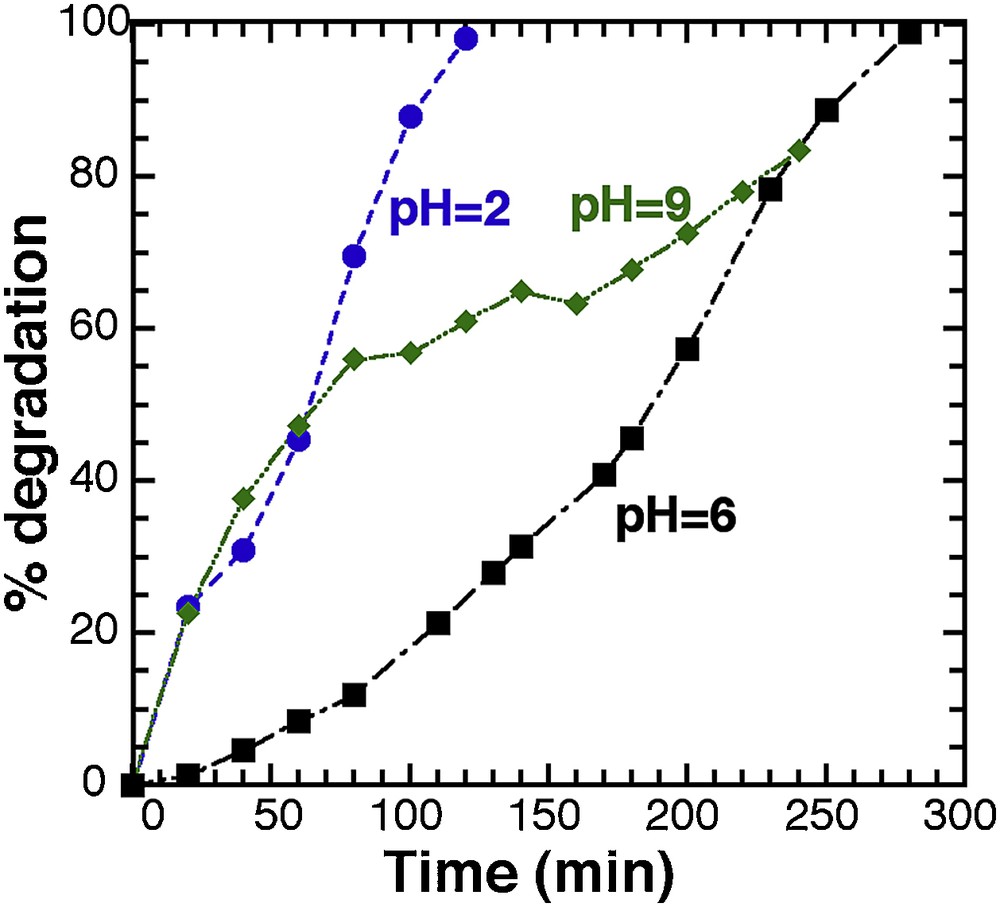
Evolution of the photodegradation for T450 (20 mG in 25 mL) at different pH values.
Photodegradation at neutral pH (pH 6) is completed after 300 min, and specific adsorption of dye onto the TiO2 powder was observed (the powder remains white). The same test with basic conditions (pH 9) reveals first a steep increase of the curve, but it is the result of specific adsorption of the dye molecules onto the powder (the powder turns blue). After 120 min, the adsorption is completed and only photocatalytic degradation takes place, leading finally to the same reaction time for full degradation as for the neutral solution. The highest degradation efficiency is observed for pH = 2, without any noticeable adsorption of the dye, and a full degradation being achieved only after 100 min. It is worth mentioning that the initial degradation rate with the same amount of material (RT-TiO2) and neutral media led only to a 48% degradation yield after 350 min (Fig. 2).
Not only does the pH affect the surface state of titania, but also the ionisation state of the ionised dye molecule [42]. Interaction between the dye molecule depends both on the pH value and the iso-electrical point (IEP) of TiO2. The IEP value is usually reported in the 5.0–7.0 pH range, depending on the origin of TiO2 [43]. Above the IEP, the surface of TiO2 is negatively charged, and the ammonium group (Supplementary data, Fig. S1) of the methylene blue molecule can interact with. As a result, the dye adsorption increases in the alkaline media as the electrostatic attraction increases between the cationic MB molecules and the negative TiO2 surface. At low pH, under the IEP, there is no adsorption but the anionic electron donors and electron acceptors are favoured [39]. This effect is limited at very low pH when an excess of H+ induces repulsion between the dye molecules and the positive surface of TiO2. The positive impact of acidic pH (pH 2) combines the formation of free radicals (●O2−, ●OOH) at the surface of the solid, with the creation of intermediate SO42− groups in the MB molecule, the result being an enhance interaction between the negative intermediate sulphate group on MB, with the positive charge on TiO2, that improves the whole photodegradation process as MB molecules are stabilised on the TiO2 surface until full degradation.
3.8 Comparison with commercial TiO2
Experiments were carried out under UV with 20 ppm dye concentration and 0.8 g.L−1 (20 mG in 25 mL) catalyst load at two different pH values (2 and 6), over T450, and compared to two commercial titania oxides: Sigma™, which is pure anatase, from Sigma™, and a 30% rutile:70% anatase material from Degussa™ (Fig. 8). The commercial anatase (Sigma™) was chosen as it has the same specific surface area (126 m2.g−1) as T450, and the Degussa™ product as it is until today, the best commercial photocatalyst, and always taken as a reference.
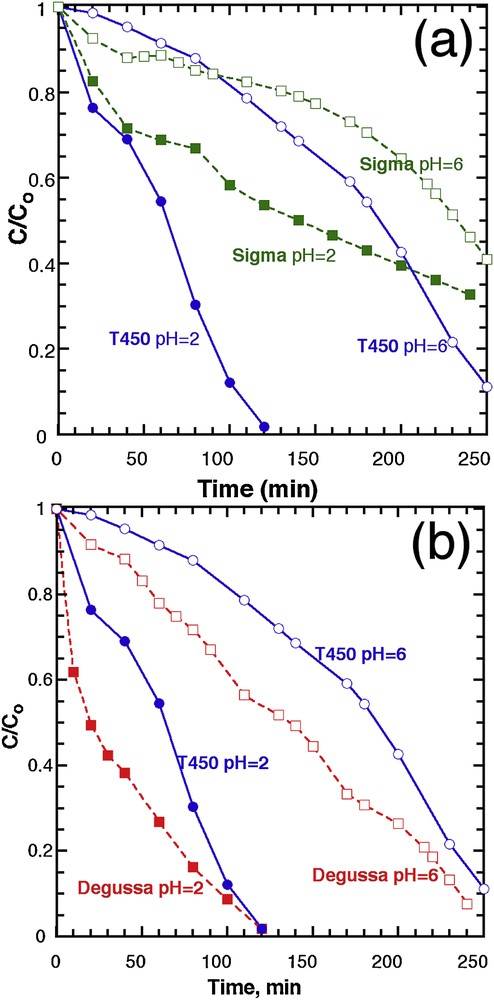
Evolution of the concentration in MB, normalised to the initial value, as a function of time, for T450 and (a) Sigma™ titanium oxide and (b) Degussa™ titanium oxide.
When compared with Sigma™ (Fig. 8a), T450 exhibits a better photocatalytic efficiency, whatever the pH, even if both the crystalline nature and the specific surface area are similar for both. The close comparison of the two XRD patterns (Fig. 1) reveals similar diffraction patterns, except for one peak, at 38° where the crystal growth was enhanced along the [001] direction with preferred anisotropic growth perpendicular to the c-axis [44]. This growth is indicated by the strong peak intensity and narrow width of the (004) reflection for T450, whereas a relatively lower intensity and broader width for Sigma™ is reported.
It has been widely reported that the (001) plan is more active than the (101) plan, owing to the low atomic coordination numbers of exposed atoms and the wide bond angle of Ti–O–Ti [45]. Zhang et al. reported that the (001) plan for anatase TiO2 microspheres is 1.5 times more active than the (101) of the same spheres [46]. Therefore, we think that the main reason for the higher photocatalytic activity of our sample (T450) compared to the commercial one (Sigma™) is the difference in crystal growth.
We also compared our sample T450 to another commercial TiO2, Degussa™, which is a combination of anatase and rutile (Fig. 8b). This test reveals that the Degussa™ photocatalyst shows a better photoactivity throughout the reaction, than T450, at pH 6, but both achieve almost full degradation after 250 min. At pH 2, the rate of reaction is higher for Degussa™ than T450, for the first 60 min, but again, T450 compares well with the reference, at the full completion of photodegradation.
Overall, the Degussa™ materials still offer a better photodegradation rate, especially at the beginning of the reaction, which can be possibly ascribed to the specific anatase/rutile heterostructure displayed by this material. Owing to the difference of the band edges between anatase and rutile where the anatase is more negative (0.2 eV), rutile works as an electron sink that facilitates the interfacial electron transfer. The photogenerated electrons coming from the anatase conduction band to the rutile conduction band can be scavenged by the oxygen molecules, forming superoxide radicals to oxidise the dye molecules. On the other hand, the holes on the anatase valence band can also oxidise the dye molecules; consequently, the charge carrier separation efficiency increases leading to an improvement of the catalytic activity. Moreover, rutile can play the role of an antenna that transfers the photoelectrons from rutile to anatase trapping sites that have lower energy [47]. We also tested the effect of increasing the catalyst load to 100 mg on the degradation efficiency at pH = 6 and by comparing commercial powders with T450 (Supplementary data, Fig. S13). As we increase the catalyst load to 100 mg, all activities become normalized by the light shielding effect, and the photocatalytic efficiency is limited by light instead than the material performance.
4 Conclusions
The pure anatase titanium oxide synthesised for this study has demonstrated very efficient photocatalysis, equal to the commercial material used as a reference, when both material and process parameters are optimised. These parameters are:
- • a small size of particles that allow for a high surface access;
- • an improvement of the crystalline structure by the suitable thermal treatment that allows one to enhance crystallinity without increasing the crystal size;
- • an amount of catalyst that does not limit the whole reaction but does not shield light;
- • if possible an mild acidity to favour the creation of radicals.
When all these parameters are optimised, the photocatalytic behaviour is overall, similar to that of the best commercial material (Degussa™ P25) that exhibits in addition a rutile:anatase heterostructure. This heterostructure is very important to improve the stability of the electron-hole pair. Therefore, our next work will explore the possibility to generate heterostructures from the pure anatase TiO2 material tested in this study.
Acknowledgments
This research was support by theCanadian NSERC Discovery fund. A.H. thanks the Egyptian Ministry for Higher Education and Scientific Research for funding support.