

1 Introduction
Dithiocarbamates are versatile ligands and display a broad variety of coordination patterns, leading to a great diversity of molecular and supramolecular structures [1,2]. With regards to structural studies, these ligands display bidentate coordination patterns, which may be isobidentate or anisobidentate both in chelating and bridging situations. In contrast to this, a few monodentate complexes are also reported [3,4]. In addition to peculiar structural properties, dithiocarbamates have been widely used in analytical chemistry as complexing agents [1,5], oxidants of organic molecules [6], fungicides, pesticides and insecticides in agriculture [7,8], in medicine as anti-alcoholic drug [9,10], tuberculostatic [11] and as co-adjuvant in AIDS treatment [12] and metal dithiocarbamate complexes are useful for preparing nanoparticles and nanowires of a variety of semiconducting materials [13]. Various metal dithiocarbamate complexes have been investigated as precursors in metal organic chemical vapour deposition [14–16].
Mercury sulfide nanoparticles belong to group-II–VI semiconductors. HgS usually crystallizes in two forms: the cubic phase (β-HgS, metacinnabar) and the hexagonal phase (α-phase, cinnabar). α-HgS is a wide-band-gap semiconductor (Eg = 2.0 eV), but it converts into β-HgS at temperatures above 344 °C and becomes a narrow-band-gap semimetal (Eg = 0.5 eV) [17]. Because of the narrow band gap of HgS, it is a promising material for catalysts and infrared detectors [18]. In addition, mercury sulfide is a useful material with wide applications in many fields, such as ultrasonic transducers, image sensors, electrostatic image materials, light emitting, and photoelectric conversion devices [19–21].
Due to the interesting structural variations of metal dithiocarbamate complexes and applications of HgS nanoparticles and as extension of our previous findings [22–24], we report in this paper the synthesis, as well as spectral and single-crystal X-ray structural studies of 1 and 2. The conversion of the complex 1 into HgS nanoparticles and their characterization are also presented.
2 Experimental
All reagents and solvents were commercially available high-grade materials (Merck/Sd fine/Himedia), and were used as received. Elemental analysis was performed using PerkinElmer's 2400 series II CHN analyser. IR spectra were recorded on a Thermo Nicolet Avatar 330 FT–IR spectrophotometer (range 400–4000 cm−1) as KBr pellets. The NMR spectra of complexes 1 and 2 were recorded in Bruker 500 MHz and Bruker 400 MHz NMR spectrometers, respectively at room temperature in CDCl3, using TMS as an internal reference. The 13C NMR spectra were recorded in the proton decoupled mode. The structures of the ligands are shown in Fig. 1. The powder X-ray diffraction (XRD) patterns of the samples were recorded at room temperature using Bruker D8 Advance X-ray diffraction system with Cu Kα radiation. The surface morphology study was performed using Hitachi SU6600 field emission scanning electron microscope (FESEM). A Shimadzu UV-1650 PC double-beam UV–visible spectrophotometer and PerkinElmer LS55 spectroflurimeter were used for recording electronic spectra and fluorescence spectra, respectively.

Structure of the ligands.
2.1 X-ray crystallography
Diffraction data for 1 and 2 were recorded on Bruker axis Kappa apex II and Xcalibur, Sapphire 3 diffractometers, respectively, using graphite-monochromated Mo Kα radiation (λ = 0.71073 Å) at ambient temperature. The structure was solved by SIR92 [25] and refined by full-matrix least-square methods in SHELXL-97 [26]. All non-hydrogen atoms were refined anisotropically and hydrogen atoms were refined isotropically. Details of the crystal data and structure refinement parameters for 1 and 2 are summarized in Table 1.
Crystal data, data collection and refinement parameters for 1 and 2.
| [Hg(bzfdtc)2] (1) | [Hg(dfdtc)2] (2) | |
| Empirical formula | C26H24HgN2O2S4 | C22H20HgN2O4S4 |
| FW | 725.30 | 705.23 |
| Crystal dimensions (mm) | 0.30 × 0.25 × 0.20 | 0.2 × 0.15 × 0.1 |
| Crystal system | Triclinic | Orthorhombic |
| Space group | P | Pbca |
| a (Å) | 9.4625(3) | 14.7396(10) |
| b (Å) | 16.1422(5) | 16.7160(10) |
| c (Å) | 17.7504(6) | 18.8546(10) |
| α (°) | 84.038(2) | 90.00 |
| β (°) | 81.765(2) | 90.00 |
| γ (°) | 86.316(2) | 90.00 |
| V (Å3) | 2665.47(15) | 4645.5(5) |
| Z | 4 | 8 |
| Dc (g cm−3) | 1.807 | 2.017 |
| μ (cm−1) | 6.115 | 7.020 |
| F(000) | 1416 | 2736 |
| λ (Å) | Mo Kα (0.71073) | Mo Kα (0.71073) |
| θ range (°) | 1.16–28.12 | 4.27–30.91 |
| Index ranges | –12 ≤ h ≤ 12 –20 ≤ k ≤ 21 –23 ≤ l ≤ 21 | –14 ≤ h ≤ 14 –12 ≤ k ≤ 12 –22 ≤ l ≤ 22 |
| Reflections collected | 57,722 | 59,021 |
| Observed reflections [I > 2 σ(I)] | 4189 | 5672 |
| Weighting scheme | Calc. W = 1/(σ2(Fo2) + (0.0931 p)2 + 0.0000 p) where p = (Fo2 + 2Fc2)/3 | Calc. W = 1/(σ2(Fo2) + (0.1000 p)2 + 0.8337 p) where p = (Fo2 + 2Fc2)/3 |
| Number of parameters refined | 631 | 298 |
| R[F2 > 2σ(F2)], wR(F2) | 0.0793, 0.2008 | 0.0493, 0.0897 |
| GOOF | 1.078 | 1.070 |
2.2 Preparation of amines
N-Benzyl-N-furfurylamine and N,N-difurfurylamine were prepared by general methods reported earlier [22].
2.3 Preparation of complex 1
N-Benzyl-N-furfurylamine (0.75 g, 4 mmol) and carbon disulphide (0.3 mL, 4 mmol) were dissolved in ethanol (20 mL) and stirred for 30 min at 5 °C. HgCl2 (0.54 g, 2.0 mmol) was dissolved in 20 mL of water and added to the solution. A pale yellow powder precipitated, which was filtered and dried (Scheme 1).

Preparation of the complexes.
Yield: 78%. mp 129–131 °C. IR (KBr, cm−1): 1013 (vC–S), 1459 (vC–N), 3052 (vC–H (aromatic)), 3112 (vC–H (furfuryl)), 1H NMR (500 MHz, CDCl3): δ = 5.16 (s, 4H, N–CH2–C6H5), 4.99 (s, 4H, CH2 (furfuryl)), 6.36–7.42 (aromatic protons). 13C NMR (125 MHz, CDCl3): δ = 59.1 (N–CH2–C6H5), 50.7 (CH2 (furfuryl)), 110.5–148.2 (aromatic carbons), 206.8 (CS2). Anal. calcd. for C26H24S4N2O2Hg (%); C 43.03; H 3.33; N 3.86. Found (%): C 42.81, H 3.27, N 3.78.
2.4 Preparation of complex 2
The same procedure was used as earlier described, except that N,N-difurfurylamine was used instead of N-benzyl-N-furfurylamine. Yield: 82%. mp 140–142 °C. IR (KBr, cm−1): γ = 1013 (vC–S), 1476 (vC–N), 3115 (vC–H (furfuryl)). 1H NMR (400 MHz, CDCl3): δ = 5.03 (s, 8 H, N–CH2 (furfuryl)), 6.38 (dd, 1 H, H–4 (furyl)), 6.45 (b, 1H, H–3 (furyl)), 7.43 (d, coupling constant 1H, H–5 (furyl)). 13C NMR (100 MHz, CDCl3): δ = 51.6 (N–CH2 (furfuryl)), 110.5, 110.6, 143, 148.2 (furyl ring carbons), 206.7 (CS2). Anal. calcd. for C22H20S4N2O4Hg (%); C 37.46; H 2.85; N 3.97. found (%): C 37.28; H 2.79; N 3.90.
2.5 Preparation of mercury sulfide (HgS1)
An amount of 0.5 g of 1 was dissolved in 15 mL of ethylenediamine in a 100-mL beaker and then the reaction was carried out under microwave irradiation for 2 min. The black precipitate obtained was filtered off and washed with methanol.
2.6 Preparation of mercury sulfide (HgS2)
An amount of 0.5 g of 1 was dissolved in 15 mL of ethylenediamine in a round-bottom flask, and then the flask was placed in a sonication bath (Equitron, 75 W) for 1 h. The black precipitate obtained was filtered off and washed with methanol.
3 Results and discussion
3.1 Infrared spectral studies
Important absorptions in the dithiocarbamate complexes are due to the vC–N (thiouride) and vC–S stretching modes. The thioureide band (1480–1600 cm−1) may be considered as an intermediate between single and double bonded C–N and its position indicates the shift of electron density toward the coordinating metal ion [27]. Based on Bonati and Ugo's [28] criterion, the presence of a solitary vC–S band in the 950–1050 cm−1 region is due to the bidentate coordination of the dithiocarbamato group, while the splitting of this band within a narrow range of 20 cm−1 is due to the monodentate nature of the dithiocarbamate group. In the present study, 1 and 2 show the vC–N thioureide band at 1459 and 1476 cm−1, respectively, which lies between the single- and double-bond energies, indicating the partial double bond character. The vC–S stretching vibrations are observed at 1013 cm−1 without any splitting, supporting the bidentate coordination of the dithiocarbamate ligand.
3.2 NMR spectral studies
3.2.1 1H NMR spectral studies
N-Benzyl-N-furfurylamine shows a signal at 3.83 ppm due to the methylene protons of benzyl and furfuryl groups, and N,N-difurfurylamine exhibits a singlet at 3.79 ppm due to the methylene protons of the furfuryl group (Figs. S1and S2). Two singlets observed at 4.99 and 5.16 ppm for 1 are assigned to the methylene protons of furfuryl and benzyl groups, respectively, and a singlet at 5.03 ppm for 2 is due to the methylene protons of furfuryl group. In both complexes, methylene protons are strongly deshielded on complexation compared to free amines (N-benzyl-N-furfurylamine and N,N-difurfurylamine). The observed deshielding of methylene protons is attributed to the release of electrons on the nitrogen of the NR2 groups, forcing high electron density toward the sulphur (or) the metal via the thioureide π-system [29]. Aromatic proton signals are not deshielded upon complexation because of the relative distance from the thioureide π-system and the metal centre.
3.2.2 13C NMR spectral studies
The carbon signals for furfuryl and benzyl methylene carbons appear at 50.7 and 59.1 ppm, respectively, for 1. In the case of complex 2, a signal observed in the aliphatic region (51.6 ppm) is assigned to the methylene carbon of the furfuryl group. In 1, the chemical shift values of the protons and carbon of methylene of the furfuryl group (4.99 ppm and 50.7 ppm) are lower than that of the methylene of the benzyl group (5.16 ppm and 59.1 ppm). This can be explained as follows: among the resonance structures, which involve the movement of the lone pair of electrons of the oxygen within the furyl ring, the prominent structure (Scheme 2c) must contribute to a greater extent than the other resonance structures. Hence, higher negative charge on the C-2 carbon of furyl increases the electron density on methylene of the furfuryl group. This lowers the chemical shift values of protons and carbon of the methylene of the furfuryl group. 1 and 2 show N13CS2 carbon signals at 206.8 and 206.7 ppm, respectively, indicating the contribution of the double bond character to a formally single N–C bond in the dithiocarbamate, i.e. the mixture of an sp2 hybridized state to the sp3 orbitals of nitrogen; a considerable δ+ surplus charge is localized on nitrogen, while δ– is delocalized through the four-member chelate ring CS2M [30] (Scheme 3). In both complexes, aromatic carbon signals appear in the region from 110.5 to 148.2 ppm.

Resonance structures of furyl ring in bzfdtc ligand.
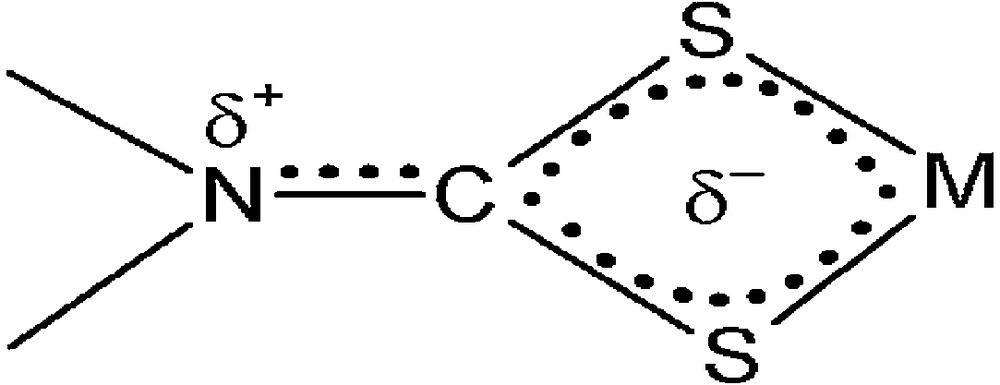
The charge distribution in a dithiocarbamate group with N–C partial double-bond character.
3.3 Single-crystal X-ray structural analysis of 1
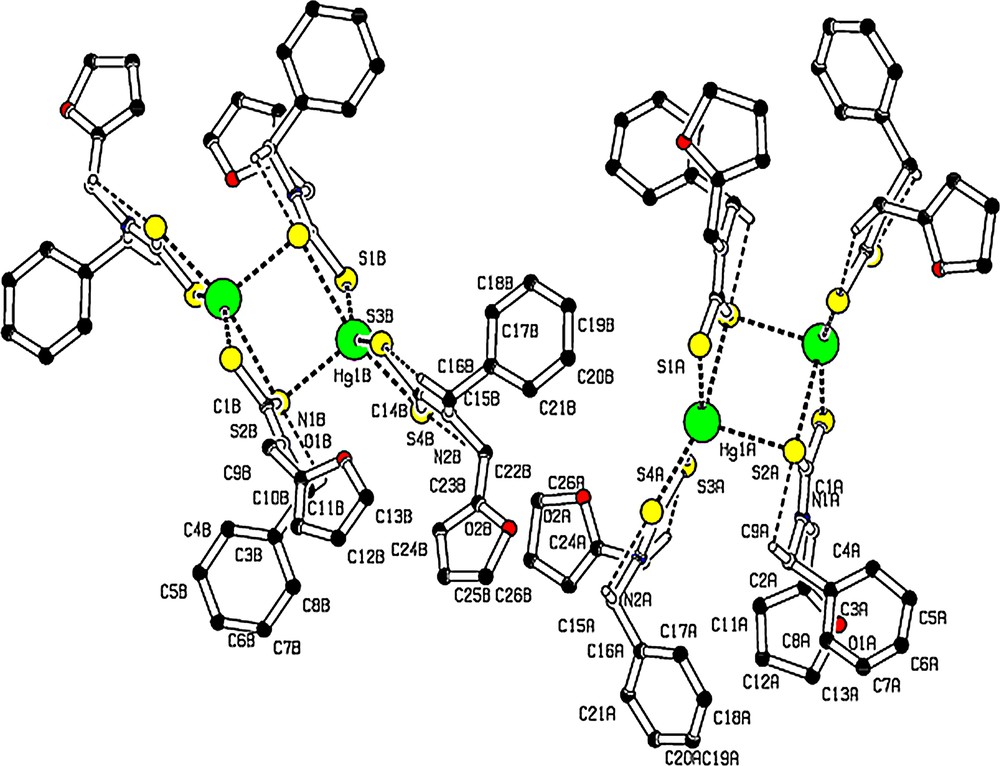
ORTEP graphs of [Hg(bzfdtc)2] are shown in Fig. 2. Selected bond lengths and angles for 1 and 2 are given in Table 2. The unit cell of [Hg(bzfdtc)2] is comprised of two centrosymmetric binuclear molecules [Hg2(bzfdtc)4] that, however, in spite of the considerable structural similarity, are structurally inequivalent to each other. Therefore, [Hg(bzfdtc)2] exists in the form of two isomeric binuclear molecules. One of them, hereafter denoted as the “A” molecule, contains Hg (1A) atoms, while the “B” molecule contains Hg (1B) atoms (see Table 2). The molecules A and B have different bond parameters. However, comparison of the bond parameters associated with “A” is valid for “B”. Therefore, in the following discussion, bond parameters associated with “A” are considered for comparison.

(Colour online.) ORTEP diagram of [Hg(bzfdtc)2].
Selected bond lengths (Å) and bond angles (°) for the complexes 1 and 2.
| [Hg(bzfdtc)2] (1) | [Hg(dfdtc)2] (2) | ||
| Hg(1A)–S(1A) | 2.4221(13) | Hg01–S3 | 2.4504(9) |
| Hg(1A)–S(3A) | 2.4981(14) | Hg01–S2 | 2.4729(10) |
| Hg(1A)–S(4A) | 2.7020(13) | Hg01–S4 | 2.6355(10) |
| Hg(1A)–S(2A) | 2.7614(15) | Hg01–S1 | 2.7481(10) |
| Hg(1A)–S(2Aa) | 3.096(15) | S1–C1 | 1.710(4) |
| S(1A)–C(1A)#1 | 1.734(5) | S2–C1 | 1.737(4) |
| S(2A)–C(1A) | 1.709(5) | S3–C12 | 1.730(4) |
| S(3A)–C(14A) | 1.726(5) | S4–C12 | 1.736(4) |
| S(4A)–C(14A) | 1.707(5) | N1–C1 | 1.324(5) |
| N(1A)–C(1A) | 1.329(6) | N1–C2 | 1.458(5) |
| Hg(1B)–S(1B) | 2.4230(17) | N1–C3 | 1.477(5) |
| Hg(1B)–S(3B) | 2.5121(16) | N2–C12 | 1.315(5) |
| Hg(1B)–S(4B) | 2.6409(16) | N2–C14 | 1.485(5) |
| Hg(1B)–S(2B) | 2.6764(14) | N2–C13 | 1.492(5) |
| S(1B)–C(1B)#2 | 1.727(6) | S3–Hg01–S2 | 144.60(3) |
| S(2B)–C(1B) | 1.720(5) | S3–Hg01–S4 | 103.83(3) |
| N(1B)–C(1B) | 1.312(7) | S2–Hg01–S4 | 108.87(3) |
| S(1A)–Hg(1A)–S(3A) | 150.31(5) | S3–Hg01–S1 | 118.16(3) |
| S(1A)–Hg(1A)–S(4A) | 125.73(4) | S2–Hg01–S1 | 69.42(3) |
| S(3A)–Hg(1A)–S(4A) | 68.89(4) | S4–Hg01–S1 | 99.66(3) |
| S(1A)–Hg(1A)–S(2A) | 97.52(5) | C1–S1–Hg01 | 81.28(13) |
| S(3A)–Hg(1A)–S(2A) | 103.24(5) | C1–S2–Hg01 | 89.46(13) |
| S(4A)–Hg(1A)–S(2A) | 104.75(5) | C12–S3–Hg01 | 96.67(13) |
| N(1A)–C(1A)–S(2A) | 122.3(4) | C12–S4–Hg01 | 98.33(12) |
| N(1A)–C(1A)–S(1A)#1 | 117.3(4) | ||
| S(2A)–C(1A)–S(1A)#1 | 120.3(3) | ||
| S(1B)–Hg(1B)–S(3B) | 142.53(6) | ||
| S(1B)–Hg(1B)–S(4B) | 124.70(5) | ||
| S(3B)–Hg(1B)–S(4B) | 69.90(5) | ||
| S(1B)–Hg(1B)–S(2B) | 105.40(5) | ||
| S(3B)–Hg(1B)–S(2B) | 104.95(5) | ||
| S(4B)–Hg(1B)–S(2B) | 100.18(5) | ||
| S(1B)–Hg(1B)–S(3B) | 142.53(6) | ||
| S(1B)–Hg(1B)–S(4B) | 124.70(5) | ||
| S(3B)–Hg(1B)–S(4B) | 69.90(5) | ||
| S(1B)–Hg(1B)–S(2B) | 105.40(5) | ||
| S(3B)–Hg(1B)–S(2B) | 104.95(5) | ||
| S(4B)–Hg(1B)–S(2B) | 100.18(5) | ||
| S(3B)–C(14B)–S(4B) | 118.7(3) |
In the binuclear molecule, [Hg2(bzfdtc)4], the mononuclear moieties [Hg(bzfdtc)2] are combined by two additional Hg–S bonds. Thus, each one of these molecules incorporates two bzfdtc ligands with a combined (i.e. tridentate bridging) structural function. Each of the other two ligands serves as a bidentate terminal (i.e. chelating) ligand, the binding of the bidentate terminal dithiocarbamate ligand, described as anisobidentate by virtue of one of the Hg–S bond distances, being longer than the other one (2.4981(14) and 2.7020(13) Å for Hg(1A)–S(3A) and Hg(1A)–S(4A), respectively). The ligands with the combined structural function, which are coordinated to two mercury atoms, form an extended eight-membered tricyclic moiety [Hg2S4C2], whose geometry can be approximated by a chair conformation.
The Hg–S bond length values are all within the range of 2.422–3.096 Å, which confirms the five-fold coordination [S5] of the mercury atom. The geometry of the mercury coordination polyhedron is intermediate between a tetragonal pyramid (TP) and trigonal bipyramid (TBP). To quantitatively characterize the coordination polyhedra in complexes with coordination number = 5, the parameter τ = (α – β)/60 is used [31] (in our case, α and β are the two largest S–Hg–S angles, α > β). In an ideal TP (C4v), τ = 0 since α = β. In a regular TBP (C3v), the axial S–Hg–S angle (α) is equal to 180°, while the equatorial angle (β) is 120°, giving rise to τ = 1; polyhedra with contributions from both the TP and TBP correspond to τ values falling within the range from 0 to 1. In [Hg(bzfdtc)2], the two largest S–Hg–S angles are equal to 150.31(5°) and 125.73(4°). Therefore, τ = 0.41, which point to intermediate (between ideal TP and TBP) geometries of the mercury coordination polyhedra. From the τ value, the coordination geometry is described as being 41% along the pathway of distortion from tetragonal pyramidal toward trigonal bipyramid.
Thus, the essential structural similarity of the molecules “A” and “B” in combination with small structural differences (Table 2) allowed us to classify them as conformational isomers (when the equilibrium state of the polyatomic molecular system is achieved in two or several energetically closely spaced and simultaneously existing spatial forms).
Weak intramolecular C–H…S hydrogen bonding is observed in [Hg(bzfdtc)2] (Fig. 3, Table 3) and intermolecular C–H…S hydrogen bonds form a C(9) chain in the unit cell (Fig. 4, Table 3).

(Colour online.) Molecular packing viewed down “c” axis, showing intermolecular C–H···S hydrogen bonds as dashed lines, which forms C (9) chain in the unit cell. For the sake of clarity, H atoms not involved in hydrogen bonds have been omitted.
Geometric details of hydrogen bond (Å,°) for [Hg(bzfdtc)2] (D, donor; A, acceptor; H, hydrogen).
| Interactions | D–H | H···A | D···A | D–H···A | Symmetry |
| C(11B)–H(11B)···S(4B)#3 | 0.93 | 2.86 | 3.788(8) | 177 | x+1, y, z |
| C(22B)–H(22 C) ··S(4B) | 0.97 | 2.46 | 3.010(7) | 116 | –x+1, –y+2, –z+1 |
| C(22A)–H(22B) ··S(3A) | 0.97 | 2.50 | 3.003(5) | 112 | –x, –y+1, –z |
| C(15B)–H(15D) ··S(3B) | 0.97 | 2.48 | 2.994(6) | 113 | –x+1, –y+2, –z+1 |
| C(15A)–H(15B) ··S(4A) | 0.97 | 2.53 | 3.043(5) | 113 | –x, –y+1, –z |
| C(2B)–H(2B2) ··S(2B) | 0.97 | 2.53 | 3.009(6) | 110 | –x+1, –y+2, –z+1 |
| C(2A)–H(2A1) ··S(2A) | 0.97 | 2.52 | 3.012(5) | 111 | –x, –y+1, –z |
(Colour online.) Molecule with intramolecular hydrogen bonds as dashed lines. For the sake of clarity, H atoms not involved in hydrogen bonds have been omitted.
3.4 Single-crystal X-ray structural analysis of 2
The ORTEP diagram of 2 is shown in Fig. 5. [Hg(dfdtc)2] was crystallized in the space group Pbca, with Z = 8. From the crystal structure of 2, it also exists as a dimer. The unit cell comprises four binuclear molecules [Hg2(dfdtc)4], so that there are eight [Hg(dfdtc)2] entities in the orthorhombic unit cell. In the mononuclear fragment, one dithiocarbamate ligand chelates the mercury atom, whereas the other dithiocarbamate ligand is bonded to two Hg atoms. The bridging S atoms are bound to the adjacent mercury atom more strongly (Hg2–S4 = 3.033 Å) than in their own chelate ring [HgS2C] (Hg1–S4 = 2.6355 Å). The geometry of this coordination polyhedron [HgS5] is intermediate between tetragonal pyramid and trigonal bipyramid. The value of τ (0.32) show that the TBP/TP contributions to the geometry of the mercury coordination polyhedral are 32/78%. Weak intramolecular C–H···S hydrogen bonding (Fig. 6) and intermolecular C–H···S and C–H···O hydrogen bonding (Fig. 7; Table 4) are observed.
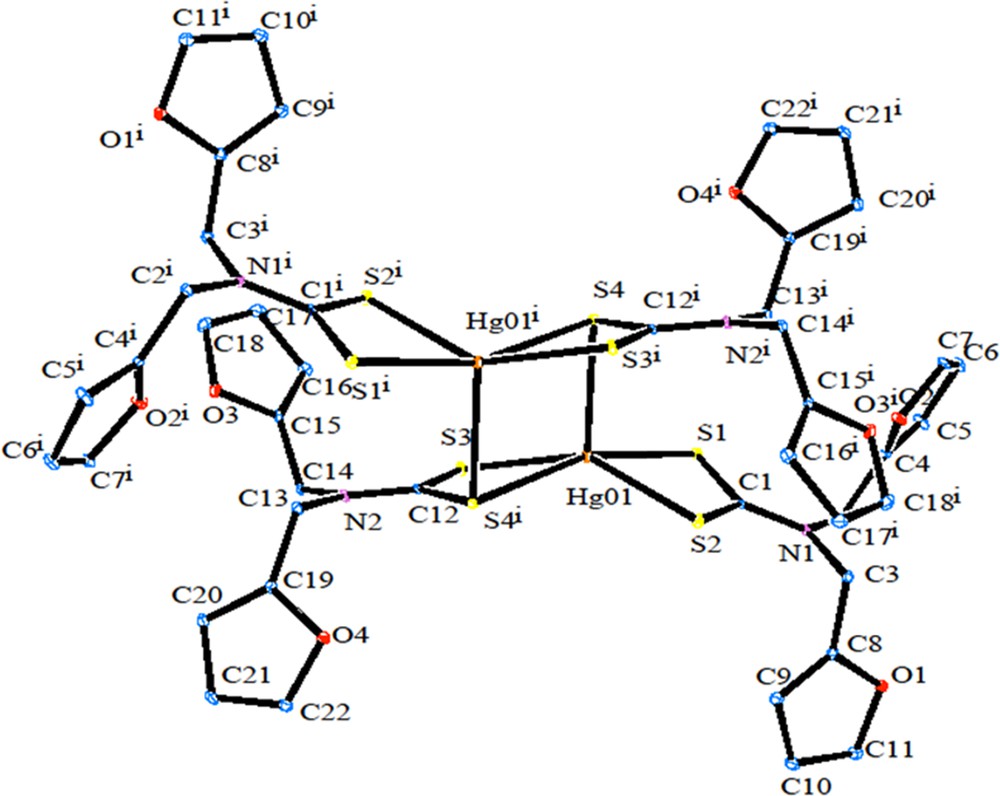
(Colour online.) ORTEP diagram of [Hg(dfdtc)2].

(Colour online.) Molecule with intramolecular hydrogen bonds as dashed lines with labels. For the sake of clarity, H atoms not involved in hydrogen bonds have been omitted.
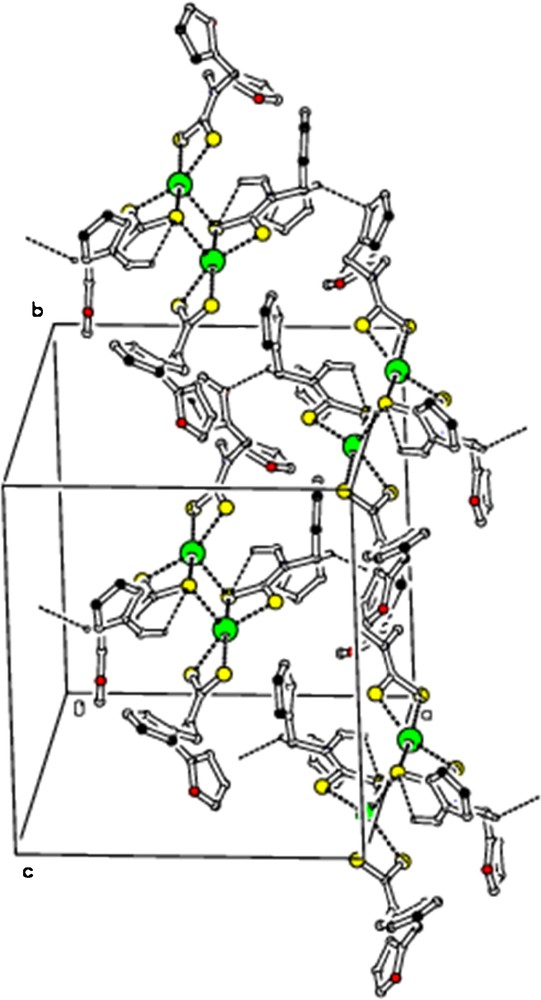
(Colour online.) Molecular packing viewed along “c” axis, showing intermolecular C–H···S and C–H···O hydrogen bonds as dashed lines. For the sake of clarity, H atoms not involved in hydrogen bonds have been omitted.
Geometric details of hydrogen bond (Ǻ,°) for [Hg(dfdtc)2] (D, donor; A, acceptor; H, hydrogen).
| Interactions | D–H | H···A | D···A | D–H···A | Symmetry |
| C2–H2A···S1 | 0.97 | 2.58 | 2.988(4) | 105 | x, y, z |
| C3–H3A···S2 | 0.97 | 2.51 | 2.971(4) | 109 | |
| C14–H14A···S3 | 0.97 | 2.56 | 2.954(4) | 104 | |
| C13–H13A···S4 | 0.97 | 2.58 | 3.057(4) | 110 | 1–x, 1–y, 1–z |
| C14–H14B···O1 | 0.97 | 2.54 | 3.285(4) | 133 | 1/2+x, 1/2–y, 1–z |
| C20–H20···S1 | 0.93 | 2.77 | 3.670(4) | 165 | 3/2–x, 1–y, –1/2+z |
In both complexes, C–S distances (1.719(5) Å and 1.728(5) Å for 1 and 2, respectively) are intermediate between normal C–S (1.82 Å) and CS (1.60 Å) distances. Similarly C–N thioureide bond lengths of 1.329(6) Å for 1 and 1.320(5) Å for 2 are significantly shorter than a normal C–N bond (1.47 Å) and longer than a CN bond (1.28 Å) [1–3]. This confirms that the π-electron density was delocalized over the S2CN moiety, and that the C–S and C–N bonds have significant double bond character.
3.5 Characterization of HgS nanoparticles
3.5.1 Powder X-ray diffraction studies on HgS
Powder X-ray diffraction patterns of HgS1 and HgS2 are shown in Fig. 8. All the diffraction peaks can be indexed to be a cubic phase (β – HgS, metacinnabar), which is in good agreement with standard data from the JCPDS card No. 06-0261 and 89-0432 for HgS1 and HgS2, respectively. The mean crystallite size can be determined from the half-width of the diffraction peaks using Debye–Scherrer formula [32]:
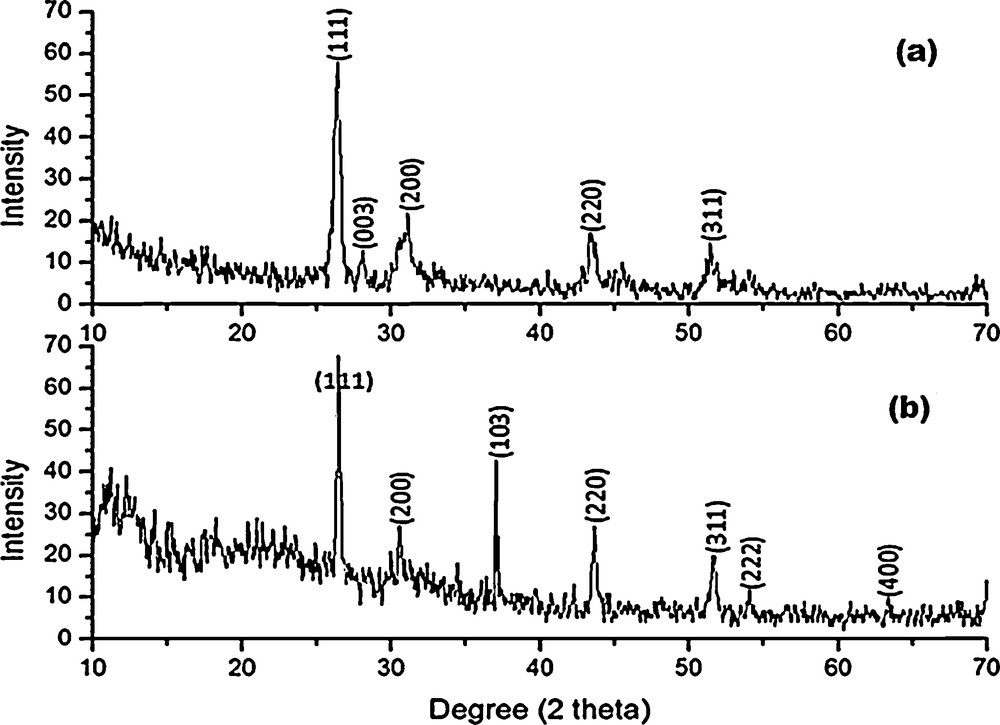
Powder XRD patterns of (a) Hgs1 and (b) HgS2.
3.5.2 Energy-dispersive X-ray spectral (EDAX) studies
EDAX spectra of HgS1 and HgS2 are shown in Fig. 9. Energy-dispersive X-ray spectra of HgS1 and HgS2 reveal the presence of Hg and S. In both cases, strong signals are observed for Hg and S. This indicates that the synthesized products are HgS. The elemental analytical data of HgS1 exhibit that the atomic ratio of S/Hg is 1:1. In the case of HgS2, the atomic ratio of S/Hg is 0.91:1. This indicates the presence of excess Hg2+ ion in the HgS2 sample.

(Colour online.) EDAX of (a) Hgs1 and (b) HgS2.
3.5.3 Field emission scanning electron microscopy (FESEM) studies
The products of HgS1 and HgS2 were investigated by FESEM. Fig. 10 reveals that the diameters of the uniform sized mercury sulfide nanospheres and the individual nanospheres are coupled of numerous nanoflakes (Fig. 10c). The size of the nanospheres in HgS1 is smaller than those of the HgS2. This indicates that the reaction carried out in microwave irradiation method yields smaller particles.

FESEM images of (a) HgS1, (b) HgS2 (500 nm) and (c) HgS2 (1 μm).
3.5.4 Optical properties
To obtain optical absorption information about the prepared mercury sulphides, UV–visible spectra were recorded. The UV–visible absorption spectra of the mercury sulphides are shown in Fig. 11. The absorption spectra of HgS1 and HgS2 show absorption maxima at 359 and 355 nm, respectively. In both cases, the clear appearance of a blue shift of the absorption peak relative to bulk HgS (620 nm) [33] indicates that the HgS1 and HgS2 particles are quantum confined.

(Colour online.) UV–visible spectra of (a) Hgs1 and (b) HgS2.
Fig. 12 shows the photoluminescence spectra of the HgS1 and HgS2. The photoluminescence spectra of HgS1 and HgS2 exhibit an emission peak at 425 nm through the excitation at 350 nm. The blue shift of the emission peak compared to the bulk (588 nm) is due to quantum confinement effects [34].
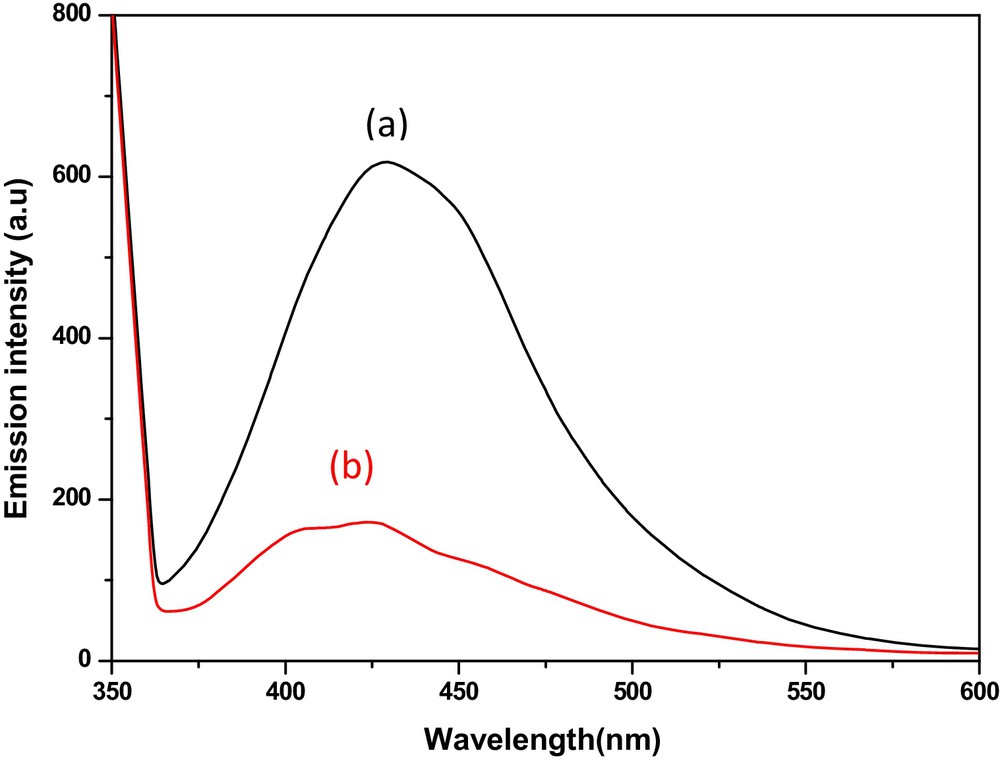
(Colour online.) Photoluminescence spectra of (a) Hgs1 and (b) HgS2.
3.5.5 Infrared spectra
Infrared spectra of HgS1 and HgS2 show bands around 3400 cm−1, which is due to the vibration of N–H. The bands observed around 2920 cm−1 and 2853 cm−1 are assigned to vasym and vsym vibrations of –CH2–. From the results of IR analysis, it is suggested that ethylenediamine should exist in HgS1 and HgS2. The lack of bands due to dithiocarbamate ligands evidences their absence in HgS1 and HgS2. This confirms the absence of dithiocarbamate ligand in as-synthesized HgS.
4 Conclusions
Complexes 1 and 2 were prepared and characterized by IR, NMR and single-crystal X-ray analysis. We reported here a simple and versatile microwave irradiation method for the synthesis of high-quality mercury sulphide nanospheres within 2 min using a single-source precursor. Complex 1 is one of the interesting metal complexes as a single-source precursor for the preparation of HgS nanospheres in the presence of ethylenediamine, which acts as a solvent as well as a capping agent. The XRD pattern confirms the cubic phase of HgS.
Acknowledgements
G.G. is thankful to University Grants Commission (UGC), India, for the award of Basic science Research (BSR)-Special Assistant Programme (SAP) Fellowship.