

1 Introduction
Anthracenediones (ACDs) have a broad range of applications and properties. Depending upon the position of the keto groups, ACDs have various isomers, but the most studied and common representative of this class is 9,10-anthracenedione. Natural ACDs are structurally diverse and their diversity is related to the existence of different substituents that include alkyl substituents, as well as reduced systems including hydro-anthracenediones. Anthracenedione derivatives are used as colorants and 9,10-anthracenedione is the constituent of several dyes [1]. Solvent violet 13, a synthetic anthracenedione dye, is used to dye hydrocarbon products, including thermoplastics, polystyrenes and synthetic fibers [2]. It is also used in hair and skin care products [3]. ACDs are used as useful nucleotide-specific ligands for the purification of proteins [4]. The enzyme encoded by UGT1A8 gene has glucuronidase activity with many substrates, including anthracenediones [5]. Anthracenedione sulfonate is used to catalyze cyclic photophosphorylation reactions [6], which are employed for labeling purposes in biological systems. Modification of deoxynucleosides or deoxynucleoside triphosphates by linking the anthracenedione molecule at 5-position in pyrimidine or 7-position in 7-deazaadenosine yields suitable substrates for polymerases and incorporation of a label in DNA [7]. ACDs are also used for labeling the N-terminus of peptides [8]. Some of these compounds are inhibitors of topoisomerase and are pharmacological targets for cancer prevention [9]. The use of anthracene-9,10-dione as a bird repellant has been reported, being a post-ingestional irritant that produces a conditioned taste aversion after the consumption of treated seeds [10].
Due to the ability of ACDs to act as carriers of electrons and hydrogens, the electrochemical behavior of this class of compounds has been the main focus of researchers. Allietta et al. reported the electro-polymerization of pyrrole-substituted anthracenedione at an indium-tin oxide electrode [11]. These are also potentially useful semiconductors due to their intriguing properties for low-cost organic electronics [12,13].
One of the major focal points are the biological activities of ACDs that are associated with their redox behavior [14,15]. To gain insights into their biological action, mode of reaction, and determine their physicochemical parameters, several researchers have studied the reduction of these molecules under different conditions [16]. The quinones and anthracenediones undergo two successive one-electron reduction steps to produce the corresponding semiquinone and dianion, generating two separate cathodic waves in which the first step is fully electrochemically reversible and the second step is either reversible or quasi-reversible, depending on the experimental conditions [17–21]. Anthracenediones containing hydroxyl groups are interesting from an electrochemical point of view, and their position alters the redox behavior of the quinonoid moiety [18,22–24] due to the formation of intramolecular hydrogen bonds. In addition, these moieties are related to the biological activity of ACDs [25,26].
Though anthracenediones have a broad spectrum of applications and their reduction is widely studied [17–24], the literature about their electro-oxidation is limited and thus deserves further investigations. In the present work, we focus on the pH-dependent and temperature-dependent electro-oxidation of 4,8-dihydroxy-9,10-dioxo-9,10-dihydroanthracen-1-yl acetate (HACAD), 1,4,5-trihydroxyanthracene-9,10-dione (HAD) and 1,4,5-trihydroxy-2-methyl-3-(3-oxobutyl)anthracene-9,10-dione (HOAD), with the hope of providing useful insights into their electron transfer reactions.
1.1 Instrumentations and chemicals
An Autolab potentiostat/galvanostat equipped with GPES 4.9 software, Eco-Chemie, imported from the Netherlands, was used for carrying out all voltammetric experiments. The electrochemical cell (Model K64 PARC) was connected to a thermostat LAUDA, Model K-4R for holding a constant temperature during the electrochemical experiments. The three-electrode system consisted of a glassy carbon (GC) working electrode, an Ag/AgCl reference electrode (saturated with 3 M KCl) and a Pt wire as a counter electrode. The surface of the GCE was polished with diamond slurry (1-μm particle size) before each experiment, followed by thorough rinsing of the electrode with distilled water. All voltammetric experiments were conducted in a high-purity N2 atmosphere. The experimental conditions for DPV were a pulse amplitude of 50 mV, a pulse width of 70 ms, and a scan rate of 5 mV·s−1. For the SWV experiment, a 50 Hz frequency was used and stepped in 2 mV potential increments corresponding to an effective scan rate of 100 mV·s−1.
An UV-visible spectrophotometer (UV-1601 Shimadzu spectrophotometer) with a wavelength range of 200–800 nm and a quartz cuvette of path length 1 cm was used for electronic spectroscopic studies. All experiments were carried out using bidistilled water and analytical-grade chemicals. The compounds 4,8-dihydroxy-9,10-dioxo-9,10-dihydroanthracen-1-yl acetate (HACAD), 1,4,5-trihydroxyanthracene-9,10-dione (HAD), and 1,4,5-trihydroxy-2-methyl-3-(3-oxobutyl)anthracene-9,10-dione (HOAD), shown in Scheme 1, were kindly provided by Prof. Dr. Amin Badshah. The solubility problem of the analytes in aqueous system was avoided by preparing 2 mM stock solutions of the analytes in analytical-grade ethanol. Fresh working solutions were prepared in a 1:1 aqueous ethanol solvent by mixing 5 mL of the stock solution with 5 mL of a Britton-Robinson (BR) buffer of ionic strength 0.2 M. Thus, working solutions of 0.1 M ionic strength were prepared in the pH range from 3 to 12. The residual liquid potential of the water:organic solvent mixture was included in the pH determination as ethanol has a dielectric constant 3.27 times smaller than that of water at room temperature. The borate anion present in the BR buffer has been reported to cause ionization of the hydroxyl groups of hydroxy flavonoids, enabling their separation at pH ≥ 9.0 [27]. Thus, to avoid such issues, we focused on the investigation of the redox mechanisms of the selected hydroxyanthracenediones in a range of pH ≤ pKa.
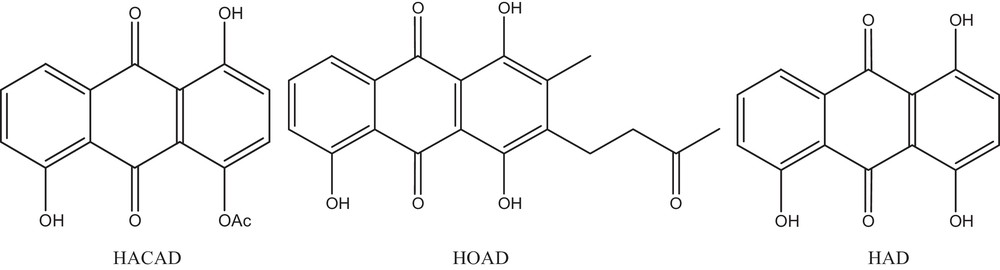
Chemical structures of the selected hydroxyanthracenediones, 4,8-dihydroxy-9,10-dioxo-9,10-dihydroanthracen-1-yl acetate (HACAD), 1,4,5-trihydroxyanthracene-9,10-dione (HAD), and 1,4,5-trihydroxy-2-methyl-3-(3-oxobutyl)anthracene-9,10-dione (HOAD).
2 Results and discussion
2.1 Cyclic voltammetry
Cyclic voltammetry studies of a 0.6 mM solution of the selected anthracenediones was first carried out between the potential limits of ±1.5 V in a medium buffered at pH 7.0. Consecutive scans of the analytes were recorded to know the extent of adsorption of the compounds on the electrode surface. Fig. 1A demonstrates the effect of successive scans on the peak current of the derivative HACAD. The decrease in the current intensity after the first scan indicates the adsorption of the analyte at the electrode surface, but the peak current becomes constant after several scans and a steady state is finally reached. The CV response reveals a sharp oxidation signal, 1a, of the analyte at +0.55 V, followed by a broad peak, 2a, at +1.02 V vs Ag/AgCl. The absence of reduction peaks corresponding to 1a and 2a in the reverse scan points to the irreversible nature of these electrochemical oxidation processes [28]. In the negative potential range, the CV of HACAD shows two reduction signals labelled as 1c and 2c at potentials of –0.63 and –0.90 V, respectively. On the reverse scan, the emergence of a single anodic peak is related to the oxidation of the reduced product of HACAD. The cyclic voltammograms of HOAD and HAD were also obtained in a medium at pH 7.0, and both compounds exhibit similar electrochemical behavior.
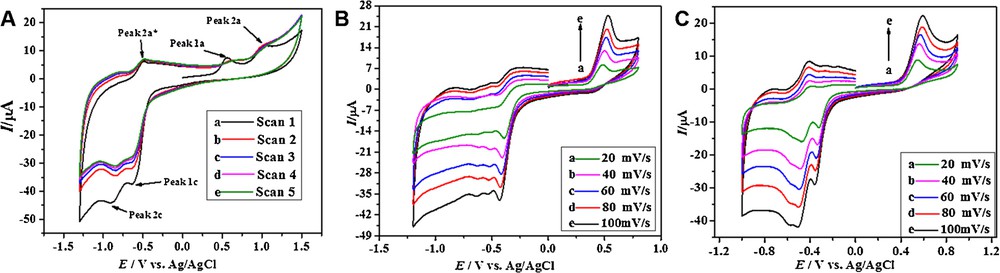
(Color online.) A. Consecutive CVs of 0.6 mM HACAD obtained at pH 7.0 at 100 mV·s−1. B. CVs of 0.6 mM HAD. C. HACAD at different scan rates.
2.1.1 Kinetic parameters from CV
As electrochemistry mainly focuses on the kinetics of the reactions at the electrode surface [29], therefore, the values of different kinetic parameters such as diffusion coefficient (D) and heterogeneous electron transfer rate constant (ksh) were obtained from CV by monitoring the variation of the peak current with the scan rate. The Randles–Sevcik equation relates the magnitude of the peak current (Ip) to the temperature (T), the concentration (C), the electrode area (A), the number of electrons involved in the oxidation or in the reduction (n), the diffusion coefficient (D), and the scan rate [29,30]. The temperature effects of the scan rate on the redox properties of the three anthracenediones were monitored at pH 7.0 at different temperatures. The voltammograms at 323 K are shown in Fig. 1B and C and show an increase of Ip with increasing the scan rate. The values of the diffusion coefficients are summarized in Table 1, and were obtained from the slope of the plots shown in Fig. S1. An examination of Table 1 reflects that the diffusion coefficients are affected by molecular mass and temperature. The values of D decrease with increasing the molecular mass because a heavier molecule of larger radius moves slowly towards the electrode according to the Stokes–Einstein equation [29]. As temperature increases, the solvent viscosity decreases, which in turn increases the mobility of the analytes.
Diffusion coefficient and heterogeneous rate constant values measured for the selected compounds at different temperatures.
| Compounds | Mol. wt (g/mol) | Temperature (K) | D (cm2/s) | Ksh (cm/s) |
| HACAD | 298.05 | 308 | 2.82 × 10⁻⁶ | 2.58 × 10⁻⁶ |
| 313 | 8.23 × 10⁻⁶ | 5.56 × 10⁻⁶ | ||
| 318 | 1.90 × 10⁻⁵ | 1.38 × 10⁻⁵ | ||
| 323 | 3.04 × 10⁻⁵ | 2.80 × 10⁻⁵ | ||
| HOAD | 340.10 | 308 | 1.47 × 10⁻⁷ | 1.13 × 10⁻⁷ |
| 313 | 2.50 × 10⁻⁷ | 3.17 × 10⁻⁷ | ||
| 318 | 4.68 × 10⁻⁷ | 5.94 × 10⁻⁷ | ||
| 323 | 8.75 × 10⁻⁷ | 1.16 × 10⁻⁶ | ||
| HAD | 256.04 | 308 | 3.10 × 10⁻⁶ | 1.56 × 10⁻⁶ |
| 313 | 4.08 × 10⁻⁶ | 2.17 × 10⁻⁶ | ||
| 318 | 4.61 × 10⁻⁶ | 6.33 × 10⁻⁶ | ||
| 323 | 5.53 × 10⁻⁶ | 1.61 × 10⁻⁵ |
The CV experiments also showed a variation of the peak potentials (Ep) with the scan rate and temperature. Fig. 1B and C shows a prominent shift of the peak potentials towards more positive potentials with increasing the sweep rate for the oxidation corresponding to peak 1a, suggesting the irreversible nature of the process [31]. The cathodic shift of Ep indicates facile oxidation at higher temperature. The value of ksh, based on peak 1a, was evaluated at different temperatures using equation (1) [32].
| (1) |
The value of the standard electrode potential, E°, was taken as the potential corresponding to 0.85 Ip [33]. The value of the intercept, ksh, was determined at different temperatures, and our results clearly indicate that ksh increases with increasing temperature, showing a tendency towards reversibility at higher temperatures (Table 1). The ksh of all the three compounds are quite similar and slight differences can be related to variations in their molecular masses because the processes are diffusion controlled and the sluggish diffusion of a comparatively heavier molecule limits the redox processes [34].
2.1.2 Thermodynamic parameters from CV
Information about the spontaneity/non-spontaneity of the redox reactions can be obtained from thermodynamic parameters [31]. The rate constant evaluated from scan rate studies at different temperatures was used for the determination of the thermodynamic parameters listed in Table 2. ΔG# was evaluated from ksh using equation (2) [35].
| (2) |
Thermodynamic parameters of the redox processes of the selected compounds.
| Compounds | Temperature (K) | ΔG#/(kJ/mol) | Ea/(kJ/mol) | ΔH#/(kJ/mol) | ΔS#/(J/K·mol) |
| HACAD | 308 | 61.75 | 133.28 | 130.72 | 223.93 |
| 313 | 59.81 | 130.68 | 226.39 | ||
| 318 | 57.54 | 130.63 | 229.87 | ||
| 323 | 55.76 | 130.59 | 231.68 | ||
| HOAD | 308 | 69.59 | 125.72 | 123.16 | 173.91 |
| 313 | 67 | 123.11 | 179.27 | ||
| 318 | 65.43 | 123.07 | 181.26 | ||
| 323 | 63.76 | 123.03 | 183.5 | ||
| HAD | 308 | 63.63 | 114.12 | 111.56 | 155.62 |
| 313 | 63.01 | 111.52 | 155 | ||
| 318 | 62.18 | 111.48 | 155.04 | ||
| 323 | 59.49 | 111.44 | 160.83 |
The Arrhenius equation was used for the calculation of the enthalpy (ΔH#) and entropy (ΔS#) changes of activation. The value of the activation energy (Ea) obtained from the slope of the log ksh vs. 1/T plot (Fig. S2) was inserted into equation (3) for the evaluation of ΔH#. The value of was obtained using equation (4) [28].
| (3) |
| (4) |
An inspection of Table 2 reveals a decrease in ΔH# and an increase in ΔS# with an increase in temperature. Similarly, ksh increases and ΔG# decreases with increasing temperature. The overall result shows a trend toward reversibility and spontaneity at higher temperatures.
2.2 Differential pulse voltammetry
The differential pulse voltammetric technique is associated with an enhanced sensitivity due to its ability of minimizing charging current [28]. Hence, the pH-dependent redox behavior of HACAD, HAD, and of HOAD was investigated by DPV. The DPVs HOAD exhibit the same two oxidation peaks in the potential window of 0 to +1.5 V, as expected from the CV results discussed earlier (vide supra). However, the responses of HACAD and HAD are different, as an additional sharp peak (labelled as a*) appears under acidic conditions. The DPVs of HACAD are shown in Fig. 2A and show a shift of the peak potentials with a change in the pH of the medium, indicating proton-coupled electron transfer processes [36]. Oxidation becomes more facile at higher pHs, as indicated by a shift of Ep towards more negative potentials. This suggests a stabilization of oxidized species by hydroxyl ions present in the solution [29]. The DPVs of HACAD recorded in the potential range of 0 to +1.5 V show three independent signals in acidic media and two peaks in neutral and under alkaline conditions. The appearance of peak a* is attributed to the oxidation of the OH group at position 4 formed as a result of possible acid hydrolysis of the acetate group [37]. The number of hydrolyzed species decreases with increasing the pH of the medium, and consequently the peak current decreases. The reason for different redox potentials of OH groups at position 1 and 5 may be the different extent of their hydrogen bond formation. Peak a* of HACAD with a half-peak width (W1/2) value of 65 mV using equation W1/2 = 3.52 RT/nF indicates the loss of one electron in this oxidation step. The same calculations for the processes corresponding to peak 1a and 2a show that both processes are in fact one-electron processes [38]. The number of electrons and protons involved in the oxidation of the selected anthracenediones can be seen in Table 3. Ep–pH plots shown in Fig. 2B were used for the determination of protons accompanying electron transfer processes. The slope of plots of Ep versus pH of a*, 1a and 2a shows the involvement of a single proton transfer during the electron transfer reactions [29]. The presence of a third peak under strongly acidic conditions in case of HAD (see Fig. S3A) offers evidence of hydrolysis of the acetate group. A decrease in W1/2 values and an increase in the peak current suggests the merging of two peaks (a* and 1a) of HAD under basic pH conditions. The acid dissociation constants, pKa, of these compounds, listed in Table 3, were evaluated from the intersection of the two linear segments of Ep versus pH plots. The DPVs of HOAD show two peaks (1a and 2a) in the entire pH range studied (Fig. S3B). The absence of the third peak is presumably related to the two hydroxyl groups at positions 1 and 4 being in the same chemical environment, i.e. both can exhibit hydrogen bonding to the same extent (Scheme S1). On the basis of half-peak width values, it can be concluded that peak 1a corresponds to a two-electron transfer mechanism and peak 2a to a one-electron transfer mechanism.
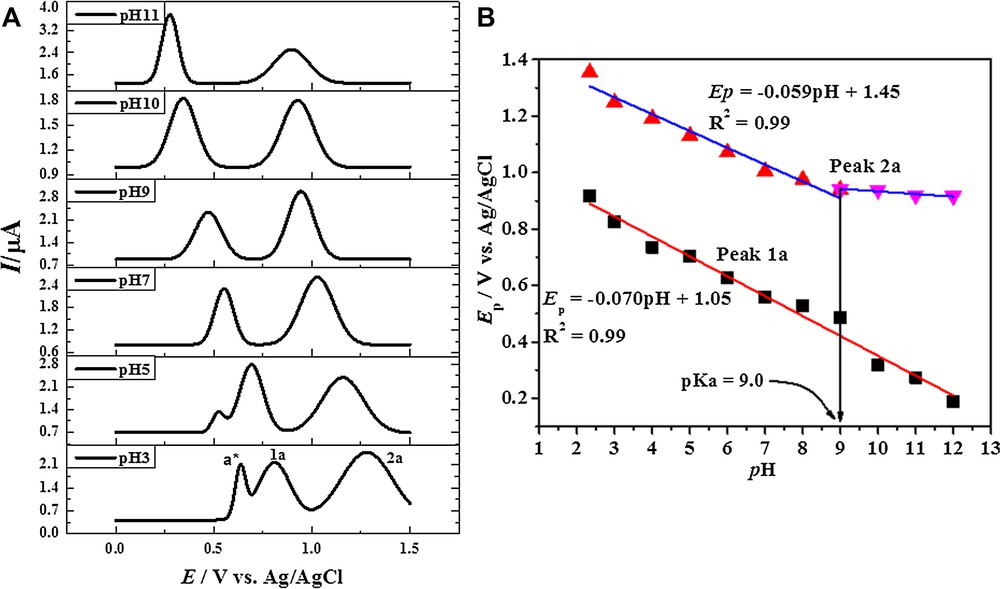
(Color online.) A. DPVs of HACAD obtained in 50% ethanol and 50% BR buffer with pH 3–11 at 5 mV·s−1. B. Peak potential plots as a function of pH.
Values of half-peak width, slope of Ep–pH plots, number of electrons and protons and LOD and LOQ.
| Compounds | Peaks | Number of electrons | Number of protons | pKa | LOD (mmol·L−1) | LOQ (mmol·L−1) |
| HACAD | a | 1 | 1 | |||
| 1a | 1 | 1 | 9.0 | 0.05 | 0.16 | |
| 2a | 1 | 1 | ||||
| HOAD | 1a | 2 | 2 | 9.2 | 0.09 | 0.31 |
| 2a | 1 | 1 | ||||
| HAD | a | 1 | 1 | |||
| 1a | 1 at pH ≤ 4.0 and 2 at pH ≥ 5.0 | 2 | 8.9 | 0.08 | 0.27 | |
| 2a | 1 | 1 |
2.3 Square-wave voltammetry
Square-wave voltammetry (SWV) has a very low detection limit due to minor contributions from the capacitive charging current [28]. Problems such as higher analyte consumption and poisoning of the electrode can be minimized by the application of SWV [39]. Based on these considerations, SWV was employed for the determination of the limit of detection (LOD) and the limit of quantification (LOQ) of the selected anthracenediones HACAD, HAD, and HOAD. An expected increase in peak current with concentration was observed for all three compounds (Fig. 3 and S4). The plot of Ip versus concentration was used for the calculation of LOD and LOQ according to equations (5) and (6). The LOD and LOQ values of anthracenediones listed in Table 3 are comparable to those of closely related compounds [28] and are defined as:
| (5) |
| (6) |
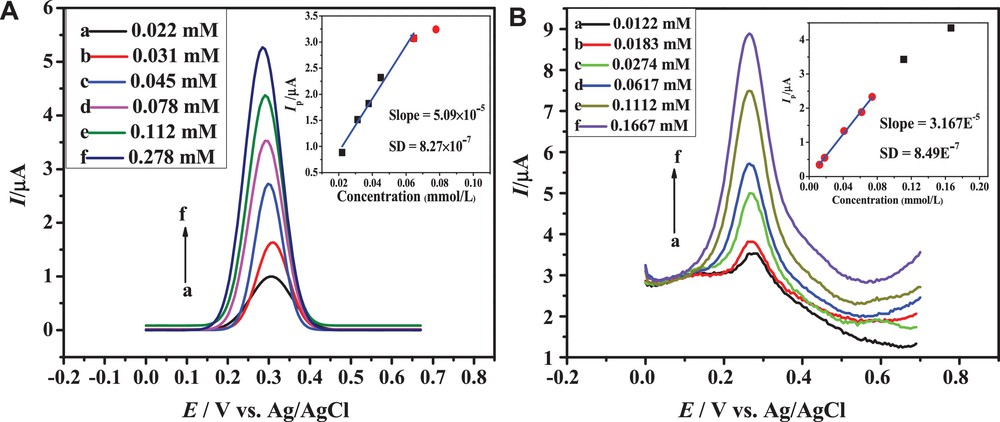
(Color online.) SWVs of different concentrations of (A) HACAD and (B) HAD obtained at 100 mVs−1 in a medium of pH 10.0. The insets show peak current versus concentration plots.
The ability of SWV to record forward and backward current components of the total current in a single scan makes it valuable among all other electrochemical methods. The same direction of forward and backward current components of peaks 1a and 2a of the three anthracenediones shown in Fig. 4 indicates the irreversible nature of their redox processes, thus providing useful insights into the redox mechanisms of the selected compounds.
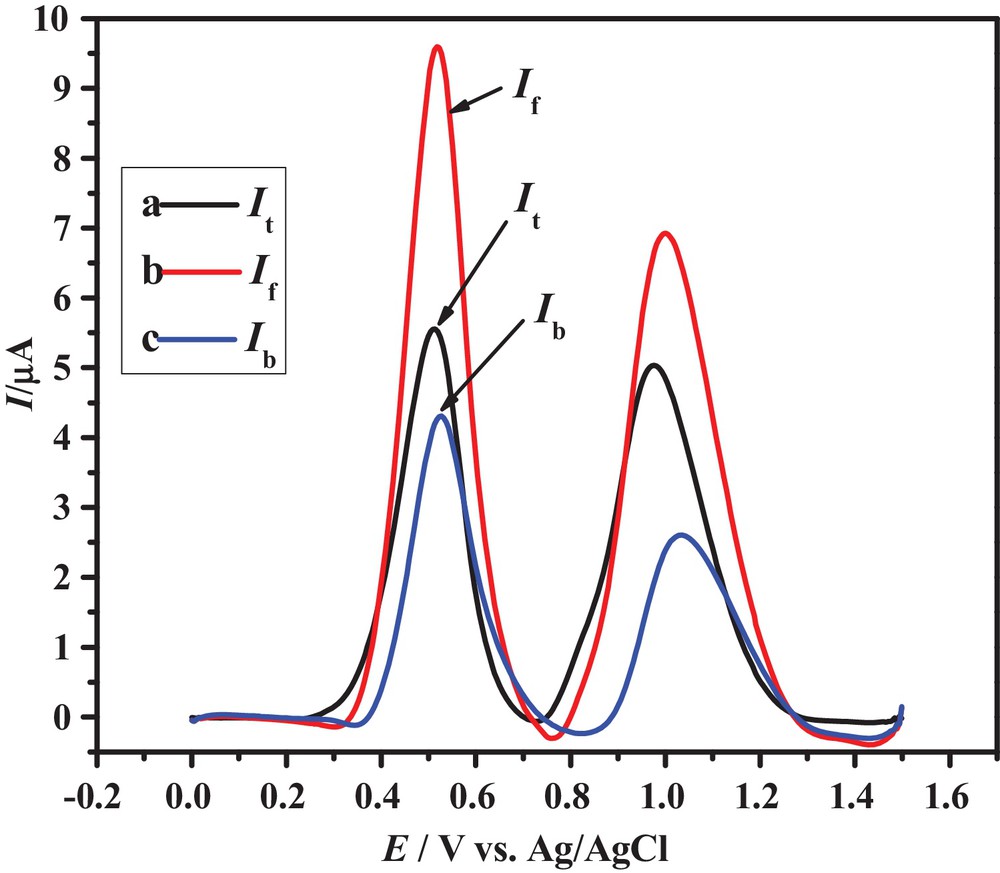
(Color online.) SWVs of 0.6 mM HACAD showing forward, backward and total currents.
2.4 Electronic absorption spectroscopy
Anthracenediones are coloring agents and their electronic states are assigned to So, Tn,π*, Tπ,π*, Sn,π* and Sπ,π* on the basis of prior theoretical and experimental studies [40]. According to the literature, the UV-visible spectrum of simple anthracenedione exhibits four signals at 207, 252, 272, and 326 nm. The signal at 207 nm corresponds to the transition of the carbonyl group, while the latter three signals are assigned to transitions of benzenoid and quinonoid systems. The optical characteristics of substituted ACDs show differences with simple anthracenedione presumably due to the presence of substituents, the formation of hydrogen bonds, and other inter-molecular interactions. Unlike simple anthracenedione, the UV–visible spectra of HACAD (Fig. 5) lacks the signal corresponding to a C = O centered transition, presumably due to the involvement of the C = O group in hydrogen bonding with OH groups at positions 1 and 4. The peaks appearing around 226, 250 and 281 nm are assigned to transitions of benzenoid and quinonoid systems [41,42]. The broad band at 435 nm, which is absent in the absorption spectrum of simple anthracenedione, appears in the spectra of the three ACDs studied here due to the charge transfer (CT) mechanism [41] of the electron-donating effect of the hydroxyl groups attached to the aromatic rings. The difference in the absorption spectra of HAD and HOAD is due to the presence of a third OH group at position 4 having the ability to form another ring. The band corresponding to the CT exhibits a bathochromic shift due to the electron-donating effect of the OH group compared to the acetate group located at the same position. An observation of the absorption spectra of the selected ACDs recorded at a different pH (see Fig. 6) reveals that the absorption band due to CT mechanism is strongly affected by pH as compared to the other signals. The band corresponding to the CT band of the orange-colored solution appears in the range of 375–480 nm in media of pH ≤ 9 and is shifted to 475–610 nm at pH > 9 due to the expected deprotonation of HACAD. The isosbestic point suggests that HACAD and its deprotonated form exist in equilibrium with the same value of the molar extinction coefficient. An isosbestic point also appears in the electronic absorption spectra of the other two ACDs. The absorbance–pH plots shown in Fig. 7 were used to evaluate the pKa of these compounds and they are identical to those obtained from DPV studies. From the slopes of the absorbance versus concentration plots, the molar exinction coefficients were obtained; they are listed in Table 4.
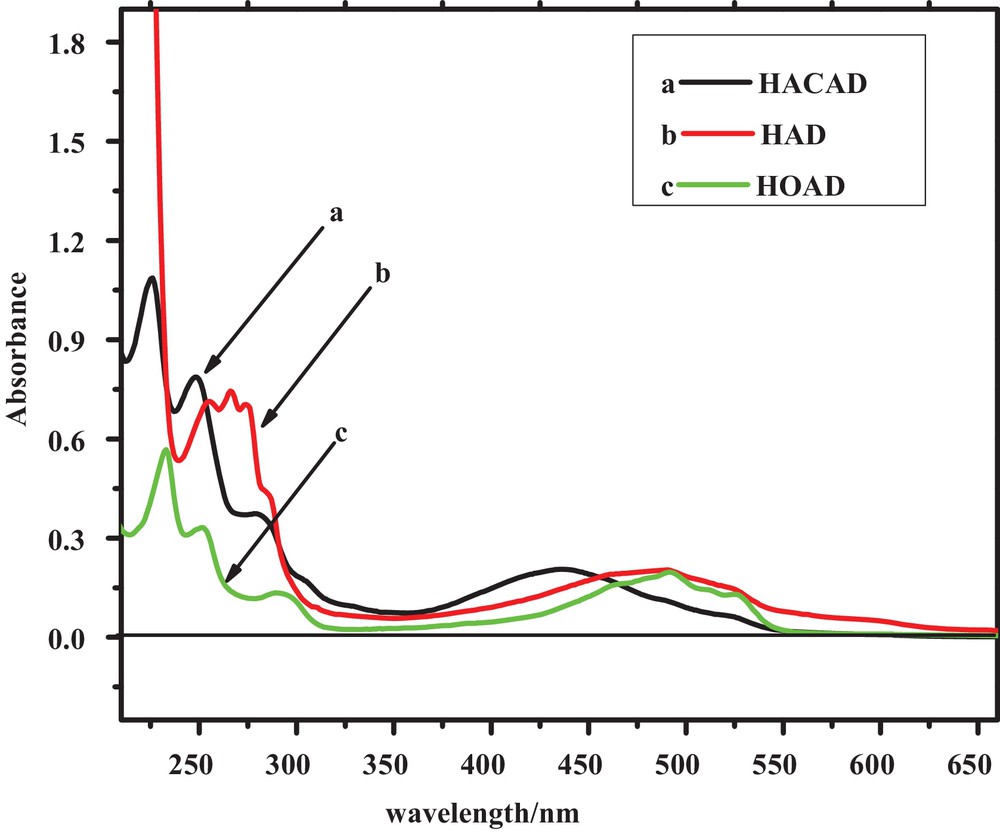
(Color online.) UV–vis spectra of 0.02 mM solutions of the selected anthracenediones at pH 7.0.
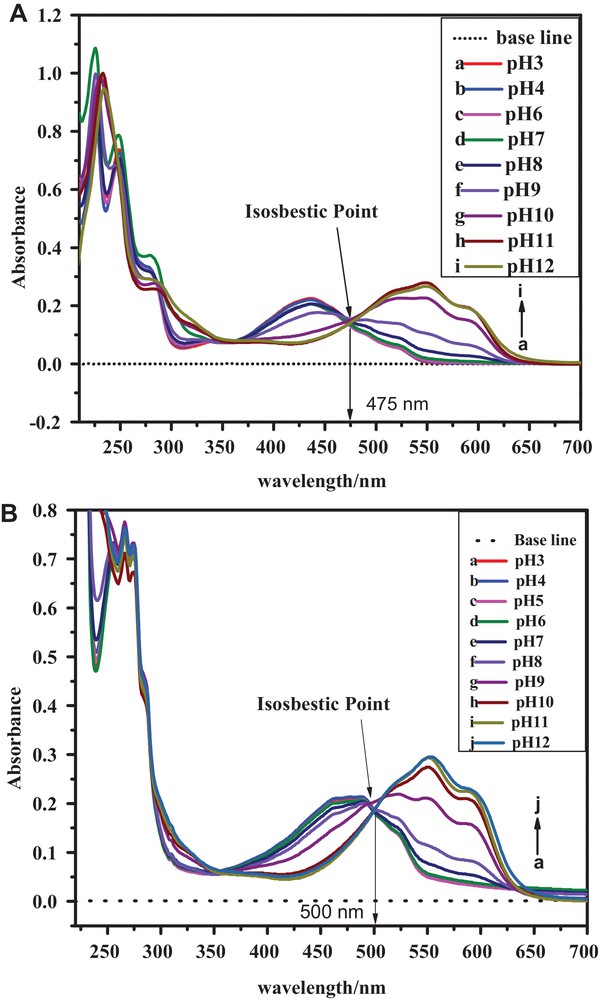
(Color online.) Absorption spectra of 0.02 mM solutions of (A) HACAD and (B) HAD in media with pH 3–12.
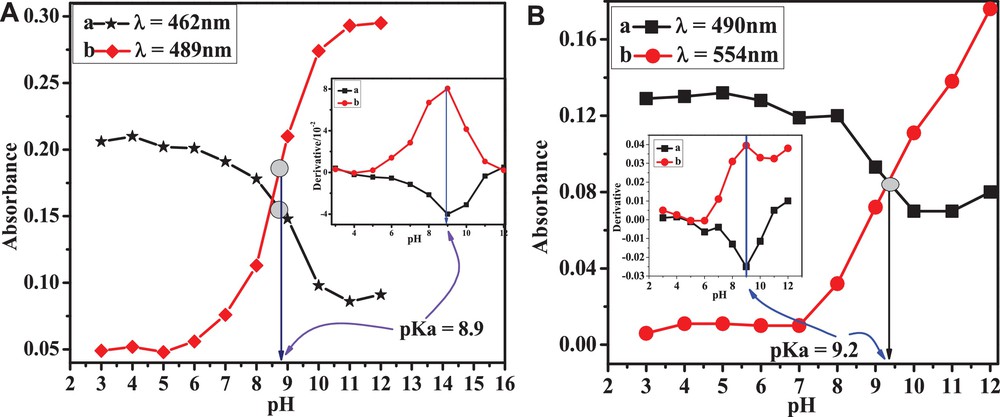
(Color online.) Absorbance of 20 μM (A) HAD and (B) HOAD solutions as a function of pH.
Molar extinction coefficient and pKa values of the analytes.
| Compounds | pKa | Wavelength/nm | Molar extinction coefficient/104 L·mol−1·cm−1 |
| HACAD | 9.4 | 437 | 1.19 |
| HOAD | 9.2 | 233 | 2.79 |
| 491 | 0.96 | ||
| HAD | 8.9 | 266 | 2.35 |
| 489 | 0.63 |
2.5 Redox mechanism
On the basis of the results obtained from the electrochemical experiments conducted at different pH values, redox mechanistic pathways for the three ACDs are proposed. The appearance of a third peak, a*, in the DPV of HACAD at pH ≤ 6.0 suggests an hydrolysis of the acetate group [37]. Based on the peak-width-at-half-peak current and slope value of the plot of peak potential versus pH, a CE mechanism is proposed (see Scheme 2A). Peaks 1a and 2a are assigned to the oxidation of OH at positions 1 and 5. In media with pH ≥ 7.0, the peak related to the hydrolyzed form of the analyte does not appear as expected. The proposed redox mechanism under these conditions is presented in Scheme 2B.
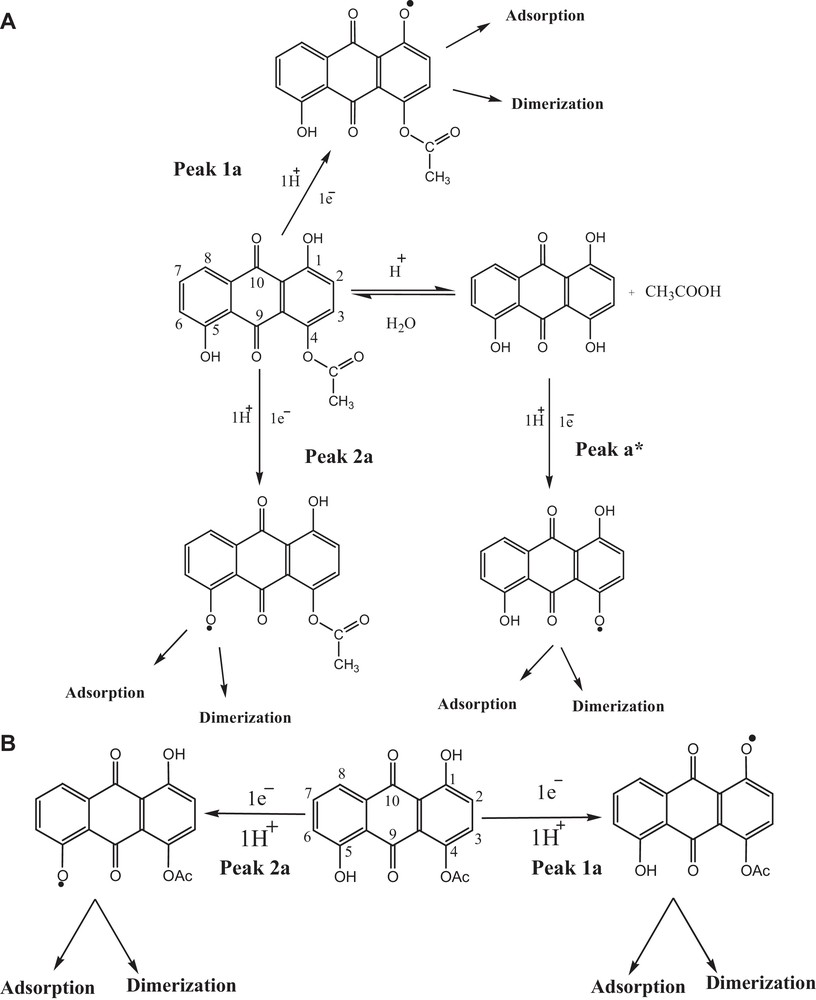
A. Proposed redox mechanism of HACAD in media with pH ≤ 6.0. B. Proposed redox mechanism of HACAD in media with pH ≥ 7.0.
Like HACAD, the oxidation of HAD exhibits three peaks under acidic and two under basic conditions. The peak a* appearing in strongly acidic conditions could not emerge in solutions of pH ≥ 5.0. The signals a* and 1a merged with a rise in pH. The redox response of HAD shows features similar to those of HACAD in highly acidic media as shown in Scheme 3A. At pH ≤ 4.0, the oxidation corresponding to peaks a*, 1a and 2a indicates the occurence of an oxidation process involving one electron and one proton in each one of the steps. At pHs higher than 4.0, peak 1a represents the oxidation process to occur by the loss of 2e, 2H+ resulting in the formation of a radical [43] that may get converted to 5-hydroxyanthracene-1,4,9,10-tetraone [44] or adsorb at the GCE as shown in Scheme 3B. The redox pathways for HOAD is summarized in Scheme S2.
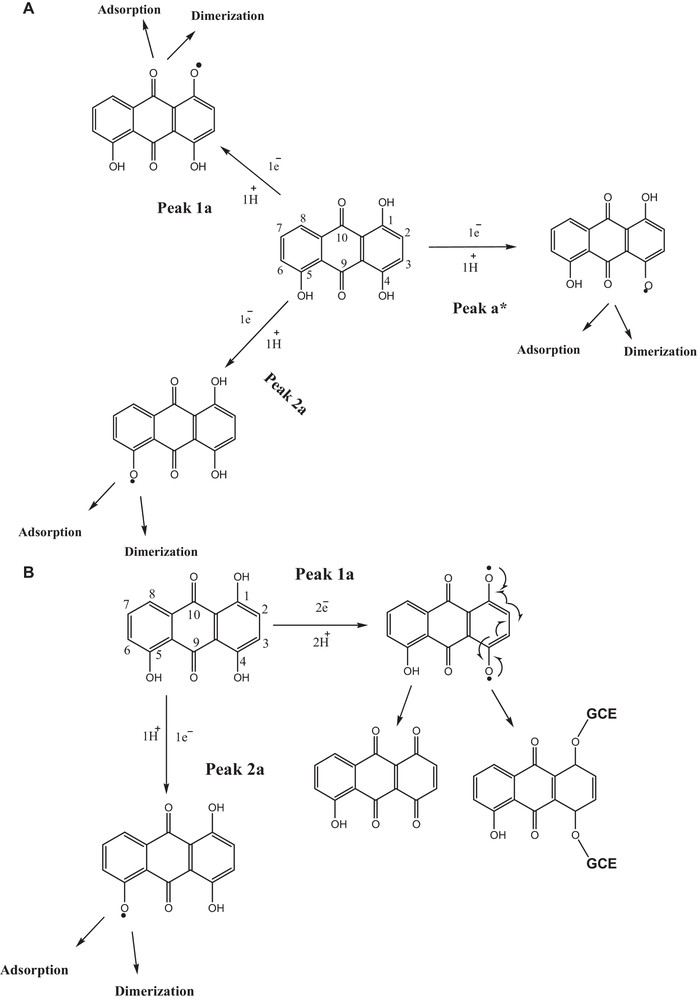
A. Proposed redox mechanism of HAD in media with pH ≤ 4.0. B. Suggested redox mechanism of HAD in media with pH ≥ 5.0.
Our electrochemical results reveal that the studied compounds undergo a two-step reduction. On the basis of peak separation, the ratio of Ipa and Ipc obtained by CV, and forward and backward current components of the total current from SWV, it can be concluded that the first reduction process corresponding to 1c is reversible and that the second reduction wave related to 2c is quasi-reversible. The results of the peak width at half peak current and plots of Epc versus pH reveal that the two-step reduction processes in these compounds occur by the participation of 1e– and 1H+ in each step. The reduction processes are accompanied by the formation of a semiquinone radical as an intermediate and a hydroquinone as the fully reduced species. The proposed mechanism is shown in Scheme 4.
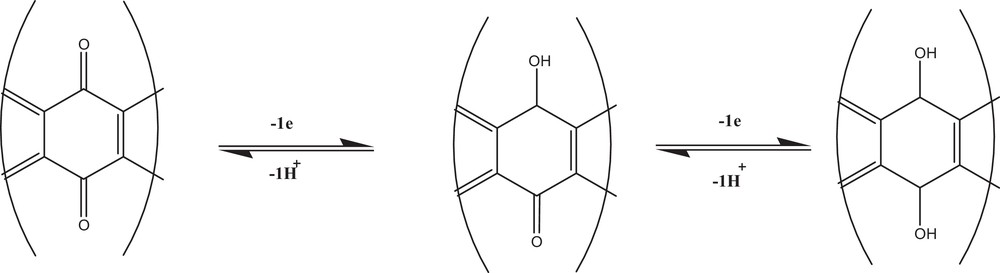
Proposed redox mechanism corresponding to peaks 1c and 2c of all the selected compounds.
3 Conclusion
The selected anthracenediones HACAD, HAD, and HOAD exhibited irreversible pH-dependent oxidations in media buffered at pH 3–12. The absence of the corresponding reduction peaks in the reverse scan of CVs clearly indicates the irreversible nature of these redox processes. Various kinetic parameters of the compounds were evaluated at different temperatures, which allowed us to evaluate the thermodynamic parameters of the redox processes. The diffusion coefficients and heterogeneous electron transfer rate constants were found to increase with increasing temperature. HACAD and HAD exhibited the same redox behavior in acidic medium due to acid hydrolysis of the acetate group. The difference between the UV–vis spectra of the selected compounds and that of the parent anthracenedione was due to possible hydrogen bonding between the C = O and the OH groups present at positions 1, 4, and 5. The pKas of the compounds were determined by DPV and UV–vis spectroscopy, and are in agreement with each other.
Acknowledgements
The authors gratefully acknowledge the financial support of the Higher Education Commission of Pakistan through project number 20-3070, Quaid-i-Azam University and the University of Toronto Scarborough, NSERC. The authors also extend their sincere appreciation to the Deanship of Scientific Research at King Saud University for funding this research through the group project number RGP-VPP-255.