Plan
Comptes Rendus

Vibrational spectroscopies to investigate concretions and ectopic calcifications for medical diagnosis
Comptes Rendus. Chimie, Volume 19 (2016) no. 11-12, pp. 1416-1423.

Résumé

As asserted by numerous authors, Fourier Transform (FT)-Raman and FT-Infrared spectroscopies constitute two useful tools for bio-medical diagnostics. We can distinguish two different kinds of application, namely, tissue disorders analyzed using statistical methods, and detection of ectopic calcifications through precise analysis of the shape and the position of absorption bands. In this contribution, we present some new results regarding these research themes, as well as recent experimental developments, such as the ability to perform nanometer scale near-field infrared microscopy, which have already led to major scientific breakthroughs.

Métadonnées
Reçu le :
Accepté le :
Publié le :
DOI : 10.1016/j.crci.2016.05.011
Mots clés : Fourier transform infrared spectroscopy, Infrared microspectroscopy, Raman spectroscopy, Raman microspectroscopy, Urinary calculi, Crystals, Biopsy
Michel Daudon 1, 2 ; Dominique Bazin 3, 4

1 Sorbonne Universités, UPMC Université Paris-6, UMR S 702, Paris, France
2 APHP, Service des Explorations Fonctionnelles, Hôpital Tenon, 75020 Paris, France
3 Sorbonne Universités, UPMC Université Paris-6, CNRS, Collège de France, Laboratoire de Chimie de la Matière Condensée de Paris (LCMCP), 11, place Marcelin-Berthelot, 75005, Paris, France
4 Laboratoire de Physique des Solides, Université Paris-Sud, CNRS, UMR 8502, 91405, Orsay cedex, France
@article{CRCHIM_2016__19_11-12_1416_0,
     author = {Michel Daudon and Dominique Bazin},
     title = {Vibrational spectroscopies to investigate concretions and ectopic calcifications for medical diagnosis},
     journal = {Comptes Rendus. Chimie},
     pages = {1416--1423},
     publisher = {Elsevier},
     volume = {19},
     number = {11-12},
     year = {2016},
     doi = {10.1016/j.crci.2016.05.011},
     language = {en},
}
TY  - JOUR
AU  - Michel Daudon
AU  - Dominique Bazin
TI  - Vibrational spectroscopies to investigate concretions and ectopic calcifications for medical diagnosis
JO  - Comptes Rendus. Chimie
PY  - 2016
SP  - 1416
EP  - 1423
VL  - 19
IS  - 11-12
PB  - Elsevier
DO  - 10.1016/j.crci.2016.05.011
LA  - en
ID  - CRCHIM_2016__19_11-12_1416_0
ER  - 
%0 Journal Article
%A Michel Daudon
%A Dominique Bazin
%T Vibrational spectroscopies to investigate concretions and ectopic calcifications for medical diagnosis
%J Comptes Rendus. Chimie
%D 2016
%P 1416-1423
%V 19
%N 11-12
%I Elsevier
%R 10.1016/j.crci.2016.05.011
%G en
%F CRCHIM_2016__19_11-12_1416_0
Michel Daudon; Dominique Bazin. Vibrational spectroscopies to investigate concretions and ectopic calcifications for medical diagnosis. Comptes Rendus. Chimie, Volume 19 (2016) no. 11-12, pp. 1416-1423. doi : 10.1016/j.crci.2016.05.011. https://comptes-rendus.academie-sciences.fr/chimie/articles/10.1016/j.crci.2016.05.011/

Version originale du texte intégral

1 Introduction

Infrared (IR) spectroscopy is an advantageous, non-destructive and label-free technique for chemical analysis [1–3]. IR absorption spectroscopy directly probes vibrational energy levels and phonons of materials, providing chemical as well as structural information by comparison with data bank reference spectra [4–9]. In regards to the medical field, IR microscopy, when combined with morphological description, has already demonstrated that it is possible to obtain significant clinical information regarding microcrystalline pathologies [10–16] through the analysis of concretions [17–28] as well as of ectopic calcifications in different human tissues [29–38]. Different scientific breakthroughs have been obtained in other research fields in which IR is now routinely used at the hospitals. Among these, we can cite the characterisation of lipids in graft liver at the Paul-Brousse hospital [39–41], of different biological tissues at the Reims hospital [42–48], and of concretions and ectopic calcifications in kidney biopsies for 30 years at the Necker hospital and subsequently at the Tenon hospital [9,12,16,21,24,29].

The introduction of Fourier Transform-IR (FT-IR) spectroscopy into the hospital environment is intimately related to experimental practicalities. Initially, the experimental procedure to collect IR spectra was quite laborious, requiring several minutes to collect data with sufficient signal-to-noise to extract significant clinical information. Thanks to various developments in laboratory apparatus, it is now possible to collect data rapidly (seconds to milliseconds) on subcellular sized crystals. Such low acquisition times allow the medical community to analyse large numbers of biological samples. For example, at the Necker and Tenon hospitals, more than 75,000 kidney stones have been characterized. Such opportunities also facilitate epidemiologic studies and help to relate urolithiasis to other major public health problems such as type II diabetes. Indeed, we have started an investigation on more than 200 patients after kidney transplantation in order to establish a possible correlation between the presence of ectopic calcifications and kidney function. The acquisition of a latest generation IR spectrometer at the Tenon hospital has also offered the opportunity to characterize ectopic calcifications in more than 800 biopsies of different organs (not only kidney but also breast and thyroid) originating from different hospitals in France, Belgium, Italy, Switzerland, and Canada.

In this contribution, we wish to present information that clinicians and more especially anatomopathologists can obtain through the conventional experimental setups, which already exist in some hospitals. Also, we will present some very recent developments in the area of near-field imaging, which have made it possible to collect IR spectra and images at about 20 nm resolution.

2 Some basic equations related to IR spectroscopy

We will not present here the theoretical formalism underlying IR spectroscopy but only some basic relevant equations [49,50]. In transmission, neglecting the reflection losses, the transmitted light (T) is a function of the absorption coefficient (αabs) and of the path length of light in the sample:

T=I/I0=eαabs·l,
where I0 and I are the light intensity of the incident and transmitted beams, respectively and l is the sample thickness. If the sample is homogeneous and weakly absorbing, scattering is negligible, and the absorbance is defined as:
A=γ·c·l=logT,
where αabs = γ · c, γ is the molar absorptivity and c is the molar concentration of the absorbing species. Another key point regarding IR spectroscopy is related to lateral resolution of IR microscopes, which is limited by light diffraction. This limit can be estimated by the Rayleigh criterion:
ξ=2·λ/NA,
where ξ is the lateral resolution and NA is the numerical aperture of the microscope objective (the more commonly found equation with ξ = 0.61λ/NA does not hold true for reflective objectives such as Cassegrain and Schwartzschild due to the central obscuring of the primary mirror). For mid-IR spectroscopy, the values of λ are between 25 μm (400 cm−1) and 2.5 μm (4000 cm−1). Due to signal-to-noise constraints, diffraction limited resolution is not achieved with conventional instruments and it is necessary to use synchrotron radiation as the source of photons [51–56] to attain this limit. The most recent instrumental developments try to go beyond this limit by using other physical principles. We will see that it is possible now to collect IR spectra at the nanometer scale.

3 The FTIR spectrum of a biological tissue

It is convenient to conceptualize an IR spectrum as two regions: 4000–1000 cm−1 known as the functional group region, and <1000 cm−1 known as the fingerprint region, even if for many chemists the dividing line is in fact 1450 cm−1. The functional group region contains relatively few peaks, which are typically associated with the stretching vibrations of functional groups (Fig. 1), denoted by the Greek symbol ν. In the fingerprint region, the spectra usually consist of bending vibrations within the molecule, denoted by the Greek letter β. This region is the key to the data analysis because it is here that each distinct compound produces its own unique pattern of peaks, effectively a fingerprint. In Fig. 1B, the different, well understood, absorption bands of the calcium phosphate apatite are assigned [8,9,57,58]. The ν1 and ν3 P–O stretching vibration modes occur at 960–962 cm−1 and 1035–1045 cm−1, respectively.

Fig. 1

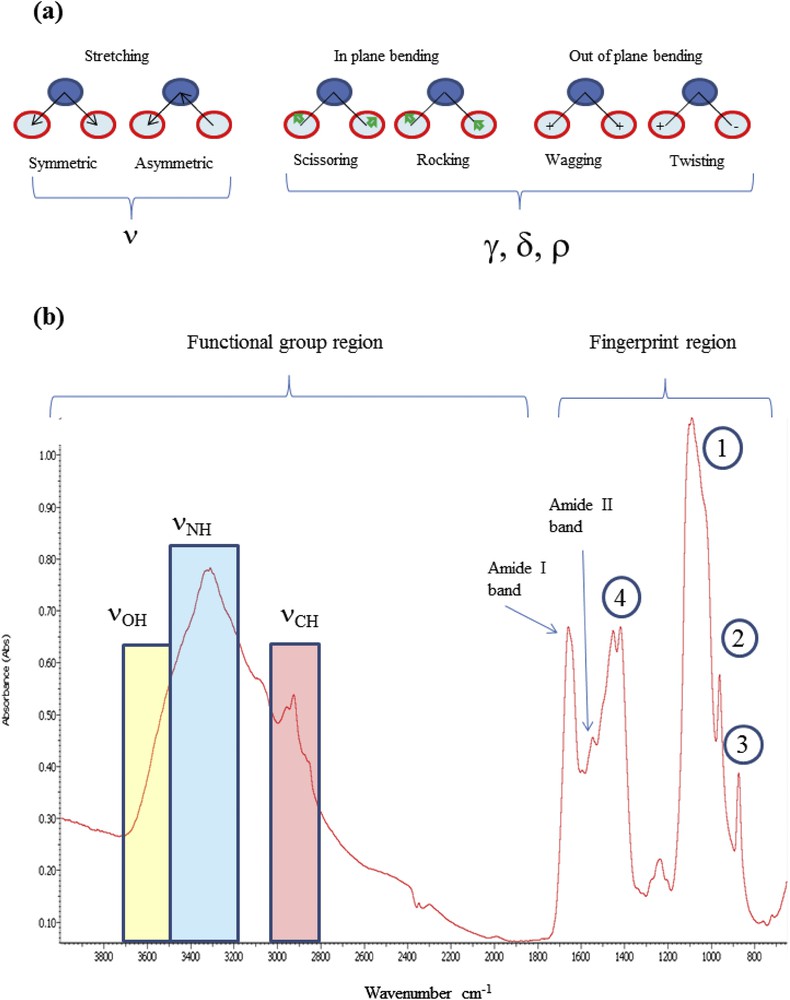
(a) Vibrational modes (stretching and bending), (b) identification of the absorption bands in the case of breast tissues (1) and (2) respectively asymmetric and symmetric stretching vibrations of PO43− groups; (3) and (4), respectively, deformation and stretching vibrations of carbonate groups. In addition, several protein bands (νNH at 3300 cm−1, amide I and amide II at 1650 and 1550 cm−1) can be observed.

From an experimental point of view, a FTIR spectrum can be collected using a wide range of sampling techniques. Those which we use at the hospital are depicted in Fig. 2. FTIR spectra are usually collected in the transmission mode (Fig. 2a), in which case kidney stones are ground with an agate mortar and pestle. Then almost 3 mg of the resultant powder is pelleted with spectroscopy grade dry KBr (∼300 mg).

Fig. 2

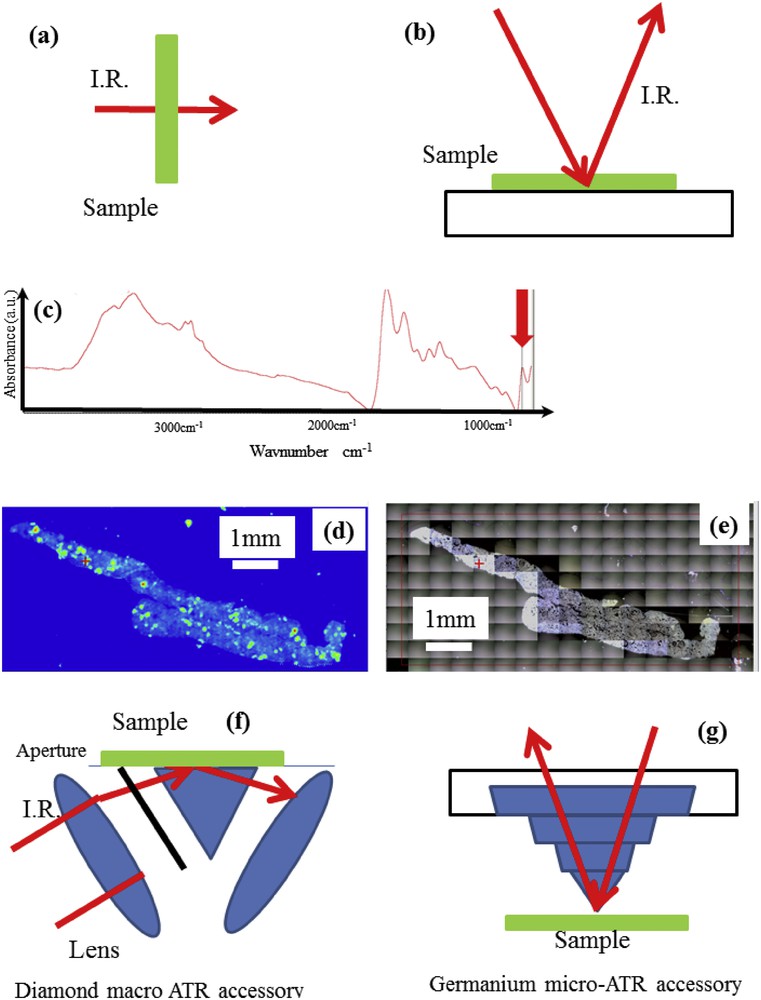
Schematic diagram showing the IR beam path (a) in the transmission mode for the characterization of concretion, (b) in the reflexion mode for the characterization of biopsies, (c) IR spectrum (d) Spatial distribution of whewellite as given by the intensity of the IR band. (e) Optical image of the kidney biopsy. (f) Macro-ATR and (g) the micro-ATR crystal. In the macro-ATR accessory, an aperture is inserted to allow the beam from the top half of the lens to pass through (from Ref. [63]).

In the case of kidney biopsies, tissues were simply deposited on low-e slides (a glass slide on, which a metal layer has been deposited making them IR reflective). Such metal coated slides allowed us to measure IR spectra of biopsies deposited on the glass slide in the so-called trans-reflexion (or transflexion) mode (Fig. 2b). The dimension of the spot can be as low as 10 μm using a synchrotron source and thus, several thousands of IR spectra can be collected allowing high-resolution chemical mapping of the sample to be performed. Note that such mapping can be performed in transmission mode (and thus without such support). Then, through the selection of a specific IR band (red arrow on Fig. 2c), it is possible to determine the spatial distribution (Fig. 2d) of a single chemical phase (here whewellite) and overlay it with an optical image (Fig 2e).

Attenuated Total Reflectance (ATR) is another geometry developed independently in the 1960s by Harrick and Fahrenfort [59,60] and used at the hospital. FTIR-ATR spectroscopy historically has been used for samples which are too thick for transmission measurements (Fig. 2f,g). In this sampling technique, information is derived from an evanescent wave that extends the surface of an infrared transparent crystal and penetrates only a short distance into the sample, i.e. around 1–3 μm depending on wavelength and crystal refractive index. We may distinguish two kinds of experimental setup, namely, macro and micro FTIR-ATR. In macro-ATR spectroscopy, the whole sample is measured at once at depths of 1–3 μm, giving no spatial resolution but excellent spectral quality. In the micro-ATR configuration, the coupling of the IR microscope and the ATR probe allows spatial resolution as fine as 2–4 μm [61,62] to be achieved, thanks to the high refractive index crystal, which reduces the lateral beam spot size.

The ATR (macro- or micro-) configuration also allows several spectral artefacts caused by sample induced scattering of IR radiations in the transmission and trans-reflexion modes to be eliminated.

4 Advantages of IR spectroscopy over other characterization techniques

In recent years, chemical characterization methods for identifying ions in concretions were widely used in hospitals throughout the world because they are cheap and easy to perform. However, such chemical methods present a number of major disadvantages: first, because they identify ions and not molecules, it is impossible to distinguish different crystalline phases of the same molecule, such as in the case of whewellite (calcium oxalate monohydrate, COM) and weddellite (calcium oxalate dihydrate, COD), which have very different etiopathogenic significance. COM is related to hyperoxaluria while COD indicates hypercalciuria [64]. In the case of calcium phosphates, apatite and brushite are not clearly distinguished. Note that even X-ray scattering, still commonly used in hospitals, also has some major drawbacks. For example, in apatite, it is not possible to assess the carbonate level, which may be a fingerprint of an infectious process [65,66].

Finally, it is worth emphasizing that chemical methods fail to identify some specific metabolites such as dihydroxyadenine, or crystallized drugs, or other rare components related to specific pathological conditions. For all these reasons, chemical methods (even X-ray scattering) could advantageously be replaced by FTIR measurements for stone analysis [13,67–69].

5 Large diversity of samples of interest for medicine

FTIR microspectroscopy has proven an efficient tool in the investigation of many tissue types. Quite recently, tumours of liver [70,71], lung [72,73], stomach [74,75], oral cavity [76], breast [77,78] or prostate [79] have been addressed. Thanks to characteristic IR absorption peaks, investigations of bones and other pathologic tissues [80], collagens [81], fatty acids, lipid hydroperoxides [82], atherosclerotic plaques [83] or creatine [84], can also be assessed by FTIR spectroscopy. Note that several exciting results have been obtained on brain [85–90]. For example, in Huntington's disease, as the inclusions enriched in both β sheets and β sheets/unordered structures are a characteristic of severely affected brain regions, W. André et al. [86] conclude that this kind of amyloid inclusion is likely to be particularly toxic to neurons, while other inclusion types may present less severe toxicity. All these papers show that FTIR spectroscopy can be of great diagnostic and prognostic value.

Another set of applications of FTIR spectroscopy address the interaction of drugs with the tissue. For example, J-C. Tsai et al. [91] have performed a noninvasive characterization of regional variation in drug transport into human Stratum corneum in vivo. Another example is the publication of Z.W. Ye et al. [92] investigating the interaction between the anticancer drug erlotinib and human serum albumin. In a recent review, A. Mignolet et al. [93] indicate that results accumulated so far suggest that infrared spectroscopy could be a very accurate descriptor of the mode of action of anticancer drugs. Similar results have been obtained by A. Derenne et al. [94]. Their data suggest that FTIR spectroscopy could be used for the classification of drug action.

Notably, human fluids can be also investigated by FTIR spectroscopy. A.K. Rosenthal and N. Mandel [95] have used this technique to identify crystals in synovial fluids and joint tissues. A. Travo et al. [96] report some differences in the chemical composition of tears from patients with keratoconus and those from patients with non-specific inflammatory ocular diseases. Recently, C.M. Orphanou [97] has shown that human blood, saliva, semen and vaginal secretions could successfully be detected and differentiated from one another by ATR FT-IR spectroscopy.

A large number of publications deal with cells [98–102]. V. Erukhimovitch et al. [98] have used FTIR microscopy to detect cells infected with viruses. Also, C. Chonanant et al. [99] present SR-FTIR microspectroscopy evidence that this is a sensitive technique for monitoring the differentiation state of stem cells under chondrogenic induction, particularly at an early stage.

Human pathogens such as enterococci can be studied. C. Kirschner et al. [103] have shown the potential usefulness of vibrational spectroscopic techniques in differentiating enterococci from various sources, including isolates from food, patient material, and strain collections. Similar results have been obtained by the same team on candida [104].

Recently, very interesting studies have been published in which FTIR spectroscopy is combined with fluorescence and luminescence experiments [105–111].

Finally, biomaterials have also been addressed. In a recent study, X. Qiao et al. [112] have characterized hydroxyapatite nanofibers generated by mineralization of CaAlB3O7 powders in K2HPO4 solutions.

6 FTIR spectroscopy versus RAMAN spectroscopy

A large number of investigations are based on another vibrational spectroscopy, namely Raman [113–116]. As emphasized by K.C. Khulbe and T. Matsuura [117], infrared and Raman spectra of a given molecule complement each other. The symmetrical stretching, ν1 (normal vibration) of CO2 is infrared inactive, but active in Raman. On the contrary, the bending, ν2, and asymmetric stretching, ν3, vibrations are Raman inactive and infrared active.

These differences arise from the fact that infrared spectroscopy exploits an absorption process dependent on the permanent dipolar moment of a molecular bond, while Raman spectroscopy is a scattering process related to a modification of the polarizability (induced change of the dipolar moment) of the molecule.

Recently, C. Krafft et al. [118] have compared these two spectroscopies in colon tissue applications. These authors note that the advantages of FTIR imaging are related to shorter acquisition times and higher spectral quality, while Raman imaging displays better spatial and spectral resolution. Significant differences also exist with respect to the preparation of biological tissue samples. Special attention has to be paid to the support. The metal coated glass slides used as alternatives to the more expensive CaF2 slides have to be approached with caution because of dispersion artifacts in IR spectroscopy in reflection absorption mode [119] and local surface-enhancement effects in Raman spectroscopy. This difficulty has been stressed by several authors. For example, it has become apparent how the tissue handled prior to FTIR micro-spectroscopic imaging requires special attention, particularly with regards to preservation methods [120,121]. More precisely, infrared spectra of cells and tissue samples are prone to baseline distortions from Mie scattering as a result of sample morphology [122]. Also, other authors show that special attention has to be paid to the fixation protocol [123]. For all these reasons, M.J. Baker et al. [124] describe a protocol for collecting IR spectra and images from biological samples (e.g., fixed cytology and tissue sections, live cells or biofluids) that assesses the instrumental options available, appropriate sample preparation, different sampling modes as well as important advances in spectral data acquisition.

In the case of microcalcifications, special attention has also to be paid to the sample preparation procedure, especially to the pH of the fixation solution. This is due to the fact that some chemical phases are very sensitive to the pH and may be transformed or dissolved during the process.

In Raman spectroscopy, the presence of intrinsic autofluorescence background signals, which are usually a few orders of magnitude stronger than those arising from Raman scattering, can be a strong limitation [125] and must be taken into account. Also, because we investigate samples from patients, which are very fragile (organic material), μFTIR, now implemented in the hospital, is preferable to Raman spectroscopy.

7 New opportunities for FTIR beyond the diffraction limit

One major drawback of FTIR microspectroscopy is related to the wavelength of infrared light for which the diffraction-limited spatial resolution is theoretically predicted to be around 5–20 μm in the mid-infrared region (4000–400 cm−1) [126]. To perform FTIR experiments beyond this diffraction limit, it is necessary to collect the signal in the near-field, i.e. at a distance smaller than the wavelength of the probing radiation (2.5–25 μm in the mid-IR). To do so, we use a combination of IR spectroscopy and atomic force microscopy (AFM), a technique which is able to collect nanoscale-resolution images of the sample topography by scanning a sharp tip over the sample.

As discussed previously by G. Ramer et al. [127], two well-established techniques allowing such high-resolution measurements exist. In the case of scattering Scanning Near-field Optical Microscopy or s-SNOM [128,129], the AFM tip is illuminated by a focussed light beam, which produces a strongly enhanced electromagnetic field at the tip apex due to the “lightning rod” effect. More precisely, and as defined by A. Centrone [50], the tip-mediated light-sample interaction modifies the amplitude and phase of the scattered light as a function of the local complex index of refraction. Note that even if the resulting s-SNOM spectral line shapes may not correlate with far-field IR spectra, a simple model where the tip is approximate to a sphere of radius (r) comparable to the tip apex allows interpretation of a large fraction of s-SNOM data. The second technique established by A. Dazzi at Paris-Orsay University is called AFMIR [110,130,131]. It uses the microscale deformation of the sample as it absorbs IR radiation at specific wavelengths to record IR spectra at the nanometer scale. The AFM tip is used to probe the local deformation and allows a topological map of the sample to be recorded at the same time as the chemical image at a single wavenumber. Tunable lasers (OPO, QCL) are used to scan across frequencies and record spectra over large spectral domains. One advantage of the AFMIR technique is that the sample deformation is directly proportional to the absorption and thus that AFMIR spectra are equivalent to conventional far-field IR transmission spectra without the need for further processing, which makes interpretation of the result considerably easier. Coupling of the near-field spectroscopy techniques with synchrotron sources allows broadband nano-IR microscopy in the whole mid-IR spectral domain and extending to the far-IR.

8 Conclusion

In recent years, considerable effort has been exerted to improve the performance of IR spectroscopy. Now, experimental setups able to collect thousands of IR spectra with sufficient signal-to-noise ratio at the micrometer scale in less than one hour are available in hospitals. Several excellent papers using this technology have already been published [132–136]. On large scale instruments or on some specific devices, it is also possible to collect data at the nanometer scale. Thus, the advent of large datasets leading to major scientific breakthroughs in the next few years is crystal clear.

Acknowledgements

This work was supported by the Physics and Chemistry Institutes of CNRS and by contracts ANR-09-BLAN-0120-02, ANR-12-BS08-0022, ANR13JSV10010-01, convergence UPMC CVG1205 and CORDDIM-2013-COD130042. The authors are grateful to the Soleil SR facility for beam time allocation (proposal numbers SMIS-20130016, SMIS-20120070, SMIS-20110084, SMIS-20100566, and SMIS-20100039).


Bibliographie

[1] W. Herschel; J.L.E. Dreyer The Scientific Papers of Sir William Herschel, Royal Society and Royal Astronomical Society, London, 1912

[2] J. Chamberlain The Principles of Interferometric Spectroscopy, Wiley, Chichester, UK, 1979

[3] P.R. Griffiths; J.A. Haseth F.T.-IR Spectroscopy in Chemical Analysis: A Series of Monographs on Analytical Chemistry and its Applications, Wiley, New York, 1986, p. 38

[4] D.C. Fernandez; R. Bhargava; S.M. Hewitt; I.W. Levin Nat. Biotechnol., 23 (2005), p. 469

[5] L.M. Miller; P. Dumas Biochim. Biophys. Acta, 1758 (2006), p. 846

[6] C. Matthäus; B. Bird; M. Miljkovic; T. Chernenko; M. Romeo; M. Diem Methods Cell. Biol., 89 (2008), p. 275

[7] L.M. Miller; P. Dumas Curr. Opin. Struct. Biol., 20 (2010), p. 649

[8] N. Quy Dao; M. Daudon Infrared and Raman Spectra of Calculi, Elsevier, Paris, 1997

[9] M. Daudon; D. Bazin Ann. Biol. Clin., 73 (2015), p. 517

[10] C.M. Giachelli Orthod. Craniofac. Res., 8 (2005), p. 229

[11] S. Mangialardo; V. Cottignoli; E. Cavarretta; L. Salvador; P. Postorino; A. Maras Appl. Spectrosc., 66 (2012), p. 1121

[12] D. Bazin; M. Daudon; C. Combes; C. Rey Chem. Rev., 112 (2012), p. 5092

[13] M.L. Giannossi J. X-ray Sci. Technol., 23 (2015), p. 401

[14] J. Gómez-Morales; G. Falini; J.M. García-Ruiz Handbook of Crystal Growth (T. Nishinaga, ed.), Elsevier, 2015, pp. 873-913

[15] D. Bazin; J.-P. Haymann; E. Letavernier; J. Rode; M. Daudon La Presse Méd, 43 (2014), p. 135

[16] D. Bazin; M. Daudon J. Phys. D, 45 (2012), p. 383001

[17] M. Daudon; P. Jungers; D. Bazin AIP Conf. Proc., 1049 (2008), p. 199

[18] J. Bellanato; J.-L. Rodríguez-Miñón Cifuentes; E. Salvador; J.A. Medina Int. J. Urol., 16 (2009), p. 318

[19] M. Daudon; H. Bouzidi; D. Bazin Urol. Res., 38 (2010), p. 459

[20] A. Dessombz; P. Méria; D. Bazin; E. Foy; S. Rouzière; R. Weil; M. Daudon Prog. Urol., 21 (2011), p. 940

[21] A. Dessombz; D. Bazin; P. Dumas; C. Sandt; J. Sule-Suso; M. Daudon PLoS One, 6 (2012), p. e28007

[22] M.H. Khaskheli; S.T.H. Sherazi; H.M. Ujani; S.A. Mahesar Turk. J. Chem., 36 (2012), p. 477

[23] I. Faklaris; N. Bouropoulos; N.A. Vainos Cryst. Res. Tech, 48 (2013), p. 632

[24] M. Daudon; D. Bazin J. Phys. Conf. Ser., 425 (2013), p. 022006

[25] M. Abdel-Gawad; B. Ali-El-Dein; S. Mehta; K.M. Al-Kohlany; E. Elsobky J. Pediatr. Urol., 10 (2014), p. 1267

[26] A. Primiano; S. Persichilli; G. Gambaro; P.M. Ferraro; A. D'Addessi; A. Cocci; A. Schiattarella; C. Zuppi; J. Gervasoni Dis. Markers (2014), p. 176165

[27] F. Blanco; P. Ortiz-Alías; M. López-Mesas; M. Valiente J. Biophot., 8 (2015), p. 457

[28] R. Siener; N. Buchholz; M. Daudon; B. Hess; T. Knoll; P.J. Osther; J. Reis-Santos; K. Sarica; O. Traxer; A. Trinchieri PLoS One, 11 (2016) no. 6, p. e0156606 | DOI

[29] L. Estepa-Maurice; C. Hennequin; C. Marfisi; C. Bader; B. Lacour; M. Daudon Am. J. Clin. Pathol., 105 (1996), p. 576

[30] E.V. Wilson; M. Junaid Bushiri; V.K. Vaidyan Spectrochim. Acta Part A, 77 (2010), p. 442

[31] S. Gràcia-Garcia; F. Millán-Rodríguez; F. Rousaud-Barón; R. Montañés-Bermúdez; O. Angerri-Feu; F. Sánchez-Martín; H. Villavicencio-Mavrich; A. Oliver-Samper Actas Urol. Esp., 35 (2011), p. 354

[32] H.-K. Ea; C. Nguyen; D. Bazin; A. Bianchi; J. Guicheux; P. Reboul; M. Daudon; F. Lioté Arthr. Rheum., 63 (2011), p. 10

[33] E.V. Yusenko; K.V. Yusenko; I.V. Korolkov; A.A. Shubin; F.P. Kapsargin; A.A. Efremov; M.V. Yusenko Cent. Eur. J. Chem., 11 (2013), p. 2107

[34] M. Pucetaite; V. Hendrixson; A. Zelvys; F. Jankevicius; R. Tyla; J. Ceponkus; V. Sablinskas J. Mol. Struct., 1031 (2013), p. 38

[35] M. Pucetaite; S. Tamosaityte; A. Engdahl; J. Ceponkus; V. Sablinskas; P. Uvdal Cent. Eur. J. Chem., 12 (2014), p. 44

[36] H.H. Chang; C.L. Cheng; P.J. Huang; S.Y. Lin Anal. Bioanal. Chem., 406 (2014), p. 359

[37] A. Dessombz; E. Letavernier; J.-P. Haymann; D. Bazin; M. Daudon J. Urol., 193 (2015), p. 1564

[38] L. Louvet; D. Bazin; J. Büchel; S. Steppan; J. Passlick-Deetjen; Z.A. Massy PLoS One, 10 (2015), p. e0115342

[39] F. Le Naour; C. Sandt; C. Peng; N. Trcera; F. Chiappini; A.-M. Flank; C. Guettier; P. Dumas Anal. Chem., 84 (2012), p. 10260

[40] F. Le Naour; M.-P. Bralet; D. Debois; C. Sandt; C. Guettier; P. Dumas; A. Brunelle; O. Laprévote PLoS One, 4 (2009), p. e7408

[41] V.W. Petit; M. Réfrégiers; C. Guettier; F. Jamme; K. Sebanayakam; A. Brunelle; O. Laprévote; P. Dumas; F. Le Naour Anal. Chem., 82 (2010), p. 3963

[42] C. Murali Krishna; G. Kegelaer; I. Adt; S. Rubin; V.B. Kartha; M. Manfait; G.D. Sockalingum Biochim. Biophys. Acta, 1726 (2005), p. 160

[43] F. Bonnier; S. Rubin; L. Ventéo; C.M. Krishna; M. Pluot; B. Baehrel; M. Manfait; G.D. Sockalingum Biochim. Biophys. Acta, 1758 (2006), p. 968

[44] C.M. Krishna; G. Kegelaer; I. Adt; S. Rubin; V.B. Kartha; M. Manfait; G.D. Sockalingum Biopolymers, 82 (2006), p. 462

[45] F. Bonnier; D. Bertrand; S. Rubin; L. Ventéo; M. Pluot; B. Baehrel; M. Manfait; G.D. Sockalingum Analyst, 133 (2008), p. 784

[46] S. Rubin; F. Bonnier; C. Sandt; L. Ventéo; M. Pluot; B. Baehrel; M. Manfait; G.D. Sockalingum Biopolymers, 89 (2008), p. 160

[47] F. Bonnier; S. Rubin; L. Debelle; L. Ventéo; M. Pluot; B. Baehrel; M. Manfait; G.D. Sockalingum J. Biophot., 1 (2008), p. 204

[48] J. Pijanka; G.D. Sockalingum; A. Kohler; Y. Yang; F. Draux; G. Parkes; K.-P. Lam; D. Collins; P. Dumas; C. Sandt; D.G. Van Pittius; G. Douce; M. Manfait; V. Untereiner J. Sulé-Suso, Lab. Invest, 90 (2010), p. 797

[49] E.B. Wilson; J.C. Decius; P.C. Cross Molecular Vibrations: The Theory of Infrared and Raman Vibrational Spectra, Dover, New York, 1955

[50] A. Centrone Annu. Rev. Anal. Chem., 8 (2015), p. 101

[51] G.P. Williams Nucl. Instr. Methods, 195 (1982), p. 383

[52] W.D. Duncan; G.P. Williams Appl. Opt., 22 (1983), p. 2914

[53] G.L. Carr; M. Hanfland; G.P. Williams Rev. Sci. Instr., 66 (1995), p. 1643

[54] M. Cotte; P. Dumas; M. Besnard; P. Tchoreloff; P. Walter J. Control. Release, 97 (2004), p. 269

[55] P. Dumas; F. Polack; B. Lagarde; O. Chubar; J.L. Giorgetta; S. Lefrançois Infrared Phys. Technol., 49 (2006), p. 152

[56] P. Dumas; G.D. Sockalingum; J. Sulé-Suso Trends Biotechnol., 25 (2007), p. 40

[57] C. Rey; C. Combes; C. Drouet; S. Cazalbou; D. Grossin; F. Brouillet; S. Sarda Prog. Cryst. Growth Charact. Mat, 60 (2014), p. 63

[58] D. Bazin; C. Chappard; C. Combes; X. Carpentier; S. Rouzière; G. André; G. Matzen; M. Allix; D. Thiaudière; S. Reguer; P. Jungers; M. Daudon Osteoporos. Int., 20 (2009), p. 1065

[59] N.J. Harrick Internal Reflection Spectroscopy, Wiley-interscience, New York, 1967

[60] P. M. J. Barton, PhD thesis, Queensland University of Technology, Brisbane, Australia, February 2011].

[61] S.G. Kazarian; K.L.A. Chan; F.H. Tay ATR-FT-IR Imaging for Pharmaceutical and Polymeric Materials: From Micro to Macro Approaches (R. Salzer; H.W. Siesler, eds.), Infrared and Raman Spectroscopic Imaging, John Wiley & Sons, Ltd, Chichester, UK, 2009, pp. 347-375

[62] F. Palombo; H. Shen; L.E.S. Benguigui; S.G. Kazarian; R.K. Upmacis Analyst, 134 (2009), p. 1107

[63] F.H. Tay; S.G. Kazarian Energy & Fuels, 23 (2009), p. 4059

[64] M. Daudon Arch. Pédiatr., 7 (2000), p. 855

[65] X. Carpentier; M. Daudon; O. Traxer; P. Jungers; A. Mazouyes; G. Matzen; E. Véron; D. Bazin Urology, 73 (2009), p. 968

[66] D. Bazin; G. André; R. Weil; G. Matzen; E. Véron; X. Carpentier; M. Daudon Urology, 79 (2012), p. 786

[67] M. Daudon Rev. Med. Suisse Romande, 124 (2004), p. 445

[68] M. Daudon; D. Bazin Application of Physical Methods to Kidney Stones and Randall's Plaque Characterization, Urolithiasis: Basic Science and Clinical Practice, Springer-Verlag, London, 2012, pp. 683-707

[69] J. Cloutier; L. Villa; O. Traxer; M. Daudon World J. Urol., 33 (2015), p. 157

[70] D. Sheng; F. Xu; Q. Yu; T. Fang; J. Xia; S. Li; X. Wang J. Mol. Struct., 1099 (2015), p. 18

[71] K. Thumanu; S. Sangrajrang; T. Khuhaprema; A. Kalalak; W. Tanthanuch; S. Pongpiachan; P. Heraud J. Biophot., 7 (2014), p. 222

[72] S.Y. Lee; K.-A. Yoon; S.H. Jang; E.O. Ganbold; D. Uuriintuya; S.-M. Shin; P.D. Ryu; S.-W. Joo J. Vet. Sci., 10 (2009), p. 299

[73] X. Wang; X. Shen; D. Sheng; X. Chen; X. Liu Spectrochim. Acta Part A, 122 (2014), p. 193

[74] Y. Xu; L. Yang; Z. Xu; Y. Zhao; X. Ling; Q. Li; J. Wang; N. Zhang; Y. Zhang; J. Wu Sci. China Ser. B, 48 (2005), p. 167

[75] D. Sheng; Y. Wu; X. Wang; D. Huang; X. Chen; X. Liu Spectrochim. Acta Part A, 116 (2013), p. 365

[76] E. Giorgini; P. Balercia; C. Conti; P. Ferraris; S. Sabbatini; C. Rubini; G. Tosi J. Mol. Struct., 1051 (2013), p. 226

[77] S. Kumar; T.S. Shabi; E. Goormaghtigh PLoS One, 9 (2014) no. 11, p. e111137

[78] J. Anastassopoulou; E. Boukaki; C. Conti; P. Ferraris; E. Giorgini; C. Rubini; S. Sabbatini; T. Theophanides; G. Tosi Vibr. Spectrosc., 51 (2009), p. 270

[79] E. Gazi; N.P. Lockyer; J.C. Vickerman; P. Gardner; J. Dwyer; C.A. Hart; M.D. Brown; N.W. Clarke; J. Miyan App. Surf. Sci., 231–232 (2004), p. 452

[80] E.P. Paschalis; E. DiCarlo; F. Betts; P. Sherman; R. Mendelsohn; A.L. Boskey Calc. Tissue Int., 59 (1996), p. 480

[81] K. Belbachir; R. Noreen; G. Gouspillou; C. Petibois Anal. Bioanal. Chem., 395 (2009), p. 829

[82] S. Yoshida; Q.-Z. Zhang; S. Sakuyama; S. Matsushima Lipids Health Dis., 8 (2009), p. 28

[83] J. Kowalska; M. Gajda; W.M. Kwiatek; M. Franczyk-Zarów; R.B. Kostogrys; S. Chlopicki; C. Sandt; P. Dumas Acta Phys. Pol. A, 2012 (2012) no. 121, pp. 555-560

[84] D.P. Jerônimo; R. Aparecido de Souza; F. Fernandes da Silva; G.L. Camargo; H. Lameira Miranda; M. Xavier; K.K. Sakane; W. Ribeiro Ann. Biomed. Eng., 40 (2012), p. 2069

[85] P.R. Palaniappan; V. Vijayasundaram Microchem. J., 91 (2009), p. 118

[86] W. André; C. Sandt; P. Dumas; P. Djian; G. Hoffner Anal. Chem., 85 (2013), p. 3765

[87] N. Benseny-Cases; O. Klementieva; M. Cotte; I. Ferrer; J. Cladera Anal. Chem., 86 (2014), p. 12047

[88] J. Chwiej; A. Skoczen; K. Janeczko; J. Kutorasinska; K. Matusiak; H. Figiel; P. Dumas; C. Sandt; Z. Setkowicz Analyst, 140 (2015), p. 2190

[89] A.D. Surowka; D. Adamek; M. Szczerbowska-Boruchowska Analyst, 140 (2015), p. 2428

[90] E. Maximin; B. Langelier; J. Aïoun; K.H. Al-Gubory; C. Bordat; M. Lavialle; C. Heberden Dev. Neurobiol., 76 (2016), p. 287

[91] J.C. Tsai; C.Y. Lin; H.M. Sheu; Y.L. Lo; Y.H. Huang Pharm. Res., 20 (2003), p. 632

[92] Z.W. Ye; Y. Ying; X.L. Yang; Z.Q. Zheng; J.N. Shi; Y.F. Sun; P. Hu J. Inclusion Phenom. Macrocycl. Chem., 78 (2014), p. 405

[93] A. Mignolet; A. Derenne; M. Smolina; B.R. Wood; E. Goormaghtigh Biochim. Biophys. Acta, 1864 (2016), p. 85

[94] A. Derenne; R. Gasper; E. Goormaghtigh Analyst, 136 (2011), p. 1134

[95] A.K. Rosenthal; N. Mandel Curr. Rheumatol. Rep., 3 (2001), p. 11

[96] A. Travo; C. Paya; G. Déléris; J. Colin; B. Mortemousque; I. Forfar Anal Bioanal. Chem., 406 (2014), p. 2367

[97] C.M. Orphanou Forensic Sci. Int., 252 (2015), p. e10

[98] V. Erukhimovitch; M. Talyshinsky; Y. Souprun; M. Huleihel DNA Viruses, 292 (2005), p. 161

[99] C. Chonanant; N. Jearanaikoon; C. Leelayuwat; T. Limpaiboon; M.J. Tobin; P. Jearanaikoon; P. Heraud Analyst, 136 (2011), p. 2542

[100] C. Sandt; J. Frederick; P. Dumas J. Biophot., 6 (2013), p. 60

[101] A.V. Rutter; M.R. Siddique; J. Filik; C. Sandt; P. Dumas; G. Cinque; G.D. Sockalingum; Y. Yang; J. Sulé-Suso Cytom. Part A, 85 (2014), p. 688

[102] G. Bellisola; M. Bolomini Vittori; G. Cinque; P. Dumas; Z. Fiorini; C. Laudanna; M. Mirenda; C. Sandt; L. Silvestri Tomasello; M. Vezzalini; K. Wehbe; C. Sorio Analyst, 140 (2015), p. 4407

[103] C. Kirschner; K. Maquelin; P. Pina; N.A. Ngo; Thi L.P. Choo-Smith; G.D. Sockalingum; C. Sandt; D. Mai; F. Orsini; S.M. Doglia; P. Allouch; M. Manfait; G.J. Puppels; D. Naumann J. Clin. Microbiol., 39 (2001), p. 1763

[104] M. Essendoubi; D. Toubas; M. Bouzaggou; J.-M. Pinon; M. Manfait; G.D. Sockalingum Biochim. Biophys. Acta, 1724 (2005), p. 239

[105] S. Clède; N. Delsuc; C. Laugel; F. Lambert; C. Sandt; A. Baillet-Guffroy; C. Policar Chem. Commun., 51 (2015), p. 2687

[106] S. Clède; C. Policar Chem. Eur. J., 21 (2015), p. 942

[107] E. Fernandez; G. Rodriguez; S. Hostachy; S. Clède; M. Cócera; C. Sandt; F. Lambert; A. de la Maza; C. Policar; O. López Colloids Surfaces B Biointerfaces, 131 (2015), p. 102

[108] S. Clède; F. Lambert; R. Saint-Fort; M.A. Plamont; H. Bertrand; A. Vessières; C. Policar Chem. Eur. J., 20 (2014), p. 8714

[109] S. Clède; C. Policar; C. Sandt Appl. Spectrosc., 68 (2014), p. 113

[110] S. Clède; F. Lambert; C. Sandt; S. Kascakova; M. Unger; E. Harté; M.A. Plamont; R. Saint-Fort; A. Deniset-Besseau; Z. Gueroui; C. Hirschmugl; S. Lecomte; A. Dazzi; A. Vessières; C. Policar Analyst, 138 (2013), p. 5627

[111] S. Clède; F. Lambert; C. Sandt; Z. Gueroui; N. Delsuc; P. Dumas; A. Vessières; C. Policar Biotechnol. Adv., 31 (2013), p. 393

[112] X. Qiao; Y. Huang; H. Cheng; H.J. Seo Mater. Lett., 161 (2016), p. 459

[113] R. Manoharan; Y. Wang; M.S. Feld Spectrochim. Acta Part A, 52 (1996), p. 215

[114] C. Krafft; V. Sergo Spectroscopy, 20 (2006), p. 195

[115] Q. Tu; Ch Chang Nanomed. Nanotechnol. Biol. Med., 8 (2012), p. 545

[116] M. Vendrell; K.K. Maiti; K. Dhaliwal; Y.-T. Chang Trends Biotechnol., 31 (2013), p. 249

[117] K.C. Khulbe; T. Matsuura Polymer, 41 (2000), p. 1917

[118] C. Krafft; D. Codrich; G. Pelizzo; V. Sergo J. Biophot., 1 (2008), p. 154

[119] M. Romeo; M. Diem Vibr. Spectrosc., 38 (2005), p. 129

[120] V. Zohdi; D.R. Whelan; B.R. Wood; J.T. Pearson; K.R. Bambery; M.J. Black PLoS One, 10 (2015), p. e0116491

[121] E. Gazi; P. Gardner Preparation of tissues and cells for infrared and Raman spectroscopy and imaging (G. Srinivasan, ed.), Vibrational Spectroscopic Imaging for Biomedical Applications, McGraw-Hill, New York, 2010, pp. 59-98

[122] P. Bassan; H.J. Byrne; F. Bonnier; J. Lee; P. Dumas Analyst, 134 (2009), p. 1586

[123] A.I. Mazur; E.J. Marcsisin; B. Bird; M. Miljkovic; M. Diem Anal. Chem., 84 (2012), p. 8265

[124] M.J. Baker; J. Trevisan; P. Bassan; R. Bhargava; H.J. Butler; K.M. Dorling; P.R. Fielden; S.W. Fogarty; N.J. Fullwood; K.A. Heys; C. Hughes; P. Lasch; P.L. Martin-Hirsch; B. Obinaju; G.D. Sockalingum; J. Sulé-Suso; R.J. Strong; M.J. Walsh; B.R. Wood; P. Gardner; F.L. Martin Nat. Protoc., 9 (2014), p. 1771

[125] J. Zhao; H. Lui; D.I. Mclean; H. Zeng Appl. Spectrosc., 61 (2007), p. 1225

[126] C. Matthäus; B. Bird; M. Miljković; T. Chernenko; M. Romeo; M. Diem Methods Cell Biol., 89 (2008), p. 275

[127] G. Ramer; A. Balbekova; A. Schwaighofer; B. Lendl Anal. Chem., 87 (2015), p. 4415

[128] N. Ocelic; A. Huber; R. Hillenbrand Appl. Phys. Lett., 89 (2006), p. 101124

[129] M. Brehm; T. Taubner; R. Hillenbrand; F. Keilmann Nano Lett., 6 (2006), p. 1307

[130] A. Dazzi; R. Prazeres; F. Glotin; J.M. Ortega Opt. Lett., 30 (2005), p. 2388

[131] A. Dazzi; C.B. Prater; Q. Hu; D.B. Chase; J.F. Rabolt; C. Marcott Appl. Spectrosc., 66 (2012), p. 1366

[132] H.J. Gulley-Stahl; J.A. Haas; K.A. Schmidt; A.P. Evan; A.J. Sommer Appl. Spectrosc., 63 (2009), p. 759

[133] H.J. Gulley-Stahl; S.B. Bledsoe; A.P. Evan; A.J. Sommer Appl. Spectrosc., 64 (2010), p. 15

[134] K.J. Mulready; D. McGoldrick Urol. Res., 40 (2012), p. 483

[135] I. Singh Int. Urol. Nephrol., 40 (2008), p. 595

[136] A.P. Evan; J.E. Lingeman; F.L. Coe; S.B. Bledsoe; A.J. Sommer; J.C. Williams; A.E. Krambeck; E.M. Worcester Kidney Int., 76 (2009), p. 1081


Commentaires - Politique


Ces articles pourraient vous intéresser

Foreword to microcrystalline pathologies: combining clinical activity and fundamental research at the nanoscale

Dominique Bazin; Michel Daudon; Vincent Frochot; ...

C. R. Chim (2022)


Combining field effect scanning electron microscopy, deep UV fluorescence, Raman, classical and synchrotron radiation Fourier transform Infra-Red Spectroscopy in the study of crystal-containing kidney biopsies

Dominique Bazin; Chantal Jouanneau; Sergio Bertazzo; ...

C. R. Chim (2016)


Profile of an “at cutting edge” pathology laboratory for pathological human deposits: from nanometer to in vivo scale analysis on large scale facilities

Dominique Bazin; Ivan T. Lucas; Stéphan Rouzière; ...

C. R. Chim (2022)