

1 Introduction
Calcium oxalate (CaOx) calculi are presently the predominant type of urinary calculi throughout the world. In France, they account for 75% of all calculi in men and 60% in women. CaOx stones may contain one or several crystalline forms among the three crystalline species of CaOx identified in the urine of humans, namely calcium oxalate monohydrate (COM) or whewellite, calcium oxalate dihydrate (COD) or weddellite and, more scarcely, calcium oxalate trihydrate (COT) or caoxite. Although the supersaturation level of CaOx is the well established major factor that determines the propensity to form urinary CaOx crystals [1], the respective influence of the urinary concentration of calcium (Ca) and oxalate (Ox) ions on the crystalline phase of CaOx, either monohydrate or dihydrate, is controversial [2–6].
In experimental models, the molar concentration of oxalate was shown to have a greater influence on CaOx crystallization than an equimolar calcium concentration [7]. In our experience [8], the formation product of calcium oxalate (FPCaOx) was decreasing with the CaOx molar product (pCaOx) while oxalate concentration was increasing and calcium concentration was decreasing, thus providing evidence that the molar concentration of oxalate has a greater effect than that of calcium on the CaOx crystallization. However, given the solubility product (Ksp) of CaOx in water at 37 °C, in the range of 2.2 to 3.6 × 10⁻⁹ mol/L [9,10], all urine samples appear dramatically supersaturated and therefore should contain numerous CaOx crystals, which is not the case. Indeed, in normal urine, the average pCaOx value is around 6.10−7 (mmol/l)2 and no CaOx crystal is found in most cases. Indeed, urine is a complex medium containing numerous electrolytes including ions able to interfere specifically with calcium or oxalate ions, thus reducing the actual CaOx molar product and the CaOx relative supersaturation. These ions are Mg2+, citrate3−, HPO42−, H2PO4−, SO42−, and P2O72−, in various combinations. In addition, according to the Debye–Huckel equation, the ionic strength of the medium, mainly related to the content of Na+, K+ and Cl− also contributes significantly to reduce CaOx supersaturation and thus to increase FPCaOx.
In healthy subjects, the average molar concentration of urine calcium (range of 3 mmol/l) is about ten times greater than that of oxalate (range of 0.3 mmol/l) so that a proportional increase of molar concentration for either oxalate or calcium has a similar effect on calcium oxalate supersaturation [11]. Moreover, in humans, a marked increase in urinary calcium excretion without a concomitant increase in oxalate excretion is frequent in stone formers with idiopathic hypercalciuria, thus considerably increasing the molar Ca/Ox ratio, whereas reciprocally a marked increase in urinary oxalate concentration without a concomitant increase in calcium concentration is only observed in some pathological conditions, such as primary hyperoxaluria.
Thus, different values of the Ca/Ox ratio may be observed within the same CaOx molar product (pCaOx), resulting in the formation of distinct crystalline phases of CaOx crystals [8]. Indeed, correlations between stone composition and urinary parameters have shown that patients with hyperoxaluria preferentially form calculi made of COM whereas those with hypercalciuria form calculi mainly made of COD [12–14] and such was our experience [8,15–17]. However, COM is the thermodynamically stable form of CaOx, and so all other crystalline forms may convert into COM with time. This phenomenon was reported to be fast for calcium oxalate trihydrate (COT), which is able to convert into COM within a few minutes in vitro at 37 °C [18]. At variance with such experimental models, we occasionally found calculi containing COT that had stayed several months or years in the urinary tract. Regarding the crystalline conversion from COD to COM in vivo, a number of reports underline the frequent occurrence of crystalline structures at the surface or within stones suggestive of initial COD formation while polarized light microscopy, infrared spectroscopy or X-ray analysis provide evidence of a high COM content [9–22]. However, the kinetics of such a crystalline conversion is poorly understood [23]. We have incubated a pure COD stone within human urine at 37 °C for several months and failed to observe any transformation of COD to COM (unpublished data). Therefore, what are the biochemical conditions that favor in vivo the primary formation of the various crystalline species of CaOx in urine? It is a very important point from a clinical point of view if we consider that around 60% of stones are predominantly made of COM while 20–25% contain COD as the main component. Because COT crystals are infrequent in urine and calculi, we restricted our investigation to the more common crystalline forms of CaOx, namely COM and COD.
Therefore, we examined the relationship between urinary concentrations of Ca and Ox and the type of CaOx crystals, either COM or COD, in the same urine samples and determined the effects of gradual increments in Ca and Ox molar concentration on the respective risk of formation of COM or COD crystals.
2 Materials and methods
We examined 1288 first morning urine samples from 407 idiopathic calcium oxalate stone formers who had CaOx crystalluria made up of either COM or COD. In every sample, we determined the concentration of calcium and oxalate. Morphologic identification of urinary crystals was made by polarization microscopy, as described elsewhere [24].
In the first part of the study, we determined in stone formers the mean values of urinary Ca and Ox concentrations in urine samples containing only either COM or COD crystals, and reciprocally, we examined the type of crystals with respect to the ratio of Ca to Ox concentration.
In the second part of the study, we examined by logistic regression analysis the effects of increasing concentrations of Ca or Ox above the average values observed in first morning urine samples from 227 healthy subjects. Among 267 healthy controls in our database, 40 (15%) exhibited calcium oxalate crystals in their urine. COD crystals accounted for 92.5% of cases and COM crystals were found in only 2.6% of urine samples (7.5% of samples containing calcium oxalate crystals). Mean calcium and oxalate values found in these samples were very similar to the respective values observed in urine samples of stone formers with calcium oxalate crystals (data no shown). So, we retained 227 urine samples from healthy controls without calcium oxalate crystals. The mean value for calcium and oxalate concentration was 3.31 ± 2.14 mmol/l and 0.35 ± 0.17 mmol/l, respectively, taken as reference values (relative risk 1) in the absence of COM or COD crystalluria.
In the last part of the study, we examined the presence of calcium oxalate crystalluria in relation with pCaOx and the molar calcium/oxalate ratio (rCaOx). For this purpose, we designed a nomogram for calcium oxalate crystallization based on the microscopic examination of 30,250 urine samples from stone formers.
All statistical comparisons regarding biochemistry of urine with or without crystals (ANOVA), the distribution of crystalline phases according to rCaOx (Chi2 test) and logistic regression analyses to assess the relative risk of forming either COM or COD crystals were performed with the NCSS statistical package (J. Hintz, Gainesville, FL, USA). A p value less than 0.05 was considered as statistically significant.
3 Results
Biochemical data for each group are summarized in Table 1.
Biochemical data in urine of stone formers and healthy subjects.
| Calcium oxalate stone formers | Healthy subjects | ||
| Solutes | Urine samples with COM crystals | Urine samples with COD crystals | Urine samples without crystals |
| No of samples | 363 | 925 | 227 |
| Calcium | 2.32 ± 1.98***, °°° | 7.34 ± 3.11°°° | 3.31 ± 2.14 |
| Oxalate | 0.58 ± 0.43***, °°° | 0.38 ± 0.18 | 0.35 ± 0.17 |
| Phosphate | 22.72 ± 16.27*** | 30.84 ± 14.36 | 26.95 ± 17.1 |
| Urate | 2.27 ± 1.48***, °° | 3.03 ± 1.21 | 2.76 ± 1.34 |
| Citrate | 1.48 ± 1.42***, °°° | 2.33 ± 1.64 | 2.32 ± 1.74 |
| Magnesium | 2.90 ± 2.38***, °° | 4.78 ± 2.11°°° | 3.63 ± 1.34 |
| Sodium | 82 ± 45***, °°° | 99 ± 42 | 108 ± 55 |
| Potassium | 35 ± 23 | 34 ± 17°° | 41 ± 26 |
| Chloride | 78 ± 49 | 85 ± 42 | 90 ± 51 |
| Urea | 268 ± 154***, °° | 356 ± 112°° | 315 ± 141 |
| Creatinine | 9,26 ± 6.39***, °°° | 14.08 ± 5.37 | 12.61 ± 6.67 |
The mean concentration of oxalate ions was higher in urine samples containing pure COM crystals than in those containing pure COD crystals (0.58 ± 0.43 vs 0.38 ± 0.18 mmol/l, p < 0.0001) whereas conversely the mean concentration of calcium ions was markedly higher in urine samples purely containing COD than in those containing COM crystals (7.34 ± 3.11 vs 2.32 ± 1.98 mmol/l, p < 0.0001). Of note, in urine samples containing pure COD crystals, oxalate concentration did not differ from the mean value found in healthy controls whereas calcium concentration was more than twofold higher than in healthy subjects.
As shown in Fig. 1, the proportion of urine samples exhibiting CaOx crystals is increasing in parallel with oxalate concentration, with an inflexion point around 0.3 mmol/l, more precisely 0.31 mmol/l. Above this threshold, more than 43% of all samples contained crystals, whereas below this value less than 22% of samples exhibited CaOx crystals.
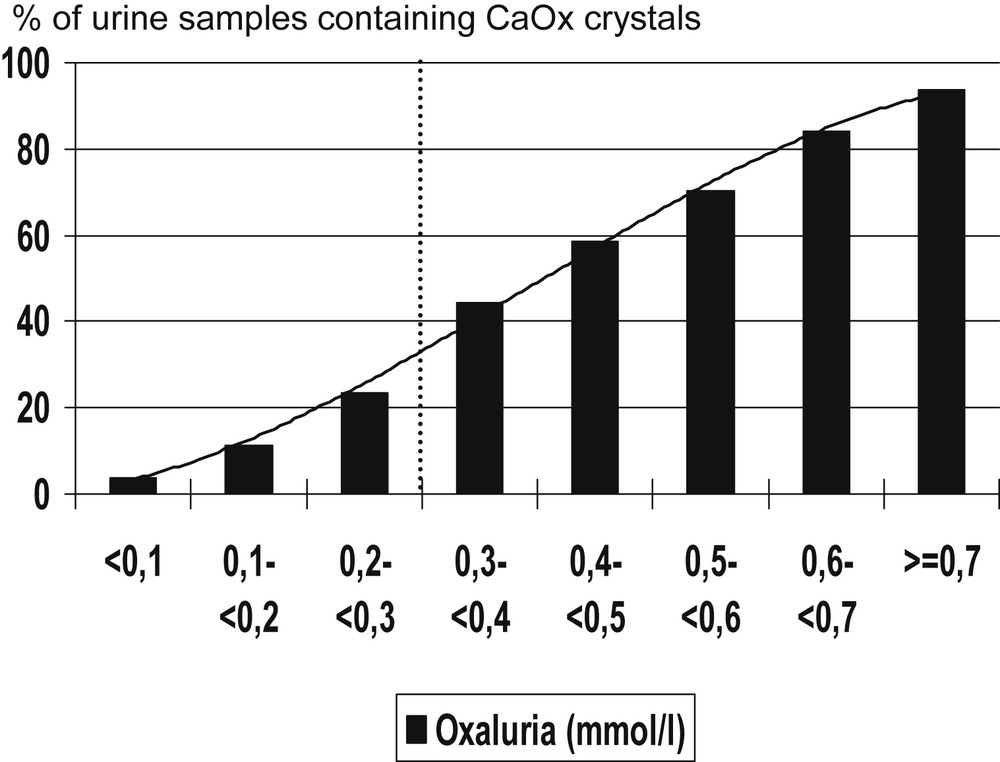
Influence of urine oxalate concentration on the occurrence of calcium oxalate crystals in kidney stone formers.
With respect to calcium concentration (Fig. 2), an inflexion point was found around 3.8 mmol/l. More than 40% of urine samples contained CaOx crystals for calcium concentrations above this threshold versus less than 18% below this value.
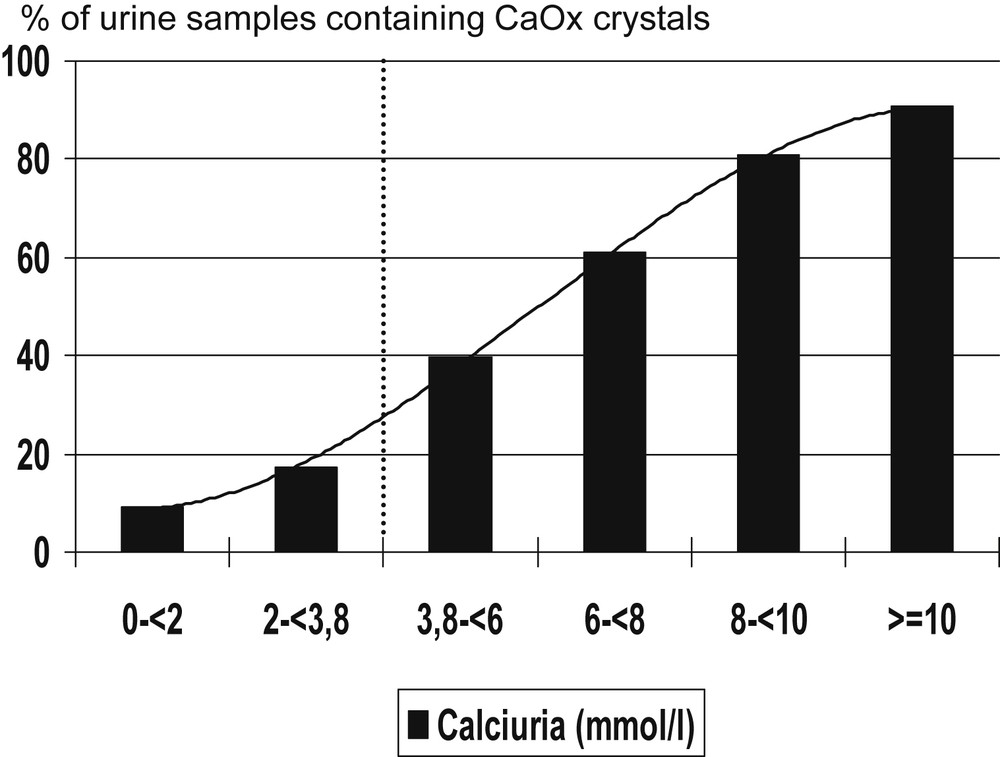
Influence of urine calcium concentration on the occurrence of calcium oxalate crystals in kidney stone formers.
Of note, neither high oxalate concentration nor high calcium concentration alone is able to induce CaOx crystal formation in 100% of urine samples. As expected, the main driving force for CaOx crystallization is pCaOx. The occurrence of CaOx crystalluria increased up to 100% of urine samples for pCaOx values above 4.5 (mmol/l)2 in stone formers, and healthy controls as well (Fig. 3).
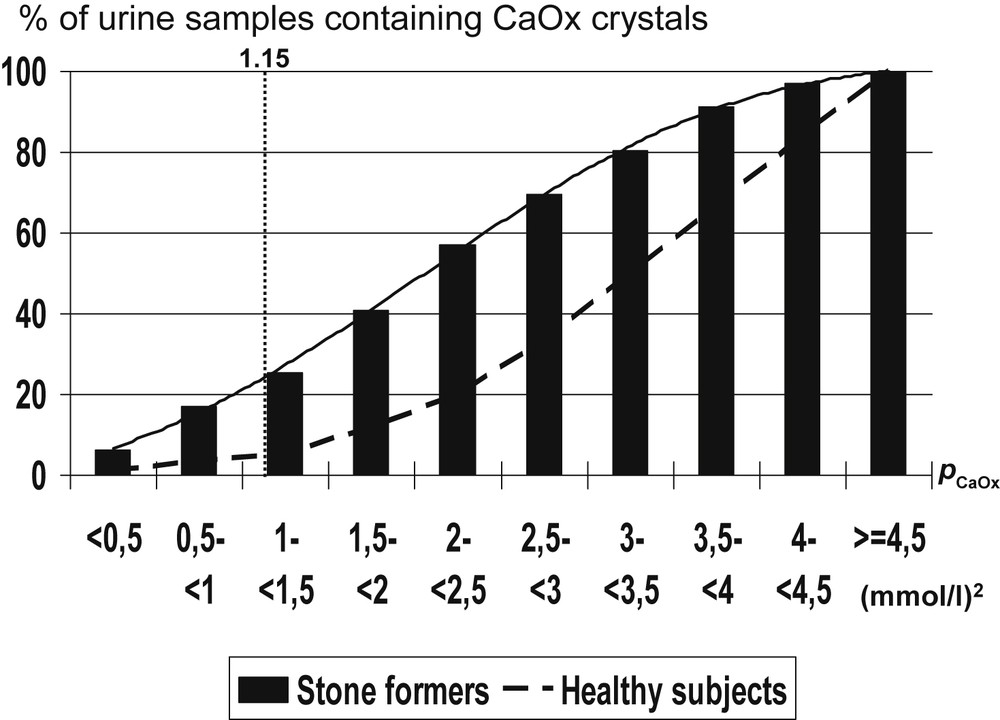
Influence of the calcium oxalate molar product (pCaOx) on the occurrence of calcium oxalate crystals in urine of kidney stone formers.
Interestingly, when comparing urine samples from stone formers and healthy subjects, significant differences were found regarding the occurrence of CaOx crystalluria for most values of pCaOx ranging from 0.5 to 4 (mmol/l)2. The frequency of CaOx crystalluria was lower in healthy subjects than in stone formers for any pCaOx value below 4.5 (mmol/l)2, thus suggesting an imbalance between promoters and inhibitors of crystallization or a defect of inhibitors in stone formers conversely to healthy subjects.
The molar calcium/oxalate ratio (rCaOx) seems to be an important factor determining the crystalline phase of CaOx. Low values of the rCaOx ratio are associated with higher frequency of COM crystalluria, whereas conversely high values of rCaOx are associated with COD crystalluria. As shown in Fig. 4, COM crystals were predominant (93%) in urine samples with a rCaOx < 5 (i.e. with relative hyperoxaluria), either as pure COM crystals (64%) or COM mixed with COD crystals (29%). Conversely, COD crystals were largely predominant (98%), mainly as pure COD crystals (87%), in urine samples with a rCaOx > 14 (i.e. markedly hypercalciuric). In the intermediate Ca/Ox values, COD crystals accounted for 84%, either pure (51%) or mixed with COM (33%). The data were collected from 6869 urine samples that contained calcium oxalate crystals identified by polarizing microscopy.
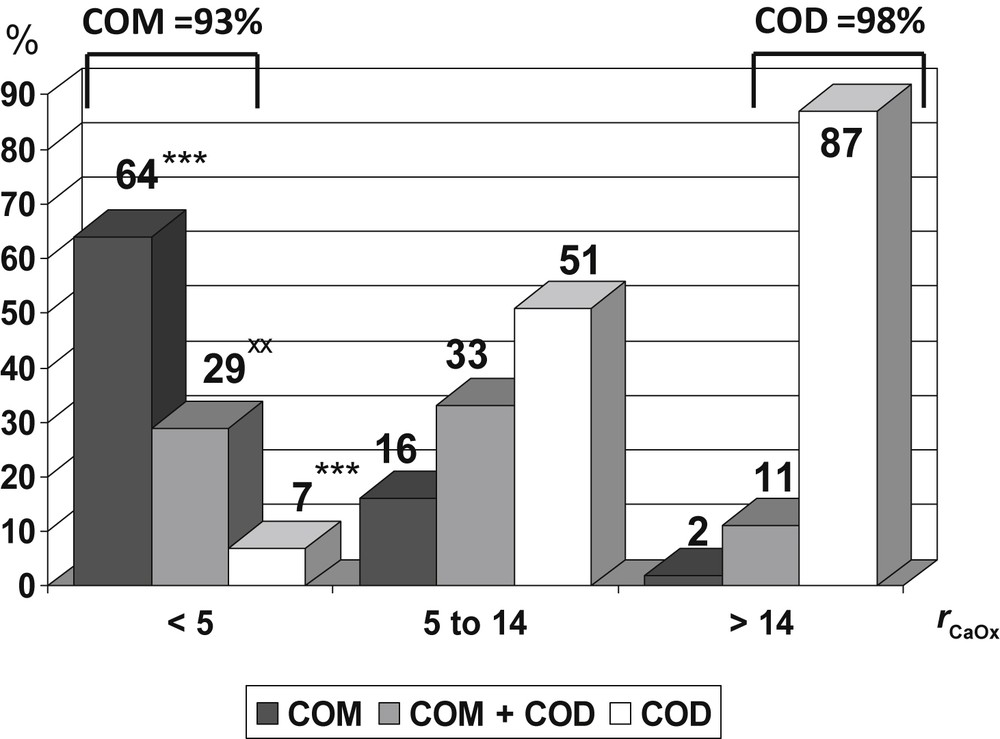
Influence of the molar calcium/oxalate ratio (rCaOx) on the crystalline phases of CaOx observed in urine. Data collected from 6869 urine samples that contained calcium oxalate crystals. *** p < 0.00001 versus 5 ≤ rCaOx < 14 and versus rCaOx > 14. xx p < 0.001 versus 5 ≤ rCaOx < 14.
Fig. 5 shows the effect of graded increments in calcium and oxalate concentration above a basal level (3.3 mmol/l for calcium, 0.35 mmol/l for oxalate: relative risk=1) on the relative risk of forming COM and COD crystals in urine. The influence of increasing solute concentrations was especially marked for the highest values of calcium and oxalate. A 100% (twofold) increase in calcium concentration was associated with a 35 times higher risk of COD crystal formation (Fig. 5B), but only a 4 times higher risk of COM crystal formation (Fig. 5A). Conversely, a twofold increase in oxalate concentration was associated with a 38 times higher risk of COM crystal formation (Fig. 5A), but with only a 4 times higher risk of COD crystal formation (Fig. 5B).
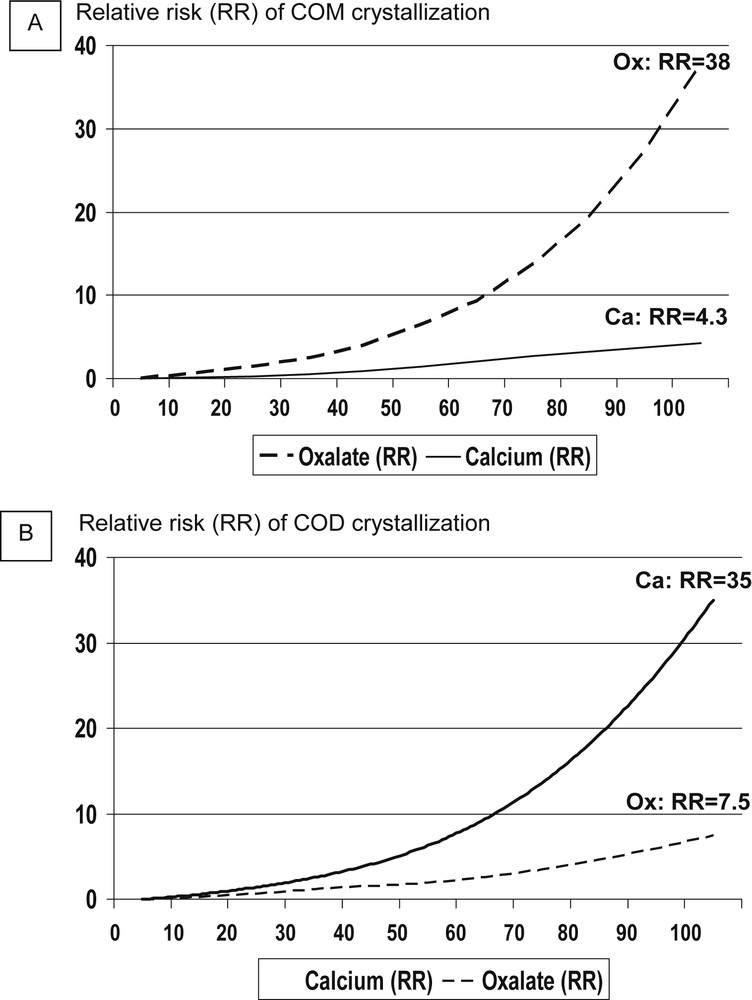
Relative influence of calcium and oxalate concentration on the relative risk to form COM (Fig. 5A) and COD (Fig. 5B) crystals in the urine of stone formers.
The risk of stone formation is closely related to the occurrence of crystals in urine. In a prospective clinical study, we found that presence of crystals in more than 50% of first morning urine samples in a given patient was associated with stone recurrence in 88% of cases in the absence of specific preventive measures [25]. However, each patient has a peculiar urine profile depending on the balance between promoters and inhibitors of crystallization, including unmeasured macromolecules. As a result, certain patients are more sensitive to the effects of increasing calcium whereas other subjects are more sensitive to the effect of increasing oxalate at the risk of CaOx crystal formation.
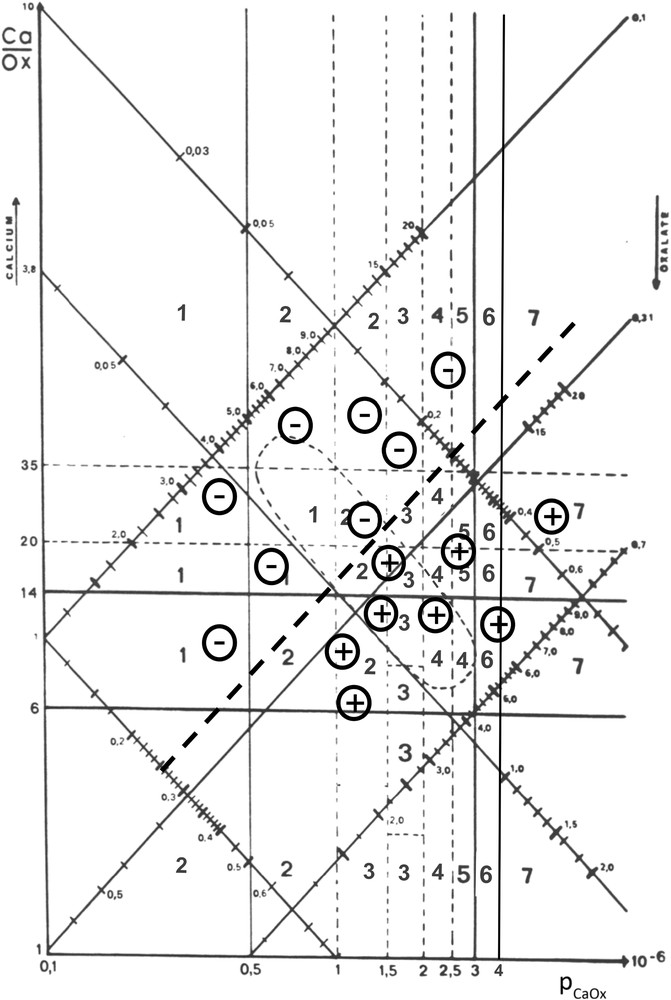
In order to assess the individual risk of CaOx crystal formation, we developed a nomogram based on the microscopic examination of more than 30,000 urine samples. Calcium and oxalate were determined in each sample as well as the presence and the crystalline form of CaOx crystals. The nomogram was constructed in logarithmic scale. The ordinate was the rCaOx while the abscissa was pCaOx. Thus, calcium concentration was increasing and conversely oxalate concentration was decreasing from the bottom to the top of the vertical axis, whereas the pCaOx value was increasing from the left to the right part of the horizontal axis. The threshold values of 0.31 mmol/l for oxalate and 3.8 mmol/l for calcium were used to illustrate areas corresponding to four possible conditions (Fig. 6):
- - normal area with calcium <3.8 mmol/l and oxalate <0.31 mmol/l.
- - hypercalciuria area with calcium ≥3.8 mmol/l and oxalate <0.31 mmol/l.
- - hyperoxaluria area with oxalate ≥0.31 mmol/l and calcium <3.8 mmol/l.
- - both hyperoxaluria and hypercalciuria area with oxalate ≥0.31 mmol/l and calcium ≥3.8 mmol/l.
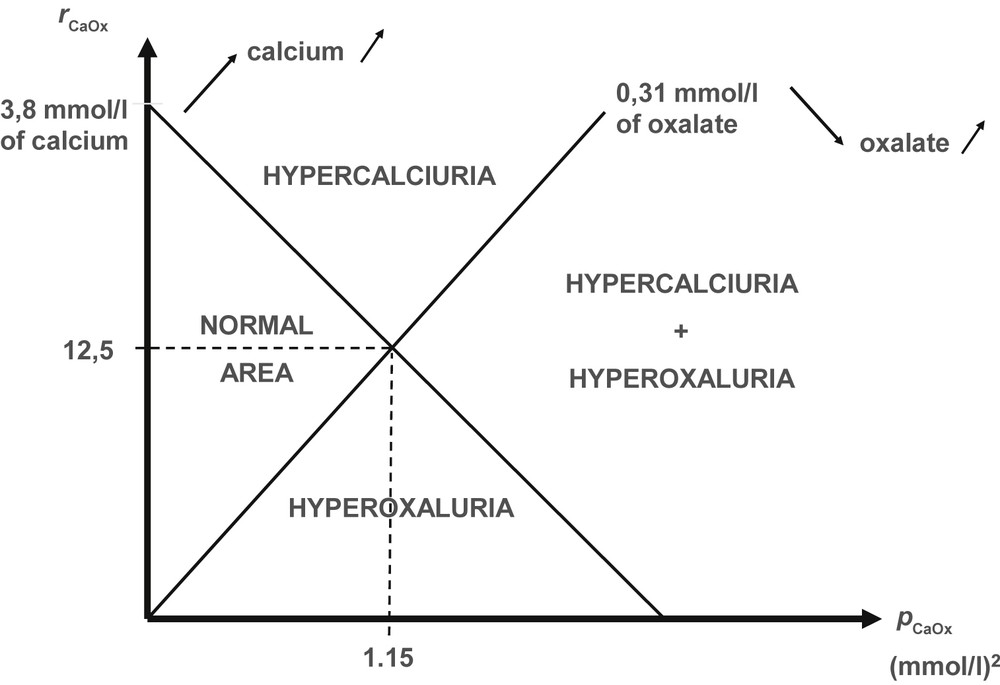
Schematic representation of the different areas on the calcium oxalate crystallization nomogram according to calcium and oxalate concentrations in the urine of stone former patients.
According to various levels for rCaOx and pCaOx values, we divided the nomogram into quadrants and we determined the global frequency of CaOx crystalluria for each quadrant. The score for the observed crystalluria was established as described in Table 2.
Crystallization score related to the frequency of CaOx crystalluria (fc).
| Frequency (%) of CaOx crystalluria | Crystallization score | Clinical risk of stone formation |
| 0 < fc ≤ 10 | 1 | very low |
| 10 < fc ≤ 25 | 2 | low |
| 25 < fc ≤ 40 | 3 | medium |
| 40 < fc ≤ 60 | 4 | moderately increased |
| 60 < fc ≤ 75 | 5 | high |
| 75 < fc ≤ 90 | 6 | very high |
| 90 < fc ≤ 100 | 7 | maximum |
Finally, to allow an easy graphic use of the nomogram, we reported calcium and oxalate scales allowing to join by a straight line the points corresponding to the same value on the two scales. Thus, the urine point corresponding to given values for calcium and oxalate corresponds to a quadrant affected of a crystallization score. Based on the previous prospective study of stone recurrence in calcium stone formers, we established a predictive clinical risk of stone formation. Thus, all crystallization score values from 4 to 7 suggest an increased risk of stone formation, the maximum (score 7) corresponding to quadrants where more than 90% of the urine samples contain CaOx crystals. The resulting nomogram is shown in Fig. 7. Our data suggest that urine samples with a pCaOx value above 2 (mmol/l)2 are more at risk of favoring stone recurrence than urine samples with a pCaOx below this threshold. As expected, urine samples with a low pCaOx (<1 (mmol/l)2) are associated with the lowest risk of crystallization. Thus, the clinical objective is to reduce pCaOx by dietary measures and increased diuresis. Note that the ellipsoid area gathers together around 50% of all urine samples from stone formers.
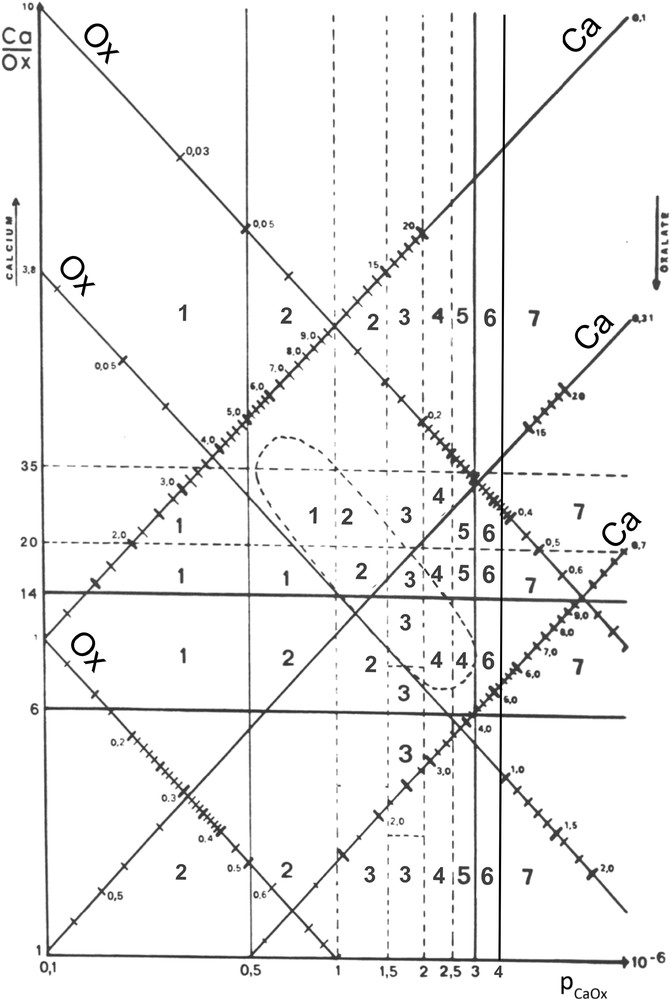
Calcium oxalate crystallization nomogram with crystallization score values.
When all urine samples of a patient are reported in the nomogram, different situations can be observed, reflecting the own urine balance between promoters and inhibitors of the patient. Such finding may be clinically relevant for managing preventive measures in order to avoid or delay stone recurrence. Some examples are given in Figs. 8 and 9.
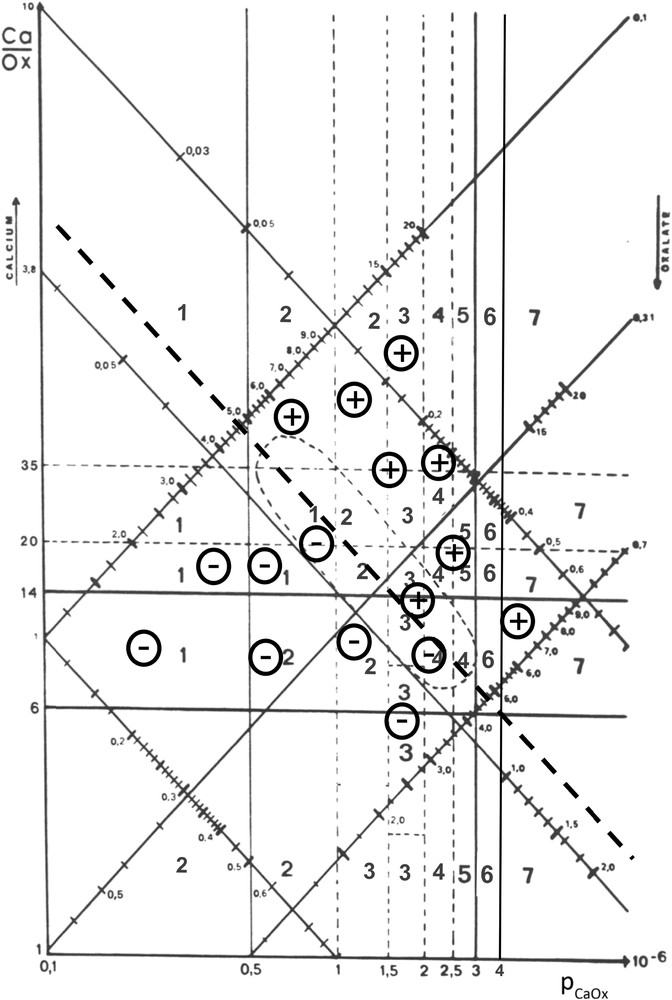
Example of a calcium-dependent risk of CaOx crystallization in urine.
Example of an oxalate-dependent risk of CaOx crystallization in urine.
In Fig. 8, all urine samples examined for a given patient over a five year period clearly provide evidence that the presence of CaOx crystals (+) was mainly dependent on the calcium concentration since no crystal was observed when urine calcium was below 4.75 mmol/l. By contrast, crystalluria was negative (−) for relatively high oxalate concentrations (0.55 mmol/l).
Fig. 9 illustrates another situation. All urine samples where oxalate concentration was higher than 0.26 mmol/l contained CaOx crystals, even when calcium concentration was normal (3.2 mmol/l). By contrast, none of the samples below this threshold exhibited CaOx crystals despite a high calcium concentration (up to 13 mmol/l) in several cases. Obviously, this patient was more sensitive to oxalate than to calcium concentration.
4 Discussion
Our data show that the formation of urinary COD crystals is predominantly associated with a high urinary calcium concentration, whereas formation of COM crystals is predominantly associated with a high oxalate concentration, thus supporting the concept of calcium-dependence of COD and of oxalate-dependence of COM. The present study confirms and extends our previous findings on the association of hypercalciuria with COD stones and crystals, and of hyperoxaluria with COM stones and crystals [17,26,27].
Concordant observations were reported by other groups with respect to both calcium dependence of COD and oxalate dependence of COM.
4.1 Calcium-dependence of COD
Conte et al. [12], examining the relationship between the type of calcium oxalate hydrate present in renal calculi and urinary biochemistry parameters, observed an association between hypercalciuria and COD calculi. Pierratos et al. [13] showed that 422 patients with pure COM stones had a lower urinary calcium excretion (4.2 mmol/day) compared to 68 patients with pure COD stones (7.2 mmol/day). Asplin et al. [14], examining metabolic correlates of CaOx dihydrate in renal stones, reported that patients with COD in their stones had higher urinary calcium excretion than those without.
In vitro, Costa-Bauza et al. [28] analyzed various urinary conditions affecting the regrowth of COD stone residual fragments from patients treated by ESWL. Marked hypercalciuria (6.25 mmol/l) associated with a urine pH of 6.5 was associated with the formation of COD crystals and regrowth of residual stone fragments, whereas in the presence of normocalciuria (3.75 mmol/l) and relatively acidic urine (pH 5.5) only some COM crystals were detected. Thongboonkerd et al. [29] analyzed the influence of different concentrations of calcium and oxalate ions on the type of CaOx crystals formed. In the presence of 0.5–1 mmol/l CaCl2 (a low calcium concentration) and 0.5–1 mmol/l NaOx (a high oxalate concentration), typical monoclinic prismatic COM crystals formed. In contrast, in the presence of 5 mmol/l CaCl2 (a high calcium concentration) and 0.5 mmol/l NaOx (a moderately elevated oxalate concentration), COD crystals preferentially appeared.
Taken together, all published studies conclude to the calcium-dependence of COD stones and crystals.
Of note, a marked dependence on hypercalciuria (together with a urinary pH slightly over 6) has also been observed for stones composed of brushite, at variance with other calcium phosphates types, which rather depend on elevated urinary pH and phosphate excretion [30,31]. High urinary calcium excretion and pH around 6 are also found in stone-forming patients with primary hyperthyroidism [32], who exhibit a disproportionate high prevalence of brushite stones [33].
4.2 Oxalate-dependence of COM
Oxalate-dependence of COM crystal formation was shown in two of the above-mentioned studies [13,29] but is not specifically mentioned in the majority of published papers dealing with spontaneous crystalluria in stone former patients. Indeed, most authors usually refer to CaOx in crystals or stones as a single entity, without mentioning the type of hydrate form. However, our study unequivocally shows that COM crystals are associated with a high oxalate concentration facing a normal or low-normal calcium concentration and that hyperoxaluria electively favors the precipitation of COM crystals.
Primary hyperoxalurias (PH) represent the extreme of heavy hyperoxaluria, and are associated with the presence of abundant crystalluria mainly composed of COM crystals and with the formation of calculi totally or nearly totally made of COM [34–36]. Indeed, this pathognomonic composition related to hyperoxaluria was confirmed in our experience in a total of 124 patients affected with PH1, but more rarely in PH2 or PH3, two forms of less severe hyperoxaluria. COM was identified as the unique crystal phase both in 72 calculi found at presentation and in 24 stones passed while on treatment. COD crystals were associated with COM in a small proportion of the stones (7% in PH1), at variance with findings recently reported in a short series of 16 patients (10 PH1, 6 PH3) including presumably only naïve stones [37]. In our experience, such mixtures of COM and COD in stones were mainly found in PH2 and PH3, not in PH1 patients. Most calculi in our PH patients exhibited a peculiar morphology [35,38]. Their composition was identified as COM by FTIR and SEM showed exclusively COM crystals in most cases. In our series, stones with a partially resembling morphology and also mainly made of COM were found in patients with enteric hyperoxaluria due to inflammatory bowel diseases or following bariatric surgery, both conditions often associating heavy oxaluria and low calciuria [39].
4.3 Theoretical and clinical relevance of the distinction between COM and COD crystalluria
The calcium-dependence of COD and the oxalate-dependence of COM crystals reflect differences in the physico-chemical factors leading to the formation of these two types of CaOx crystals [6]. Besides its theoretical interest, the distinction between COM and COD in crystalluria studies has similar clinical relevance, as the distinction performed on stones themselves, in order to find the etiology of renal stone disease, especially when no stone is available for analysis [40,41].
A crystalluria showing predominantly COM crystals is indicative of a lithogenic process driven by a high oxalate concentration. Especially, the presence of abundant COM crystalluria (>200 COM crystals/mm3) is observed in the context of heavy hyperoxaluria and should prompt a search for primary hyperoxaluria [42]. Finding of COD crystals is of less specific diagnostic value, but consistently is associated with a high calcium concentration. However, the presence of COD crystals with a dodecahedral aspect (Fig. 10) is indicative of a high calcium concentration, usually in excess of 7 mmol/l, as observed in severe forms of idiopathic hypercalciuria [43]. Similarly, the presence of large crystals of COD (size >25 μm) with an octahedral aspect, as shown in Fig. 10c, may be clinically relevant because such crystals are indicative of both hyperoxaluria and hypercalciuria with a Ca/Ox ratio usually in the normal range, i.e. between 5 and 14.
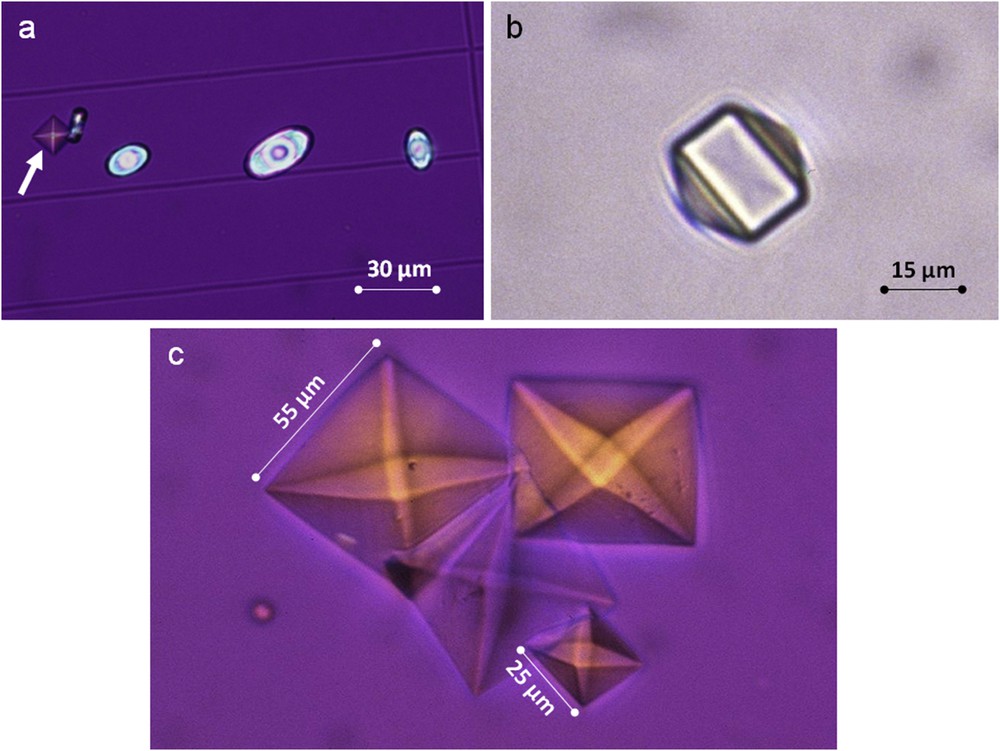
a) Mixed crystalluria of octahedral COD (white arrow) and oval COM crystals. b) Dodecahedral crystal of COD as observed commonly in the case of heavy hypercalciuria. c) Large octahedral crystals of COD highly suggestive for both hypercalciuria and hyperoxaluria.
In conclusion, this study demonstrates that the formation of urinary COD crystals is predominantly associated with a high urinary calcium concentration, whereas formation of COM crystals is predominantly associated with a high oxalate concentration. Increasing calcium concentration is associated with a higher prevalence of COD than of COM crystal formation, whereas increase in oxalate concentration is associated with a greater COM than COD crystal formation. Thus, a crystalluria mostly made of COM orients to a condition associated with hyperoxaluria, whereas predominance of COD crystals orients towards hypercalciuria.
Vous devez vous connecter pour continuer.
S'authentifier