

1 Introduction
In the past decade, significant progress has been made in the fields of membrane synthesis, transport, and separation principles. Zeolites have attracted great attention for industrial applications because of their remarkable properties [1]. Several reviews on zeolite membranes have focused on the synthesis and application of membranes for gas separation [2–4]. Zeolites exhibit uniform pore size, regular pore structure, and high chemical and thermal stability, which are all desired properties for membrane applications [5]. Since the synthesis of the first zeolite in 1948, several types of zeolites have been reported [6]. Mordenite framework inverted (MFI)-type zeolites are one of the most versatile frameworks, with applications in the highly selective separation of chemicals, such as hydrocarbons [7] and CO2 [8–10], as well as a number of catalytic processes [11–13]. The MFI structure contains two zeolites: silicalite-1 and ZSM-5. Silicalite-1 is a siliceous material, more hydrophobic and less acidic than ZSM-5. A variety of methods can be used for zeolite membrane synthesis, such as hydrothermal [14–16], secondary growth [17], and microwave methods [18]. The hydrothermal method is the most common technique because of its simplicity and straightforwardness [19]. The use of different chemical sources and crystallization conditions, including the alkalinity, temperature, aging time, organic structure–directing agents, and silica precursors [20], influences the formation of silicalite-1 crystals. In particular, the temperature and alkalinity influence the crystal growth and nucleation rate [21].
Different types of zeolites, including MFI [22], Linde Type A [23], and mordenite [24], have been used for gas separation applications. However, MFI membranes are the most popular due to the vast literature available on their preparation, their suitable pore size for industrial applications (0.55 nm), easy synthesis, possibility of chemical modification, and high thermal and chemical stability [25]. The adsorption properties of each gas affect their diffusion through MFI membranes. The flux through the membrane is also influenced by the operating temperature and pressure [21]. Asaeda and Yamasaki [26] synthesized a porous silica membrane and showed that the permeance and selectivity toward CO2 and CH4 decreased with increasing temperature in the range of 27–227 °C.
To optimize membrane processes, the effects of the operating parameters and morphological features, such as the temperature, pressure, kinetic diameter of the permeating species, and crystallization time, on the membrane performance have been widely reported [27,28]. Most studies on gas separation have been carried out by a one-factor-at-a-time approach, in which one single parameter is systematically varied, whereas the other factors are fixed. Such one-factor-at-a-time methods fail to consider the possible interactions between parameters [29]. Therefore, statistical design of experiment (DOE) and response surface methodology (RSM) approaches are much needed to evaluate the effect of operating variables and their potential synergy/antagonism on the membrane performance [30]. Furthermore, research reports related to the application of RSM for the optimization of nanostructured silicalite-1 membranes are rare.
In this study, nanostructured silicalite-1 membranes were synthesized on porous α-Al2O3 supports by a hydrothermal method. The effect of alkalinity and temperature on the membrane morphology was investigated. The permeability of CO2 and CH4 gases as a function of the operating temperature and pressure was determined. Furthermore, a quadratic model was proposed based on an RSM approach to study the effect of process variables on the permeation flux through the nanostructured silicalite-1 membranes.
2 Materials and methods
2.1 Membrane preparation
Nanostructured silicalite-1 membranes were synthesized on homemade porous α-Al2O3 supports by a hydrothermal method. The synthesis solution was prepared as follows: a certain amount of aluminum hydroxide (Al(OH)3, Merck) was dissolved in distilled water in a tightly covered polypropylene beaker and stirred for 15 min. Then, the appropriate amount of tetrapropylammonium hydroxide (TPAOH, 1.0 M, Sigma–Aldrich) was added and the solution stirred for 15 min. Tetraethyl orthosilicate (TEOS, >98%, Merck) was dissolved in distilled water and stirred for 15 min. This second solution was added dropwise to the first one under vigorous stirring. The molar composition of the final solution was 1.0TPAOH:3.24TEOS:0.03Al(OH)3:400H2O. The final mixture was then stirred for 1.5 h until it became transparent. A disk support (α-Al2O3) was placed inside a Teflon-lined stainless-steel autoclave completely filled with the synthesis solution. The hydrothermal process was carried out in an oven for 12 h. The recovered membranes were washed with distilled water several times and dried at room temperature (25 °C) for 24 h. The dried membranes were calcined at 450 °C for 8 h. The calcination process was carried out at a rate of 0.5 °C min−1 and cooled to room temperature at a rate of 1 °C min−1. The samples (S1–S9) were synthesized according to Table 1.
Different temperatures and pH levels for membrane preparation.
| Membrane no. | Synthesis temperature (°C) | pH |
| S1 | 160 | 11 |
| S2 | 170 | 11 |
| S3 | 180 | 11 |
| S4 | 160 | 9 |
| S5 | 170 | 9 |
| S6 | 180 | 9 |
| S7 | 160 | 13 |
| S8 | 170 | 13 |
| S9 | 180 | 13 |
2.2 Setup
In general, two methods are frequently used for permeation measurements through zeolite membranes: the pressure drop (PD) and concentration gradient (CG) methods. In the first method, a pressure gradient is applied to both sides of the membrane, whereas in the CG method a CG is the driving force resulting from a sweep gas flow at the permeate side. Researchers have described the effect of such a sweep gas on the feed permeability [31]. The PD method is simple, rapid for single gas permeation measurements, and more suitable for industrial operation. Furthermore, the PD method is capable of detecting viscous flow effects in the case of large defects in the membrane structure [32]. Therefore, the PD method was selected for this study. Fig. 1 shows the experimental setup. To control the operating temperature, the module was placed in an oven. In all the experiments, the feed pressure was fixed and the permeate side was vacuumed before each test. No sweep gas was used. CO2 and CH4 gases with purity of 99.99% were supplied by Technical Gas Services. The permeate gases were collected in a fixed volume vessel and the pressure changes in the vessel were monitored during the tests. The permeability of the gas was calculated by the following equation:
| (1) |
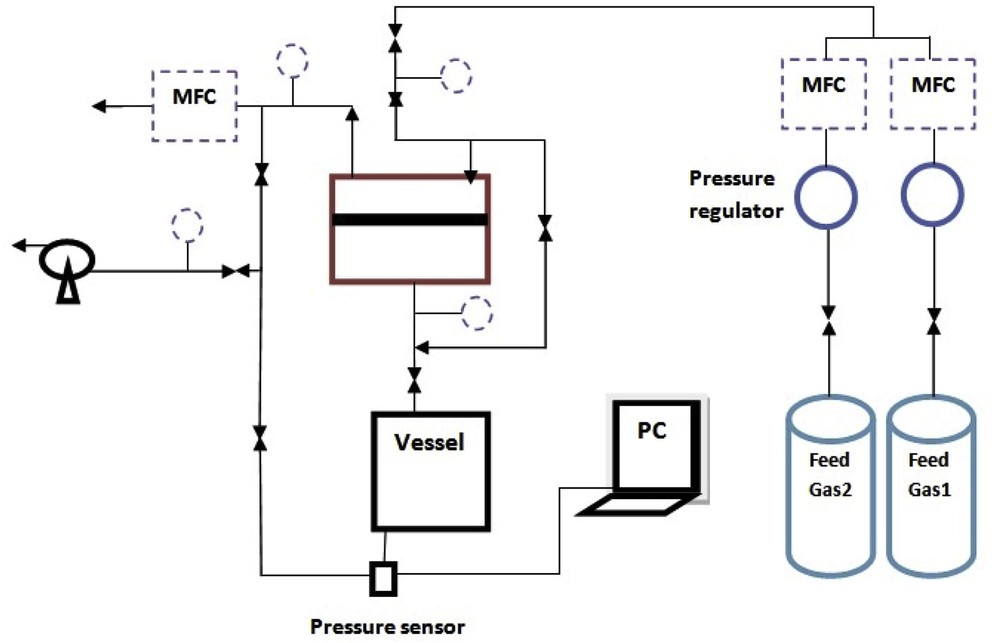
Schematic view of the experimental setup.
2.3 Membrane characterization
The X-ray diffraction (XRD) patterns of zeolite and molecular sieve structures are well documented in the literature. XRD analysis was carried out using a D8 Advance Bruker AXS X-ray diffractometer with Ni-filtered Cu Kα radiation (λ = 0.15418 nm). The XRD profiles were recorded in the 2θ range of 4–50° at 40 kV. Scanning electron microscopy (SEM; XL30, Philips, 30 kV) was used to characterize the shape of the crystals on the support and the surface morphology and thickness of the membrane layer.
2.4 Experimental conditions
The permeance of CO2 and CH4 through the optimized nanostructured silicalite-1 membrane was measured at four different feed pressures (0.5, 1, 1.5, and 2 bar) and four operating temperatures (30, 50, 70, and 90 °C).
2.5 Design of experiment
On the basis of the DOE method, all variables were varied simultaneously. To analyze the DOE response, RSM was used as a statistical technique to determine the regression model by means of the experimental data [29]. In this study, the DOE method was used to study the effect of the important variables on the permeation flux through the nanostructured silicalite-1 membrane. A standard RSM design, also known as the Box–Behnken design (BBD), was applied. The BBD with a quadratic model was used to study the effect of three independent variables: the kinetic diameter of the gas molecules (X1), the operating temperature (X2), and the feed pressure (X3). Each independent variable included three levels: −1, 0, and +1. The range of variables (with the coded and actual values) is shown in Table 2. An analysis of variance (ANOVA) was used to determine the accuracy and general suitability of the quadratic regression model.
Factors and levels in the BBD.
| Variable | Factor code | Unit | Level and range (coded) | ||
| −1 | 0 | +1 | |||
| Kinetic diameter | A | °A | 3.30 | 3.55 | 3.80 |
| Temperature | B | °C | 30.00 | 50.00 | 70.00 |
| Feed pressure | C | bar | 1.00 | 1.50 | 2.00 |
3 Results and discussion
3.1 Membrane preparation: experimental results
3.1.1 Effect of the crystallization temperature
Fig. 2 shows the XRD patterns of the nanostructured silicalite-1 membranes synthesized at different temperatures and pH = 11 (S1, S2, and S3 samples). All XRD patterns are consistent with the XRD reference pattern for the silicalite-1 zeolite [33,34]. The relative crystallinity was determined as the ratio of the large peak area at 2θ = 25–28° as compared to that of the S4 sample. S1 presents the highest crystallinity (86%) as compared to S2 and S3 (62% and 40%, respectively). The crystallite size of silicalite-1 was calculated from Scherrer's equation using the width of the peak at 2θ = 8° [33], obtained as 34 nm for S1.
XRD patterns of the nanostructured silicalite-1 membranes synthesized at pH = 11 and (a) 160 °C, (b) 170 °C, and (c) 180 °C.
As shown in Fig. 3(a–c), silicalite-1 crystals were successfully formed at all three temperatures and the particle size increased with the increasing temperature. This phenomenon can be explained by the high activation energy for crystal growth as compared to that for nucleation [34], leading to higher crystal growth rates than nucleation rates with the increasing temperature. Therefore, high temperatures result in large silicalite-1 crystals.

SEM images of the nanostructured silicalite-1 membranes synthesized at pH = 11 and (a) 160 °C, (b) 170 °C, and (c) 180 °C and those of the membranes synthesized at T = 160 °C and (d) pH = 9 and (e) pH = 13.
3.1.2 Effect of alkalinity
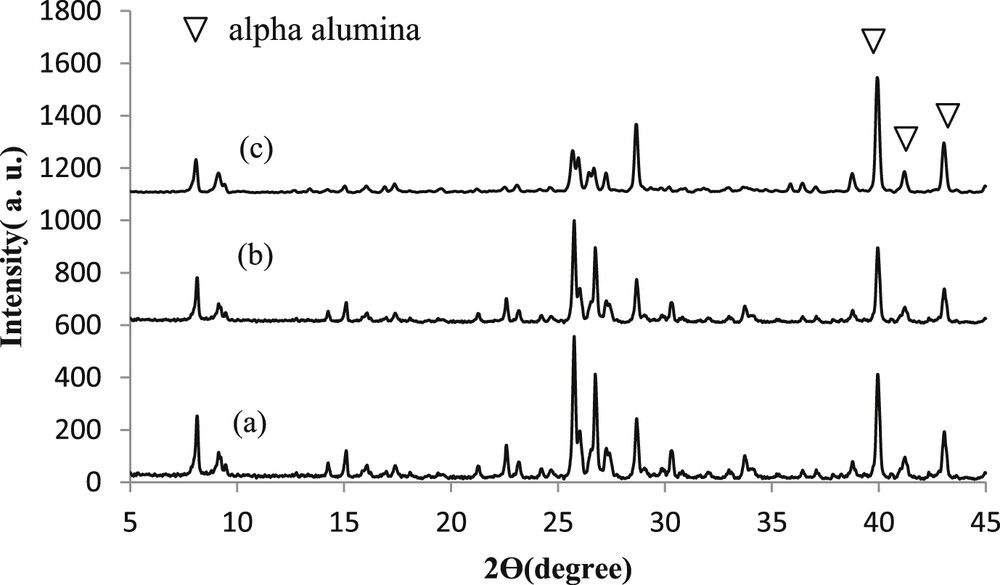
The OH− ions in zeolites operate as a complexing agent to transport silicate species between the amorphous and crystalline phases. The alkalinity is one of the most influencing parameters on the nucleation, growth, crystal size, and morphology of silicalite-1 membranes [21]. High hydroxide concentrations in the synthesis solution favor short nucleation times and small crystal sizes. However, most silica species remain unreacted during synthesis processes at very high alkalinity values. Therefore, it is necessary to determine the optimum alkalinity for the preparation of high-quality silicalite-1 membranes. The SEM images in Fig. 3 (a, d, and e) clearly show how the hydroxide concentration in the synthesis solution influences the formation of nanostructured silicalite-1 crystals. Further increases in alkalinity (pH > 9) result in the nonuniform distribution of crystal shapes (pill- and octagonal-shaped crystals) owing to the low rate of silicalite-1 crystal growth at high pH values. It has been reported that hydrolysis of AleOeSi bonds at low pH is faster than hydrolysis of SieOeSi bonds at high pH [35]. This means that increasing the alkalinity enhances the conversion of the amorphous phase into the pollucite phase [36]. Furthermore, the XRD patterns in Fig. 4 reveal that the crystallinity of the samples decreases at high solution alkalinity values (pH = 13). The crystallinity values of the S4, S1, and S7 samples were 100%, 86%, and 9%, respectively. This phenomenon can be explained by the higher solubility of crystals at higher alkalinity values. Consequently, S1 was selected as the optimized sample for the measurement of the CO2 and CH4 permeance and selectivity.

XRD patterns of the nanostructured silicalite-1 membranes synthesized at T = 160 °C and (a) pH = 9, (b) pH = 11, and (c) pH = 13.
3.2 Gas flux: experimental results
Figs. 5 and 6 show the CO2 and CH4 fluxes as a function of the feed pressure at different temperatures. According to the Langmuir isotherm, single gas fluxes (J) through MFI membranes can be described as follows [37]:
| (2) |
| (3) |

Effect of the feed pressure and temperature on the CO2 flux at different temperatures.
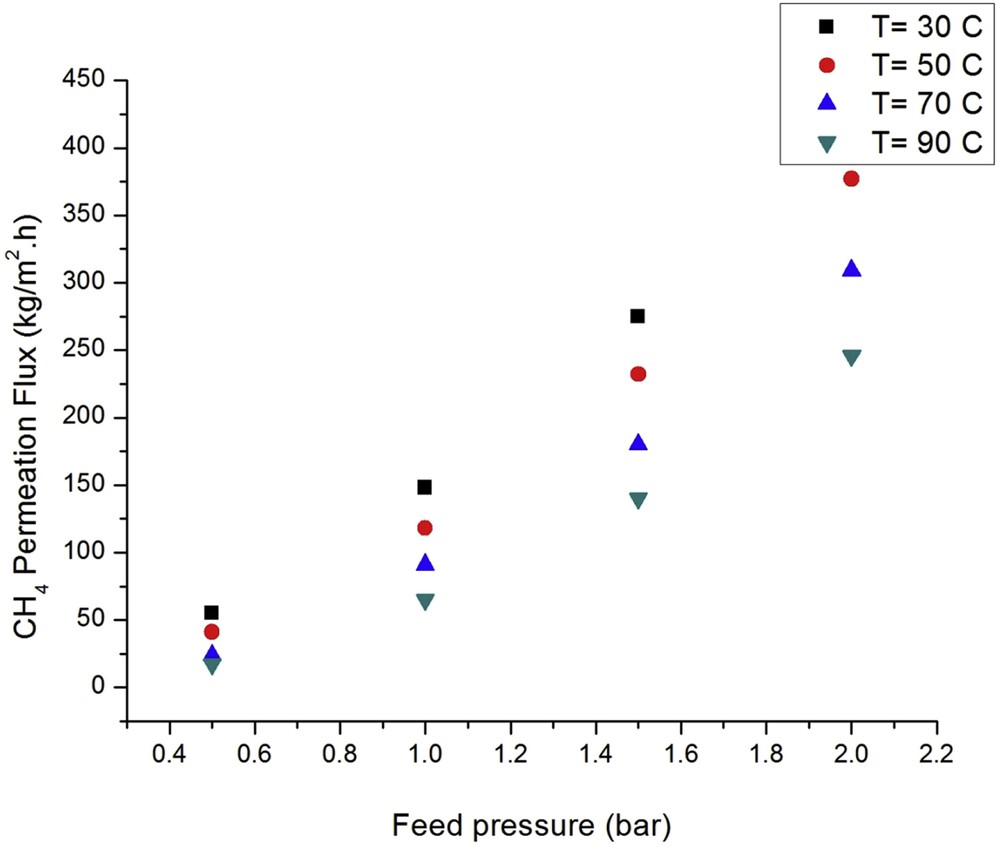
Effect of the feed pressure and temperature on the CH4 flux at different temperatures.
Assuming general thermal activation for both and K (Eqs. (4) and (5)) and after substitution in Eqs. (3) and (6) is obtained:
| (4) |
| (5) |
| (6) |
The CO2 and CH4 fluxes are a linear function of the feed pressure (as per Eq. (6)), confirming the Henry sorption regime. The linear function reveals that Knudsen diffusion is the controlling mechanism. Furthermore, the lack of Poiseuille flow confirms the absence of cracks in the membrane. On the other hand, the CO2 coverage and its adsorption increase by increasing the feed pressure, leading to higher permeation values [38].
The flux through the nanostructured silicalite-1 membrane was high and the highest CO2 flux observed was 320 kg m−2 h−1 at 30 °C, 2 bar, and PD of 1 bar. This can be compared with the highest previously reported CO2 flux, which, to the best of our knowledge, is 200 kg m−2 h−1 [39] for a silicalite-1 membrane at 27 °C. CO2 fluxes of 250 and 200 kg m−2 h−1 have also been reported for NaZSM-5 and BaZSM-5 membranes, respectively. These differences can be attributed to the small thickness (around 0.7 μm) of the nanostructured silicalite-1 membrane in this study. Therefore, a much higher flux is observed for the nanostructured silicalite-1 membrane than for NaZSM-5 and BaZSM-5 membranes.
Fig. 6 shows that the methane flux is larger at higher feed pressures at all the tested temperatures. The highest observed methane flux values are 450, 300, 220, and 120 kg m−2 h−1 at 30, 50, 70, and 90 °C, respectively. The highest and lowest methane fluxes were obtained at 30 and 90 °C at all the different feed pressures, respectively. In general, the CO2 flux is lower than the CH4 flux owing to competitive adsorption and the higher fractional surface coverage of methane. These phenomena can be attributed to the Henry constants for methane and carbon dioxide over silicalite-1, which are ∼3.9 mol kg−1 atm−1 for CO2 and 2.8 mol kg−1 atm−1 for CH4, both at 32 °C [40].
The effect of the feed pressure on the CO2 and CH4 permeation through the nanostructured silicalite-1 membrane at different temperatures is shown in Figs. 7 and 8. It is clear that the permeation of CO2 and CH4 decays at high temperatures as a result of the isosteric sorption heat being larger than the activation energy. This is also inferred from Eq. (6), if the isosteric sorption (Qst) is greater than the activation energy (Em), the permeability declines with the temperature and vice versa. The isosteric sorption heat and activation energy for CO2 and CH4 are presented in Table 3 [41,42]. Therefore, it is concluded that the main gas diffusion mechanism for CO2 and CH4 diffusion through the nanostructured silicalite-1 membrane is adsorption. Generally, the permeability of single gases through zeolite membranes varies with the temperature [43]. At low temperatures, the permeability increases with the increasing temperature due to the enhanced mobility of the molecules, whereas the amount of adsorbed gas decreases up to a given temperature. As the temperature increases further, the permeability drops because the adsorption is reduced at high temperatures. At even higher temperatures, adsorption phenomena are negligible, leading to a minimum point [44]. The maximum and minimum permeability values for CO2 and CH4 have been reported to occur at 25 and −23 °C and at 377 and 202 °C, respectively [45].

Effect of the feed pressure and temperature on the CO2 permeability.
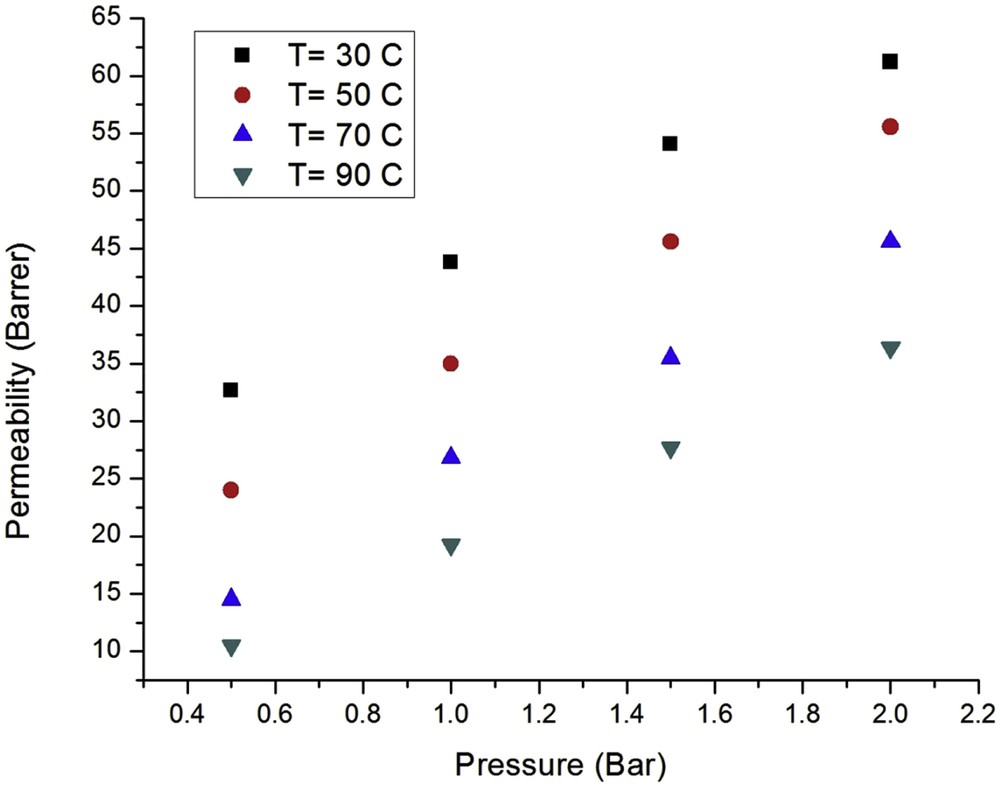
Effect of the feed pressure and temperature on the CH4 permeability.
Isosteric sorption heat and activation energy of CO2 and CH4 through nanostructure silicalite-1 membrane.
| Gas/temperature | Qst (kJ mol−1) | Em (kJ mol−1) | ||
| Ref. [42] | Ref. [43] | Ref. [42] | Ref. [43] | |
| CH4 | ||||
| 19 °C | 14.0 | |||
| 25 °C | 20.0 | |||
| 27 °C | 20.9 | |||
| 100 °C | 22.0 | |||
| CO2 | ||||
| 27 °C | 27.2 | |||
| 100 °C | 26.0 |
The CO2 and CH4 permeability at all temperatures increased with the increasing feed pressure from 0.5 to 2 bar. The observed CO2 permeability was greater than that for CH4 at all temperatures; hence, the CO2 adsorption limits the CH4 transport. The Henry constant values for the two gases are consistent with the above discussion.
3.3 Model results
3.3.1 Effect of operating variables on the permeation flux
Table 4 shows the ANOVA results for the permeation flux BBD. The quadratic model for the permeation flux in terms of the coded factors is presented in Eq. (7). A positive value indicates synergistic effects, whereas a negative value suggests antagonistic effects.
| Permeation flux (mmol m−2 s−1) = 188.2 − 47.9A − 34B + 83.3C + 20.5AB − 13.7AC − 5.5BC − 14.5A2 + 10.5B2 + 10.5C2 | (7) |
The results of ANOVA.
| Source | Sum of squares | df | Mean square | F Value | Prob > F |
| Model | 873.83 | 9.00 | 97.09 | 79.19 | <0.0001 |
| A | 183.84 | 1.00 | 183.84 | 149.95 | <0.0001 |
| B | 92.20 | 1.00 | 92.20 | 75.21 | 0.0003 |
| C | 555.27 | 1.00 | 555.27 | 452.93 | <0.0001 |
| AB | 16.72 | 1.00 | 16.72 | 13.64 | 0.01 |
| AC | 7.53 | 1.00 | 7.53 | 6.14 | 0.05 |
| BC | 1.21 | 1.00 | 1.21 | 0.98 | 0.36 |
| A2 | 7.71 | 1.00 | 7.71 | 6.29 | 0.05 |
| B2 | 4.04 | 1.00 | 4.04 | 3.30 | 0.12 |
| C2 | 4.06 | 1.00 | 4.06 | 3.31 | 0.12 |
| Residual | 6.12 | 5.00 | 1.22 | ||
| Lack of fit | 5.06 | 3.00 | 1.68 | 3.16 | 0.24 |
| Pure error | 1.06 | 2.00 | 0.53 | ||
| Cor. total | 879.96 | 14.00 |
On the basis of Table 4, the “Model F value” of 79.2 indicates that the model is significantly under the 95% level of confidence. A value of “Prob > F” smaller than 0.05 indicates that the model terms are significant. A, B, C, and AB were found to be significant in this model. Among all of the significant variables, the feed pressure showed the highest F value; therefore, it presents the most significant effect on the permeation flux. The “Lack of Fit F value” of 3.17 indicates that the lack of fit is not significant relative to the pure error. Therefore, the model for the permeation flux proposed in Eq. (7) is valid for the present study. A reliable model should predict the responses with acceptable accuracy. In this case, the correlation coefficient (R2) was 0.99, confirming the good correlation between the experimental and predicted results. The high value of the adjusted regression coefficient (Radj2 = 0.98) also indicates the high significance of the proposed model.
To investigate the interactions between variables and determine the optimum value of each variable, three-dimensional plots of the response surface graphs for the permeation flux were constructed, as shown in Fig. 9. The permeation flux increased with the kinetic diameter and with the decreasing temperature (Fig. 9(a)). Furthermore, CO2 (dk = 0.33 nm) exhibited a higher permeation flux owing to its smaller size as compared to CH4 (dk = 0.38 nm), which facilitates its transportation. On the other hand, it has been reported that the adsorptive strength toward silicalite-1 at room temperature follows the order: CO2 > CH4 [41]. Consequently, CO2 is a highly adsorbing gas and the surface flow component facilitates its passage through the nanostructured silicalite-1 membrane, especially at low temperatures. Fig. 9(b) shows how the permeation flux increases with the decreasing kinetic diameter and the increasing feed pressure. The increasing feed pressure acts as a permeation driving force, promoting the surface coverage by the gas. Therefore, the permeation flux through the membrane increases. The interaction between the feed pressure and temperature on the permeation flux is illustrated in Fig. 9(c). The maximum permeation flux was obtained at high feed pressures and low temperatures. In general, the permeation flux increases with the temperature at low temperatures resulting from the increased component mobility. However, concomitantly, the amount of adsorbed gas declines. As the temperature is further increased, the permeation flux declines owing to the fact that adsorption is reduced at such high temperatures. The results show a decreasing tendency in CO2 permeation at high temperatures. The permeation mechanism can be simply described as surface diffusion, as CO2 is adsorbed on the silicalite-1 zeolite [44].
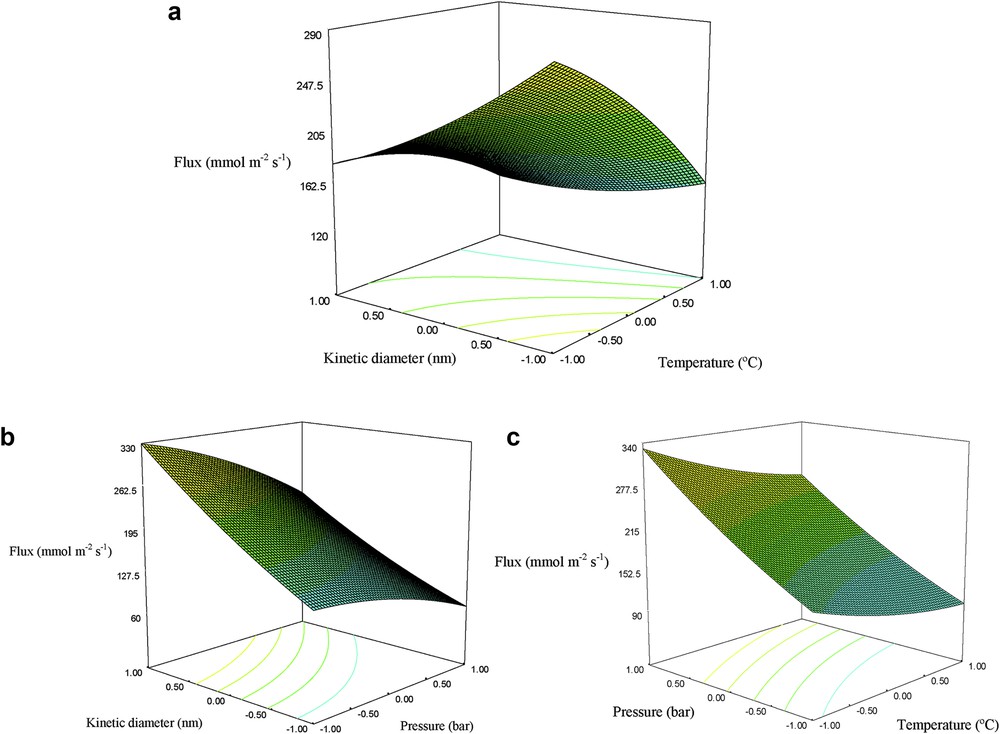
Effect of the (a) kinetic diameter and temperature at 1.5 bar, (b) kinetic diameter and feed pressure at 50 °C, and (c) temperature and feed pressure for 3.55 nm.
4 Conclusion
Nanostructured silicalite-1 membranes were synthesized on porous α-Al2O3 supports by a hydrothermal method. The effect of the synthesis temperature and alkalinity on the membrane morphology was investigated. It was found that both factors are important parameters controlling the crystallinity of the silicalite-1 layer and the crystal growth rate. The results have shown that the overall silicalite-1 membrane yield decreased with the increasing hydroxide content of the synthesis solution, whereby no silicalite-1 crystals were obtained at very high alkalinity (pH = 13). Therefore, the optimum conditions for the synthesis of nanostructured silicalite-1 membranes were 160 °C and pH = 11. Furthermore, the permeability of CO2 and CH4 was measured at different feed pressures and temperatures for the optimized membrane. The CO2 permeability was determined to be 1.62 × 10⁻⁷ mol m−2 s−1 Pa−1 at 30 °C. The permeability of both gases decreased with the increasing temperature, and the gas flux was found to increase linearly with the feed pressure.