


 CC-BY 4.0
1. Introduction
Among all the industrial chemical processes whose aim is to separate and recover elements from a complex mixture, Liquid–Liquid (L–L) extraction plays a key role because of its efficiency, cost-effectiveness and speed. This process commonly involves two immiscible liquid phases, which are put in contact with one another: one, the aqueous phase, is loaded with compounds to be extracted selectively, and the other, the organic phase, whose extraction power relies on the chemical affinity towards the targeted elements, thanks to the extracting molecules that it contains.
Because of the many independent variables that play a role in such complex L–L extraction processes, developing, implementing and understanding them requires comprehensive and time consuming phase diagram explorations, specifically when they are to be scaled up to an industrial scale [1]. Thermodynamic and kinetic data are particularly key to such understanding and process control. However, kinetic data are often difficult to extract because the core of extraction processes performed in mixer-settlers or pulsed columns [2] requires turbulent mixing of two non-miscible solvents, which: (i) preclude knowing the specific microscopic surface area of contact between the two phases, and (ii) preclude measuring the fast kinetic, as one has to wait for the decantation of the two phases prior to their analysis. It is important to stress here that macroscopic area of contact in the emulsified fluids is distinct from the microscopic area of contact of extracted species [3].
To tackle this challenge, microfluidics has been proposed as an innovative approach [4]. It is indeed a powerful tool, which allows to monitor both thermodynamics and kinetics of L–L extraction processes. Hence, depending on the microfluidic technology implemented, it can enable its user to precisely measure the macroscopic surface area of the contact interface between the water phase and the solvent phase [5]. Microfluidics, once integrated with on-line characterization methods, has also other advantages such as its speed enabling for fast process development and low consumption of reagents [6, 7, 8, 9]. The fact that a microfluidic platform occupies a small amount of lab-space for such a comprehensive process is another key asset, hence the “Lab On a Chip” (LOC) denomination that they have received [10, 11]. During the development of microfluidics, researchers embedded several characterization techniques within their miniaturized platform such as infrared spectroscopy measurements [12, 13], biological mass spectrometry [14], and X-ray fluorescence (XRF) [15]. However, throughout the work presented here, we emphasize the importance of careful monitoring of both thermodynamics and kinetics. This specific point is illustrated by carrying out a selective L–L extraction of both Ytterbium and Iron, using a synergic extracting system known to show good selectivity for Rare Earth Elements (REE), which means that REE are extracted in preference to iron [15]. Hence, to what extent is this selectivity driven in this extraction system? Is there any balance between thermodynamics and kinetics? If not, how do these two affect the overall selectivity?
2. Materials and methods
2.1. Chemicals
Ytterbium(III) nitrate pentahydrate Yb(NO3)3⋅5H2O (purity 99.99%), Iron(III) nitrate nonahydrate Fe(NO3)3⋅9H2O (purity 98%) and Nitric acid 70% were purchased from Sigma Aldrich. Bis(2-Ethylhexyl) phosphate, 95% (HDEHP) was purchased from Alfa Aesar, and N, N′-Dimethyl, N, N′-dioctylhexylethoxymalonamide (DMDOHEMA) (purity up to 100%) was purchased from Technocomm Ltd UK. Isane® IP175 was provided by Total.
2.2. Preparation of the initial solutions to be extracted
On the one hand, initial aqueous solutions were prepared by dissolving calculated and weighted amounts of Yb(NO3)3⋅5H2O and Fe(NO3)3⋅9H2O salts in a 0.3 mol/L nitric acid solution in order to reach the targeted concentration. On the other hand, organic solutions were prepared by diluting calculated and weighted amounts of the two extractants, HDEHP and DMDOHEMA, in Isane® at the targeted concentrations. It should be noted that these concentrations were made in the following proportion: 75 wt% HDEHP and 25 wt% DMDOHEMA.
2.3. Batch extractions
Due to the difficulty of dissolving directly metallic salts into the organic solvent, one concentrated mother solution for each ion was prepared via macroscale batch extractions. Toward that end, equal volumes of an aqueous solution A concentrated at 18 mM of Yb3+ and an organic solution loaded with the extractants were prepared. The second batch extraction involved an aqueous solution B concentrated at 94 mM of Fe3+ and the latter organic solution. L–L extractions were carried out by placing both solutions (solution A + organic solution; solution B + organic solution) in test tubes placed on an orbital shaker for 24 hours at 200 rpm. To separate the two phases from one another, a Dynamica Velocity 14 Centrifuge apparatus was used by centrifuging the mixtures at 6640 g for 20 min. The two organic solutions obtained after extraction of solution A and solution B were used to prepare the initial organic solution for the reverse extraction (concentrated at 11 mM of Yb3+ and Fe3+, see Table 1).
2.4. Apparatus and accessories
The microfluidic platform, shown in Figure 1, has been previously described in detail [15]. Therefore, we emphasize here the improvements made to the platform since that paper. The platform is fully integrated and automatized, so can efficiently and quickly perform an L–L extraction through a microfluidic extraction chip, followed by a dual on-line XRF analysis of both phases, in a second dedicated chip. This analysis can be performed using a homemade XRF system made from the assembly of a static miniature X-ray tube equipped with a XRF small detector and a translational moving stage holding the L–L extraction microfluidic chip, two valves and the XRF chip.
3D view of the fully automatized microfluidic platform. Syringes held by their respective syringe pumps are located behind the platform, in the background. In the forefront, from right to left: motorised stage holding microfluidic extraction chip and two valves, X-ray tube placed inside its 3D-printed tube holder, XRF Detector held by a 3D-printed arch screwed to the tube holder, XRF microfluidic chip with two sets of two Polyimide tubes. A circular tin plate serving as beamstop is located beneath the XRF chip.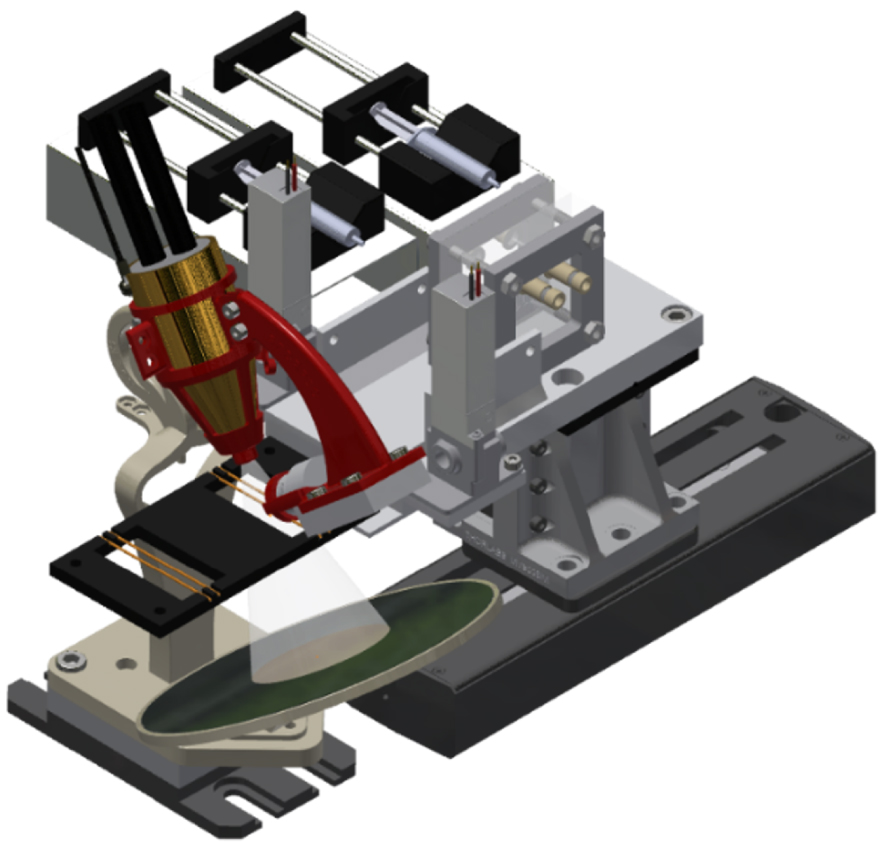
Experimental parameters for both extraction and R-extraction
| D-extraction | R-extraction | |
|---|---|---|
| Aqueous phase | 11 mM Yb3+ | 0.3 mol/L HNO3 |
| 11 mM Fe3+ | ||
| 0.3 mol/L HNO3 | ||
| Organic phase | Isane® with 75 wt% HDEHP 25 wt% DMDOHEMA | 11 mM Yb3+
11 mM Fe3+ Isane® with 75 wt% HDEHP 25 wt% DMDOHEMA |
| Flowrates/contact times | 1.0, 5.0, 10.0 and 20.0 μL⋅min−1/34, 6.8, 3.4 and 1.7 min | |
| Temperature | 20.0, 25.0, 30.0 and 35.0 °C | |
2.4.1. Microfluidic chips
2.4.1.1. Microfluidic extraction chip
The liquid–liquid extraction device used was composed of two fused silica (jgs2 grade) blocks, shown in Figure 2(a) and (b), each of them being etched with a mirrored channel 17 cm long, 1 mm wide and 0.2 mm deep (total volume worth of 34 μL). The two blocks sandwiched a 30 μm thick hydrophobic Polytetrafluoroethylene (PTFE) membrane (0.02 μm pore size), which allowed: (i) to keep the two liquids separate from each other, therefore greatly facilitating the downstream XRF analysis of the two liquids, but also (ii) to know and control the surface area where the extraction is taking place [5]. Finally, the glass blocks were bonded together with a silicon seal purchased from RS Components and further maintained under constant pressure using a customized stainless-steel armature (see Figure 2). The latter enabled the application of pressure on the two glass blocks without risking any mechanical failure. Overall, this system showed excellent fluid tightness and easiness in replacing the membrane between two sets of experiments. The armature as well as the etched glass blocks were manufactured on demand by the Singaporean company SCENG Robotics Pte Ltd.
Connectivity of the glass to flexible tubing was achieved using Polyether Ether Ketone (PEEK) fittings purchased from Elveflow. They were glued with the light-activated Katiobond 4594 epoxy glue on each vertical liquid inlet and outlet via of the glass blocks.
(a) Picture of the microfluidic extraction glass chip. (b) Exploded view of the microfluidic extraction glass chip. (c) Picture of the XRF chip with Polyimide tubes.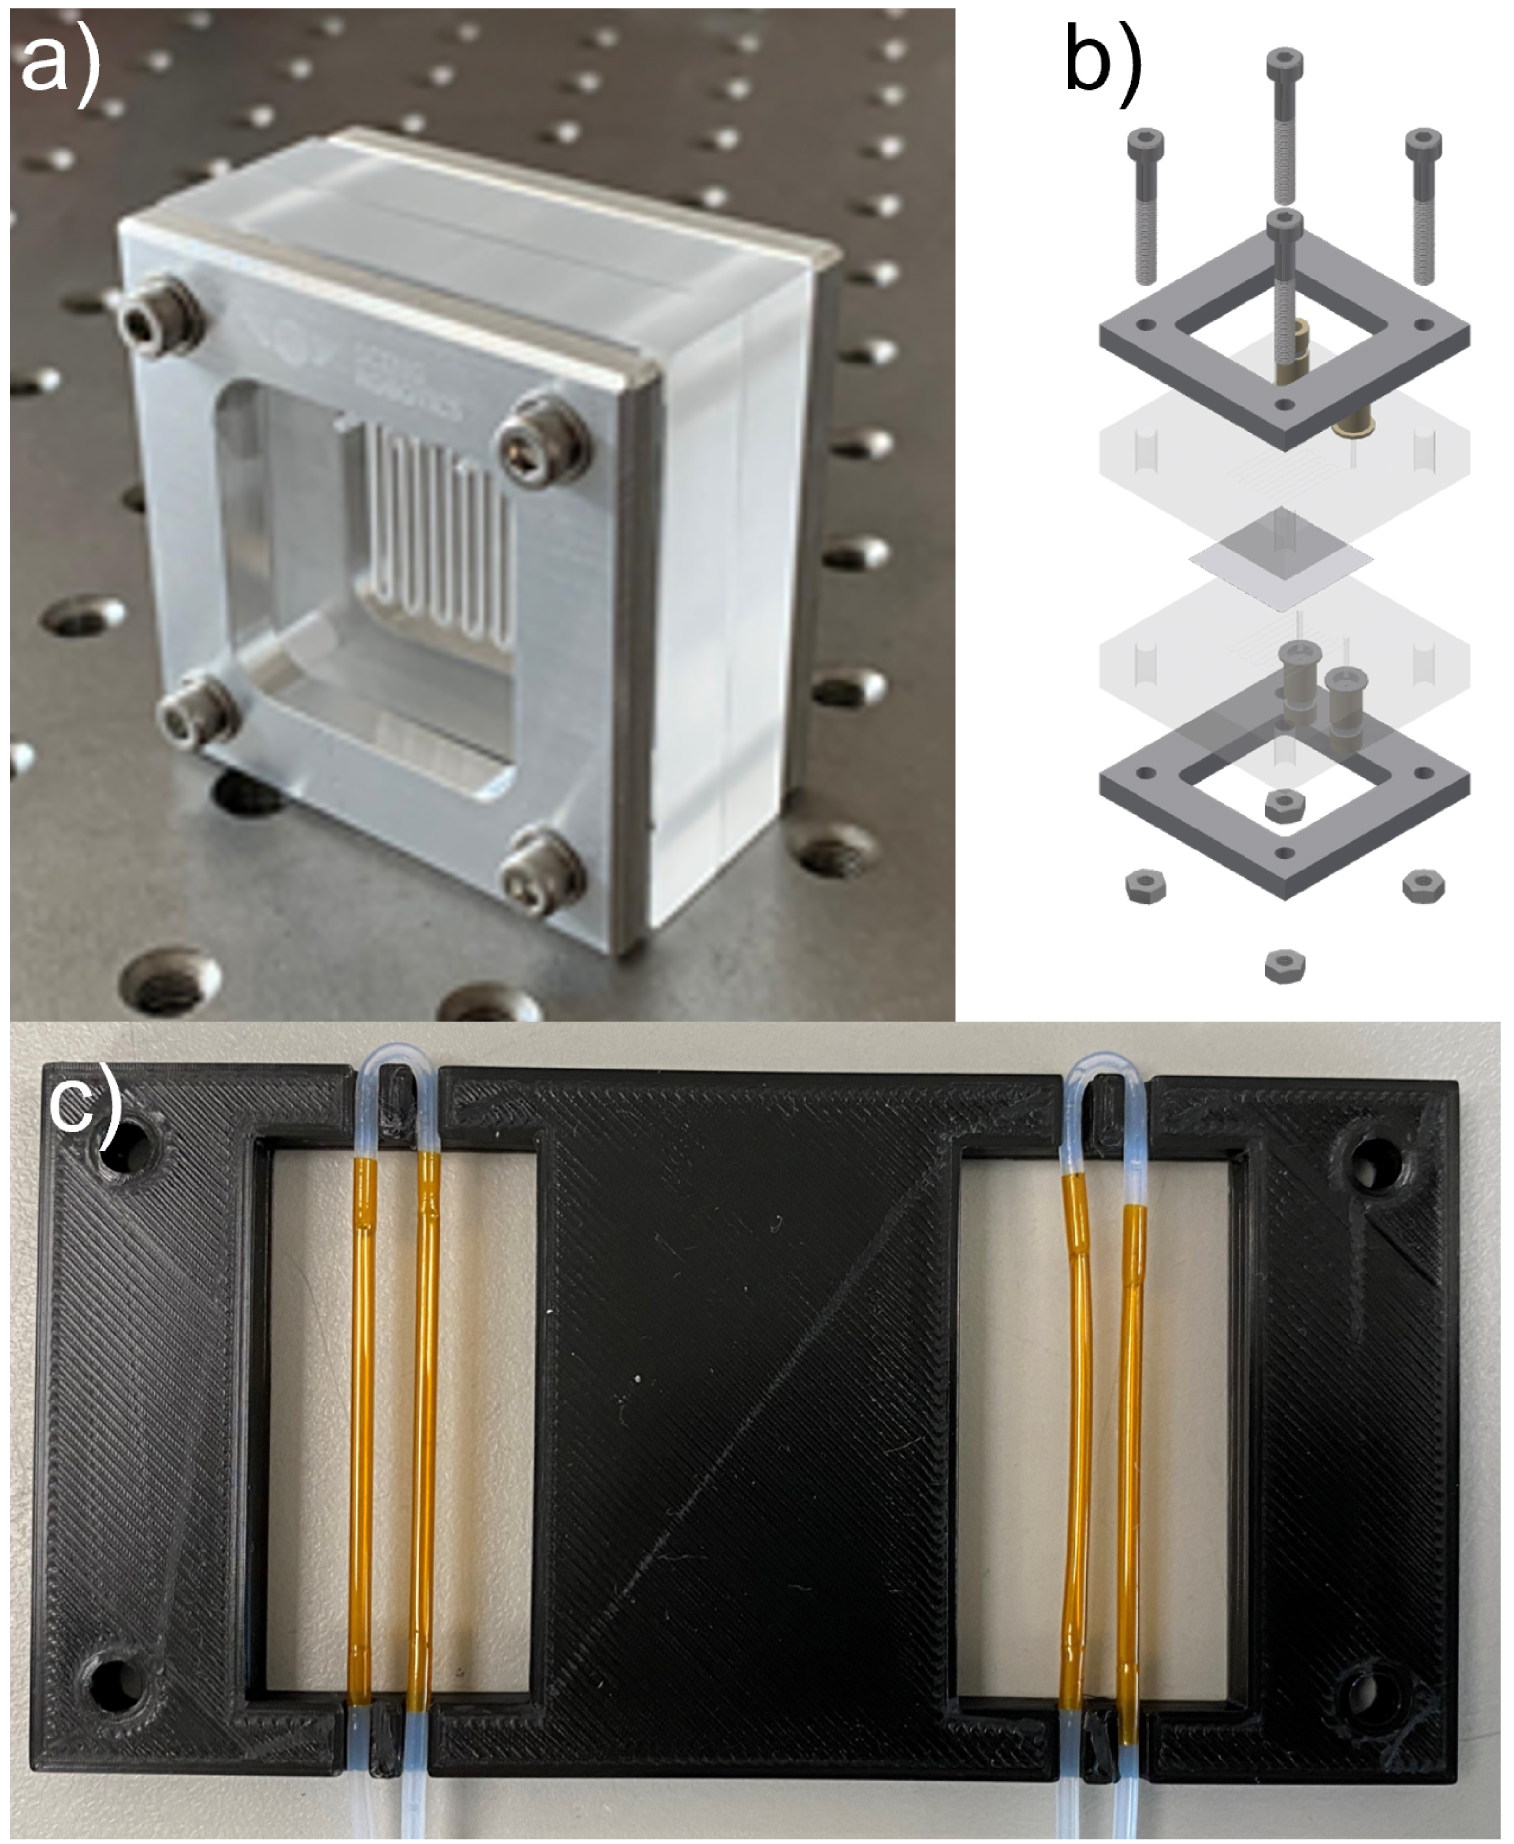
2.4.1.2. Microfluidic XRF chip
The XRF chip was used for the online downstream analysis and had two separate liquid channels enabling a dual measurement of both aqueous and organic channels, by use of a motorized stage, which was controlled to position the appropriate liquid channel under the X-ray beam.
As showed in Figure 2(c), the XRF chip comprised two sampling zones, each one made of two parallel sections of polyimide tubes (1.52 mm ID; 38 μm thickness) provided by Zeus Industrial Products, Inc. connected by PEEK tubes. Eventually, a 3D-printed frame holds the two sets of tubing.
2.4.2. X-ray fluorescence spectrometer
The XRF spectrometer’s hardware was composed of an X-ray source, an X-ray detector, and the assembly infrastructure. The X-ray tube was a Magnum 50 kV from Moxtek with a Silver anode. The X-ray detector was an X-123 SDD X-ray spectrometer from Amptek. The acquisition conditions were optimised to obtain the highest signal to noise ratio when measuring Ytterbium and Iron: 25 kV at 150 μA for the X-ray generator, an integration time of 120 s and a combination of two 50 μm-thick filters, one made of titanium and the second of tin. Figure 3(a) shows an XRF spectrum of Fe and Yb obtained with these parameters using the XRF chip.
(a) XRF spectrum obtained with a liquid sample of Yb and Fe injected through the XRF chip. (b) XRF analysis system with the X-ray tube inserted inside its 3D-printed polycarbonate tube holder, XRF detector, metallic filters and XRF chip.
Both X-ray tube and detector were placed on a 3D-printed holder (see Figure 3(b)), specifically printed in Polycarbonate (PC) because of the high heat-resistance of the material, which avoids any deformation of the holder when the tube is set at high power and thus releasing a large amount of heat.
Both calibration procedure and data treatment have been described by El Mangaar et al. [16] and Maurice et al. [15]. Quantities needed by the delicate calibration procedure in the new geometry adopted for this work are recalled in the Supplementary information.
2.4.3. Overall apparatus and microfluidic accessories
The entire platform was located within a Memmert, IPP 750 Plus temperature-controlled incubator, custom made with via holes, accurate to ±0.1 °C. It also serves as a safe X-ray enclosure to enable its usage as per the required license provided by local authorities. Indeed, the chamber was wrapped with a 0.5 mm thick lead sheet, and all via holes were designed and shielded to fully protect users from ionizing radiations. A 5 mm circular tin plate stops most of the X-ray beam after it has gone through the XRF chip. The microfluidic tubing used to link the different parts were made of PEEK with an Internal Diameter (ID) of 0.45 mm. For liquid injection, syringe pumps were used (NE-4000 World Precision Instruments) with Hamilton 5 mL Gastight Syringes (Model 1005). The connections were made with Polyether Ether Ketone (PEEK) fittings manufactured by Fluigent. The liquid valves were base mounted with 3-ports (2-way SMC LVM105R). To measure both phases and move the system, a Thorlabs motorized stage was used (DDSM100/M). All customized 3D parts were printed using an Ultimaker 3 Extended printer. The entire apparatus was computer controlled using homemade software programmed in Python 3+.
2.5. Microfluidic L–L extraction
Overall, a total of eight L–L extraction experiments, four direct extractions (D-extraction) and four reverse extractions (R-extraction), were performed within a set of four temperatures ranging from 20 °C to 35 °C. For each L–L extraction, four contact times, i.e. flowrates, were studied with a constant 1:1 volume ratio between the aqueous and organic phases. These contact times allow ions to diffuse within the length of 0.2 mm, which corresponds to the optimized depth of the channels [5]. Indeed, the penetration depth 𝛿l is given as below [17], in unsteady state conditions (see (1)):
| (1) |
Table 1 summarizes the implemented experimental parameters.
Schematic of the microfluidic circuit.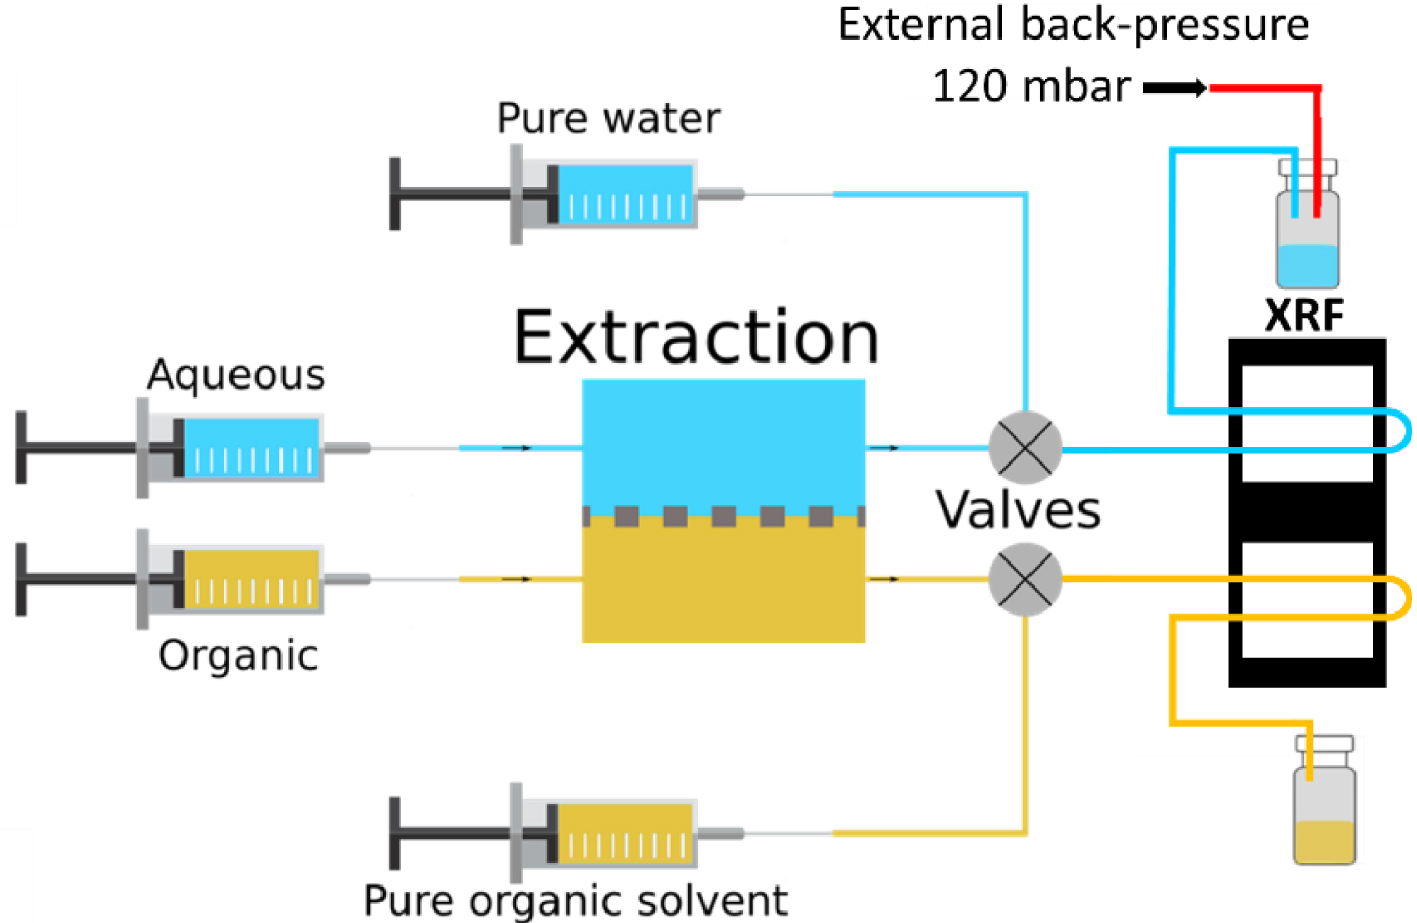
A typical measurement, at a given temperature and for four different contact times (see Table 1) took less than 18 hours and the overall process accounted for less than 30 mL of total liquid waste. For each temperature, any change of contact time/flowrate was followed by a purge of Ethanol and Isane® respectively for the aqueous side and the organic side at 100 μL/min for 15 minutes in the XRF chip only. A back-pressure of 120 mbar was applied on the aqueous channel in order to prevent any leakage of organic solvent to the aqueous side. Indeed, the PTFE membrane inside the extraction chip was saturated with Isane® and the difference in viscosity of the two phases, as well as the pressure drop induced by the tubing, could result in some organic leakage. No such issue can happen from the aqueous channel to the organic one because of the hydrophobicity of the PTFE membrane. The fluid flows are schematized in Figure 4.
3. Results and discussion
3.1. Platform improvements
In previous reports, our microfluidic extraction chips were made out of Poly(methyl methacrylate) (PMMA) [15, 16]. To improve chemical compatibility and enhance both the pH operating window and the range of organic solvent that could be used, we upgraded our platform and moved to glass as the material of choice for our microfluidic parts. As per design, glass shows a very high resistance towards acids (2 M HCl, pH = −0.3 and 5 M HNO3, pH = −0.7 have been tested), as well as a high stability versus all organic solvents.
The new XRF chip configuration described here also allowed for stronger fluorescence due to an increased volume of solution exposed to the X-ray beam. However, this increased volume and signal came with an increased experiment duration, especially at low flow rates since it takes more time to fill the chip with the solution to be studied.
3.2. Mother organic liquor preparation by batch L–L extraction
As described in Section 2.3, two separate batch L–L extractions were performed at room temperature (23 °C) to give us access to high concentration starting solutions, one for each ion. This operation gives us the opportunity to get an equilibrium point for each of the two studied species taken separately, especially regarding the extraction efficiency of the organic system towards Fe3+.
Data presented in Table 2 show that the extraction ratios of Yb3+ or Fe3+ are nearly 100%. In other words, at thermodynamic equilibrium, these two ionic species, when extracted separately, are fully extracted by the system 75 wt% HDEHP/25 wt% DMDOHEMA in Isane®. These experimental parameters were chosen, in order to illustrate the purpose of this article, ca. the fluctuation of the selectivity as a function of the extraction duration and temperature and the associated risk of misinterpretation of a slow extraction. Choice was made on the basis of the ones used and implemented by El Maangar et al. [14], in a more complex but related mixture in order to avoid, if possible, full extraction of the rare earth elements, and hence to allow measurement of a finite value for Free Gibbs energy of extraction 𝛥Gext(M) (M = Yb3+ or Fe3+).
Batch L–L extraction of single element aqueous solutions at 20 °C. The concentrations were measured by Inductively Coupled Plasma-Optical Emission Spectroscopy (ICP-OES)
| Solution (Element) | Aqueous phase before extraction | Organic phase after extraction∗ | Extraction ratio (%) |
|---|---|---|---|
| Solution A (Yb) | 17.60 ± 0.07 mM | 17.50 ± 0.07 mM | 99.43 ± 0.81 |
| Solution B (Fe) | 93.79 ± 0.22 mM | 93.57 ± 0.24 mM | 99.77 ± 0.49 |
∗Concentration in the organic phase after extraction has been obtained by subtracting the concentration of the aqueous solution before extraction by the concentration of the aqueous solution after extraction (also measured by ICP-OES).
3.3. Microfluidic L–L extraction
A typical set of microfluidic D-extraction/R-extraction results is given in Figure 5. The rest of the data can be found in the Supplementary Information as well as extraction ratios corresponding to each L–L extraction studies. The graphs of Figure 5 give the concentration for both Yb3+ and Fe3+ and D-extraction/R-extraction, as a function of time of flow in the microfluidic platform. For each value of flow, one can observe first a transition period in which the concentration increases until it levels off to a plateau value which corresponds to the steady state reaching. This transition is due to the time it takes for the microfluidic XRF channel’s content to be fully exchanged with the liquid coming out of the L–L extraction chip’s channels. One can therefore note that at 1 μL/min the steady state is barely reached. Each plateau value corresponds to one point in the extraction kinetics of the ionic species. When the position of the plateau no longer changes with a reduction of the flow rate, then the extraction thermodynamic equilibrium is reached. This equilibrium value should be identical in both D-extraction and R-extraction. From all this, one can calculate free energies of transfer, which accurate determination is key to enable its decomposition in terms, described by Spadina et al., as “representing strong complexation energies, counterbalanced by various entropic effects and the confinement of polar solutes in nanodomains dispersed in the diluent, together with interfacial extractant terms” [18]. To further increase accuracy, measuring the equilibrium temperature dependence helps to determine the overall entropic contribution [19]. These measurements are at the core of ienaics, which can be defined as the methodology describing ion transfer between two phases or involving a bulk phase and an interface. Models requiring experimental thermodynamic parameters are currently under investigation in order to better understand these complexation behaviors [20].
Concentration of Yb3+ and Fe3+ as a function of time for D-extraction and R-extraction at 20 °C. NB: For organic D-extractions, rare negative spikes are observed, which are the signature of a microbubble of air passing in the microfluidic channel.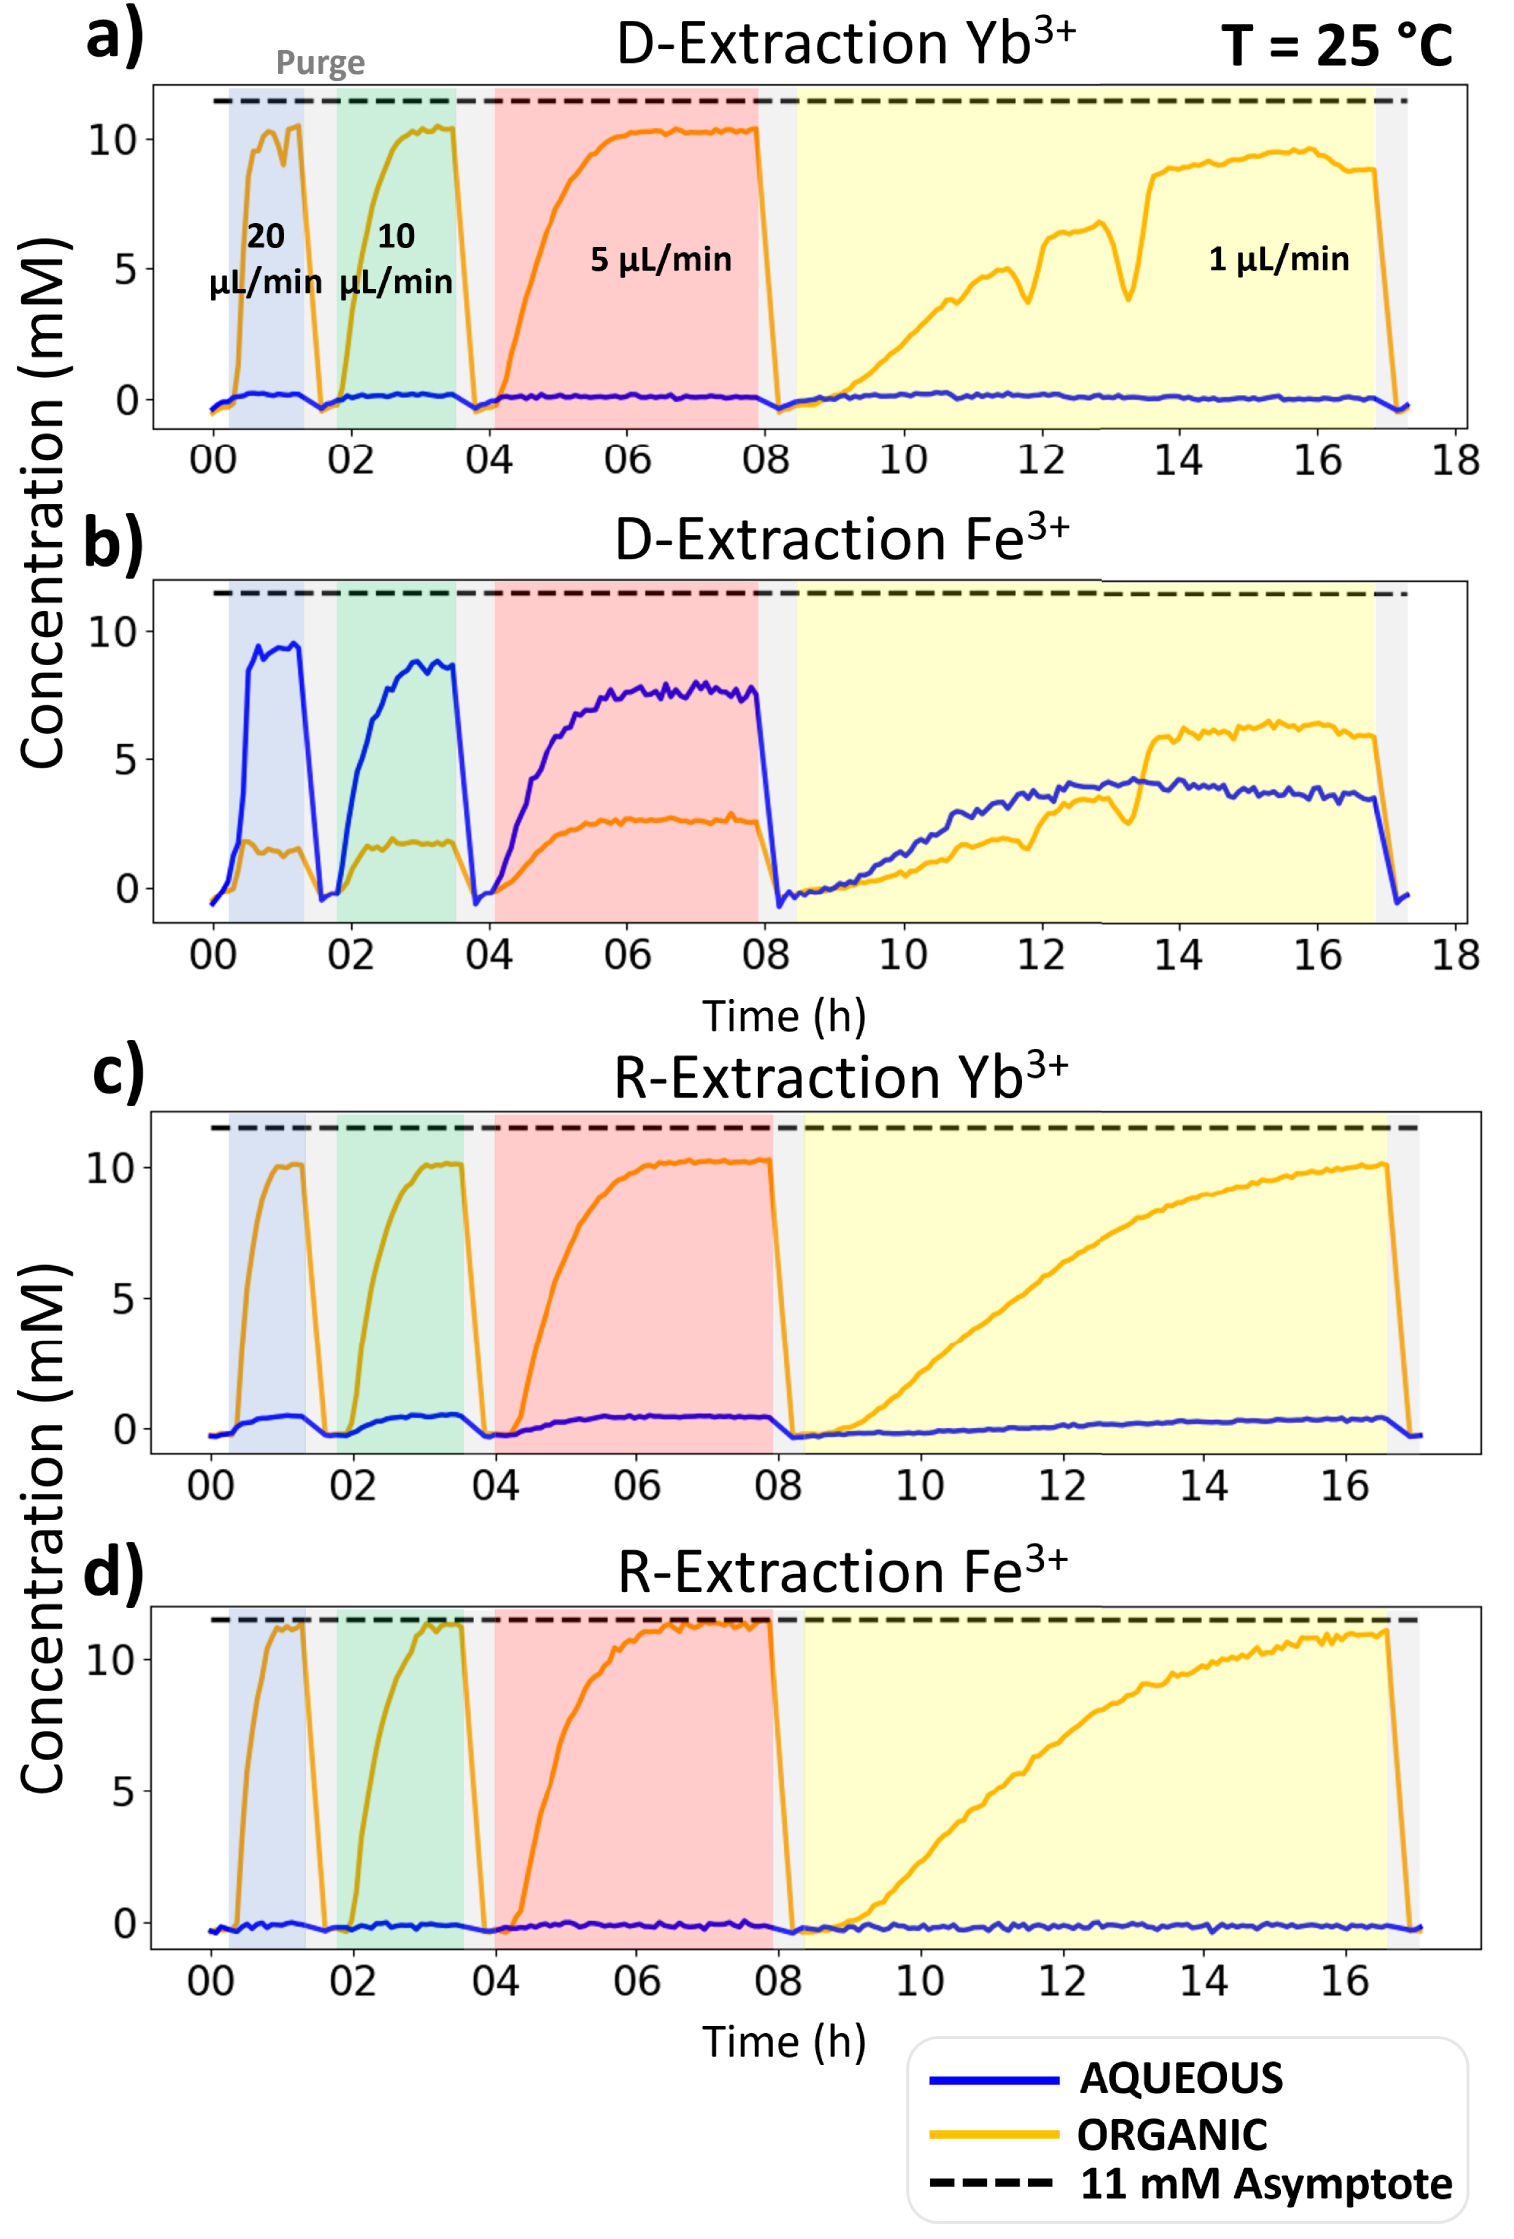
For Yb3+, all plateau values are very similar whether in D-extraction or R-extraction and both for the water and organic channels. This proved that:
- thermodynamic equilibrium is reached within less than 1.7 minutes of contact time.
- the extraction kinetic is so fast that it cannot be resolved with our membrane-based L–L extraction microfluidic device, presumably indicating that the extraction kinetics of Yb3+ is driven by matter transport. It should be noted that for such fast kinetics, membrane free L–L extraction chips have been developed [7, 21].
If one now considers the case of Fe3+, although we know from the batch study that its equilibrium is similar to Yb3+, at 20 °C the kinetics are very different. Indeed, in extraction from water to organic phase, the aqueous and concentration steady state values keep on decreasing with contact time. This indicates that the thermodynamic equilibrium is not reached for iron, even at the longest contact time explored of 34 minutes. The extraction kinetics of Fe3+ are certainly driven by chemistry and not by transport like Yb3+. At 34 minutes of contact time, the extraction ratio is 68.18%, still quite far from the single ion reference value of 99.77% measured by batch extraction in Section 3.2. It should be noted that this reference value is also observed by the microfluidic R-extraction (Figure 5(d)) and in the presence of Ytterbium, which shows that only a few percent of Fe3+ are transferred from the organic phase into the aqueous one. This represents another feature of investigating both D-extraction and R-extraction: it allows clear-cut upper and lower boundaries for the equilibrium value. Furthermore, in the case of a very slow extraction from the aqueous into the organic phase it quickly helps finding the true value from the R-extraction one. This is especially important when investigating ions mixtures and the induced ion extraction competition, as we can see here, with lower maximum extraction ratio for Fe3+ and Y3+ mixtures, when compared to quasi-full extraction when performed alone.
3.4. Impact of temperature over the extraction
The overall kinetics trend underlined in Section 3.3 is also displayed for the three other studied temperatures. Figure 6 shows the evolution of the aqueous concentrations of Fe3+ ions obtained at each plateau as a function of the different applied contact times from 20 °C to 35 °C. For a given contact time, the extraction speed increases with temperature, and this is particularly emphasized at low contact times. Within that timeframe of study, thermodynamic equilibrium is only nearly reached at 35 °C for Fe3+. Indeed, for a contact time of 34 min, the Fe3+ concentration gets close to the thermodynamic value (shown here with the dashed-line asymptote on Figure 6).
Aqueous Fe3+ concentrations vs. contact time for L–L extractions at 20, 25, 30 and 35 °C. The error bar located in the top-right corner is applicable to all data points presented in this graph.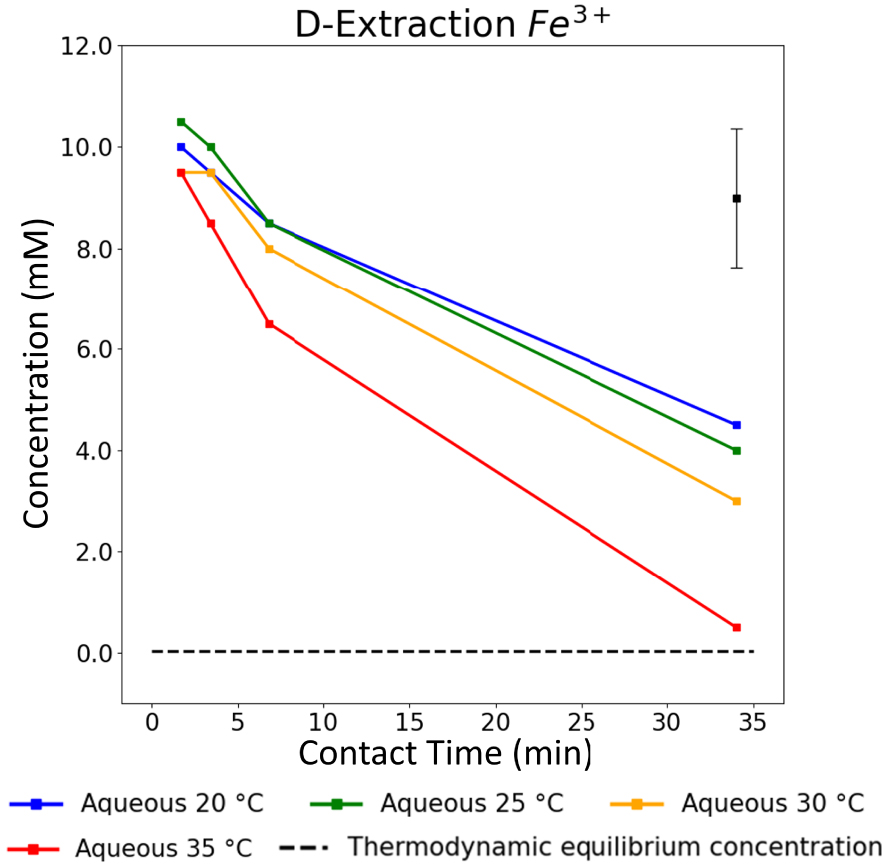
Finally, the dual measurement of both aqueous and organic phases during L–L D-extraction or R-extraction enables the calculation of true Gibbs free energy of extraction, 𝛥G, with concentrations taken at confirmed thermodynamic equilibrium (in our case, the thermodynamic equilibrium was reached in either both or in at least one of the two extractions performed—direct or reverse extraction). This dual measurement is indeed of particular importance to verify that the perceived equilibrium is true and not just a very slow kinetics of extraction. Calculation of 𝛥G is obtained from the Debye–Hückel Law [22] as follows (see (2)):
| (2) |
| (3) |
Besides, as this study involves L–L partition processes performed at four different temperatures, it enabled calculation enthalpy and entropy variations (𝛥H and 𝛥S), using the van’t Hoff equation (see (3)). One should note that the van’t Hoff equation only gives the apparent values of 𝛥H and 𝛥S. Indeed, this equation should not be applied to such complex fluids as enthalpy and derivative entropy both depend on aggregation.
| (4) |
In our case, 𝛥G calculations could only be done for Yb3+ in both D-extractions and R-extractions and, for Fe3+, in R-extractions as no thermodynamic equilibrium was reached for D-extractions of iron (Figure 7). However, for all these extractions and R-extractions, one should be aware that high measurement errors affected 𝛥G values because of high extraction ratios for both Yb3+ and Fe3+. Indeed, aqueous concentrations at equilibrium (see Figure 5(c) and (d)) are low, which means that the corresponding XRF peaks have a poor signal over noise ratio in the spectra. This leads to important but intrinsic and unavoidable errors regarding 𝛥G calculations.
Free energy 𝛥G in kJ/mol as a function of temperature for the Reverse extraction. The net entropy during R-extraction is a different sign: differences of binding of water around the transferred ion between the initial solvent phase and final water phase are an opposite sign.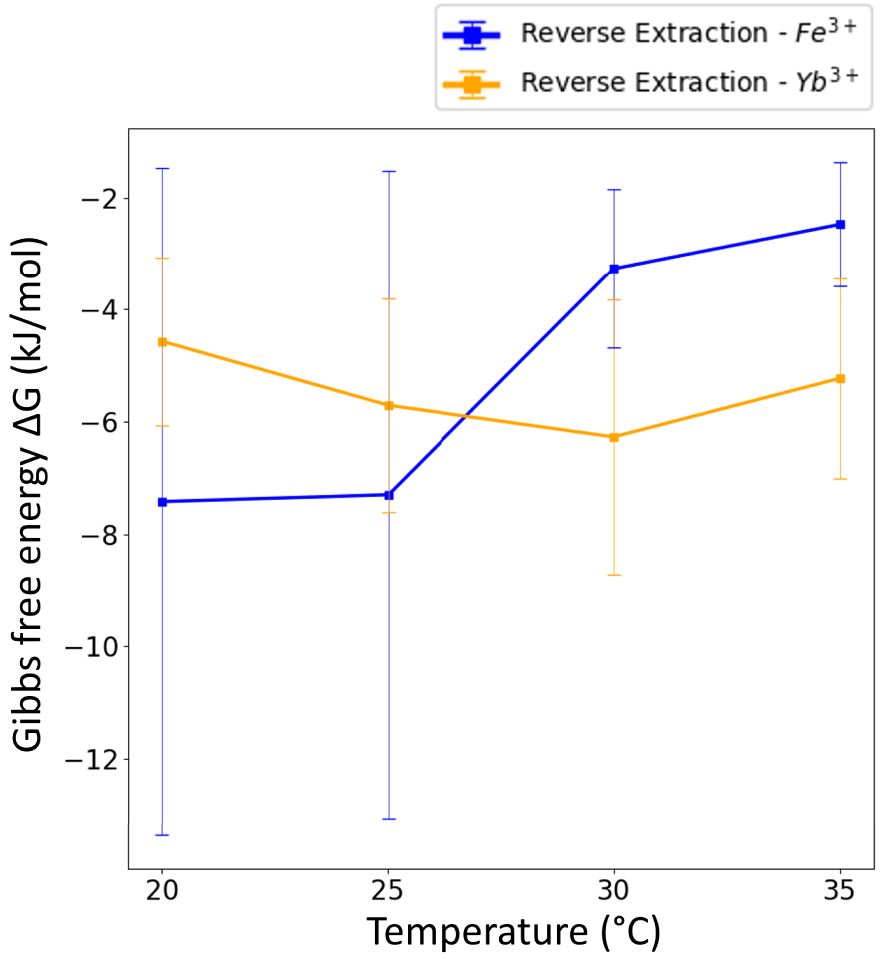
Entropy and Enthalpy values for Yb3+ and Fe3+ for R-extraction as deduced from a van’t Hoff decomposition assuming ideal behaviour and no nano-structuration
| Ion | T𝛥S (J/mol) | 𝛥H (kJ/mol) |
|---|---|---|
| Yb3+ | 15.2 ± 29.4 | −15.5 ± 2.9 |
| Fe3+ | −113 ± 9 | −4.0 ± 2.0 |
Table 3 presents 𝛥H and T𝛥S values for Fe3+ and Yb3+ for R-extraction where T𝛥S refers to molecular forces. The results show an exothermic reaction for both elements.
Finally, this kind of rare study, that includes kinetics, enables the determining of a best operating point, which is a trade off between the extraction selectivity of the studied species and the amount of extracted elements for a given contact time. In our case study, as underlined Section 3.3, the extraction system reported here displays such a fast kinetics that below 25 °C, our first data point is already an optimal one with most of the Yb3+ extracted with maximum selectivity.
4. Conclusion
L–L extraction is a long-standing process used to separate chemicals and elements from one another. However, in batch mode this process lacks fast-development timespan and requires large amounts of chemicals, particularly extracting molecules (extractants), which are usually the most expensive chemical in such a process. Microfluidics solves these development issues and enables the study of new extracting systems in a faster, more exhaustive, and more accurate way. The experiments reported in this paper showed that microfluidics plays a key role when searching for a better understanding of both thermodynamic and kinetic data for a given chemical system. It highlights that, although no selectivity can be observed when working at equilibrium, the kinetic study allows to determine a path for a successful separation by playing on their difference in extraction kinetics. The experiments also illustrated the limits of this approach when dealing with fast extraction kinetics or the near to full extraction cases.
Furthermore, this unique example of a study that performs both direct and reverse extractions illustrates well the importance of measuring them both. Indeed, it helps in two ways: (i) to quickly measure the true value of the thermodynamic equilibrium, even in the case of an unusually slow extraction (taking days to reach equilibrium), which can sometime be mistaken with a “no extraction”; (ii) to study the asymmetry of kinetics of ion transfers at the aqueous/organic interface, in both directions, ca. from water to oil and from oil to water for which there is a quasi-total lack of data [21, 23], and that was reported, for the first time, only recently in the case of liquid–liquid extraction of metals [15].
Abbreviations
L–L, liquid–liquid; XRF, X-ray Fluorescence; REE, Rare-Earth Element; PTFE, Polytetrafluoroethylene; PEEK, Polyether Ether Ketone; PC, Polycarbonate; D-extraction, Direct extraction; R-extraction, Reverse extraction; PMMA, Poly(methyl metacrylate); ICP-OES, Inductively Coupled Plasma–Optical Emission Spectroscopy.
Conflicts of interest
The authors declare no conflict of interest.
Acknowledgments
AM, DM and JCG acknowledge financial support from SCARCE project, which is supported by the National Research Foundation, Singapore, and National Environment Agency, Singapore under its Closing the Waste Loop Funding Initiative (Award No. USS-IF-2018-4). JCG acknowledges funding for the microfluidic platform from the European Research Council under the European Union’s 7th Framework Program (FP/2007-2013)/ERC Grant Agreement N° [320915] “REE-CYCLE”: Rare Earth Element reCYCling with Low harmful Emissions. FO thanks CEA’s program “Matériaux et Procédés” for a PhD support (project MICROPRO).
All authors thank deeply Thomas Zemb for fruitful discussions and manuscript editing suggestions. FO thanks Sarah Chevrier for discussions about experimental setup and results analysis. Total Energies is acknowledged for supplying us with free samples of Isane® IP175.
JCG and DM conceptualized the study; FO and AM designed new versions of microfluidic chips; JCG and FO defined the methodology; FO performed the experimental investigation, data collection, then with AM performed data curation; and with JCG their interpretation; FO and JCG wrote first draft; All authors contributed to further writing, review & editing of the article; JCG managed, coordinated and supervised as well as together with DM secured funding.