


 CC-BY 4.0
1. Introduction
Triterpenoids are molecules that can undergo a variety of structural modifications. Among these compounds, we highlight pentacyclic triterpenoids such as lupeol, α-amyrin and β-amyrin, which are often found in the form of glycosylated structures called triterpene saponins [1, 2]. They are glycosides that have antiviral, antitumor and hepatoprotective properties [3, 4]. In addition to the triterpenoids, tetranortriterpenes (limonoids) are formed from euphol/tirucallol as a result of the cyclization of the side chain with the loss of four carbon atoms giving rise to the formation of a furan ring [5]. Chemotaxonomic markers of the Meliaceae family, these compounds make the species Carapa guianensis Aubl. an important raw material for traditional Amazonian medicine. Of the plant’s parts, the seed stands out, from which an oil popularly known as andiroba oil is extracted. This oil is widely used in the treatment of numerous pathologies, as it has anti-inflammatory, analgesic, antiarthritic, antitumor, larvicidal and antimicrobial properties [6, 7, 8]. Among the numerous phytochemical compounds extracted from various parts of plants in the Meliaceae family, limonoids stand out as the most significant. These compounds are noted for their diverse biological activities, including insecticidal, antifungal, antimalarial, antibacterial, antiviral, and anticancer properties [9, 10].
On an industrial scale, andiroba oil is obtained by cold-pressing the seeds (kernels and husks) without adding organic solvents, which consists in a continuous and clean extraction, free of any chemical additives, generating a solid by-product [11]. The quality of the by-product is a reflection of the process used to obtain the oil, as pressing the seeds allows for greater efficiency in the extraction of lipid metabolites. However, the downside is the significantly low yield of vegetable oil extracted [12], which results in a greater need for raw materials to obtain a considerable amount of product, generating an accumulation of agro-industrial waste. In this case, cold pressing extracts 34% m/m of extra virgin oil and leaves a significant percentage of residue, approximately 66% m/m, of which only a small part is used in the production of repellent candles [11, 13]. The rest is discarded, burned, used in compost, or occasionally used as a complement to pig feed [14].
This agro-industrial residue, when combined with well-controlled production processes and appropriate pretreatment, can be used as a primary material to obtain substances and sub-extracts of economic and pharmacological interest, since even after the targeted processing, the resulting residue can still contain a number of important compounds [14, 15, 16]. In general, the use of agro-industrial waste has become a useful alternative to issues of sustainability and scarcity of resources, as well as being a source of bioproducts. Indeed, they are derived from peels and seeds, which can still contain fibers and bioactive compounds after industrial processing, thus presenting numerous technological applications, such as in the production of pharmaceuticals and cosmetics [17, 18]. Furthermore, the use of by-products is proving to be a tool for enhancing the value of the production chain.
Therefore, given the economic importance of the Carapa guianensis species and the fact that industrial processing to obtain oil from its seeds generates a significant percentage of agro-industrial residue, the aim of this research was to investigate the chemical composition of the agro-industrial residue from C. guianensis seeds in order to identify the presence of substances of economic and pharmacological interest that add value to the residue.
2. Material and methods
2.1. Chemical products and materials
All the chemical reagents and solvents used for extractions, chromatographic and spectroscopic analyses were of analytical grade, from TEDIA® COMPANY (Fairfield, USA). Column chromatography (CC) was performed using normal phase silica gel (60–200 μm) (SiliCycle Inc., Quebec, Canada). In addition, thin layer chromatography (TLC) was carried out on SiliaPlate TLC chromatography plates with aluminum and glass supports, silica, 200 μm, 20 × 20 cm, F 254 (SiliCycle Inc., Quebec, Canada). The structural elucidation of the isolated substances was carried out using one-dimensional nuclear magnetic resonance (NMR). The NMR spectra were obtained on a VARIAN® Mercury Plus spectrometer operating at 300 MHz for 1H and 75 MHz for 13C. The chemical shifts were recorded with dimensionless δ values (ppm), with the signal from the deuterated solvent as the internal reference. The solvents were CDCl3 and C5D5N from CAMBRIDGE ISOTOPE LABORATORIES®.
2.2. Obtaining and processing the agro-industrial residue Carapa guianensis
The extracted cake from the mechanical pressing of C. guianensis seeds was purchased from the local industry in the municipality of Ananindeua, in the state of Pará, in the northern region of Brazil (SisGen registration number A3B8C54). This cake was dehydrated in an oven at a temperature (T) of 45 °C and humidity (U%) of 20% until it reached a constant mass. The dehydrated material was crushed and sieved through a 40 mesh, and the resulting sample was vacuum-packed and stored at 25 °C.
2.3. Preparation of the extracts
The phytochemical analysis of the C. guianensis agro-industrial residue was based on preliminary tests in triplicates, assessing the extraction method (cold and hot) and the extraction efficiency of the organic solvents used (hexane, ethyl acetate, and ethanol). In both extractions, a sample mass/solvent volume ratio of 1:10 m/v was adopted. The cold extractions using a single solvent and successive extractions (increasing polarity gradient) lasted 24 h at room temperature each. Each extraction was carried out in triplicate in a single batch, with the solvents renewed twice. The hot Soxhlet extractions lasted three hours for each solvent. All extract solutions obtained were concentrated to solids in a Syncore rotary evaporator (BÜCHI - Flawil, Switzerland).
2.4. Characterization of the extracts by HPTLC
The chemical profile of the extracts was obtained by HPTLC (High Performance Thin-Layer Chromatography - CAMAG®). The samples were deposited in spot form, 10 μg/spot for the extracts and 1 μg/spot for the limonoid standard (7-desacetoxy-7-oxogedunin) on silica gel F-254 60 Å chromatoplates with glass support (SILICYCLE®) in an ATS4 (Automatic TLC Sample4) module. The chromatoplates were then eluted in the AMD2 (Automated Multiple Development) module in gradient mode, following the 12-step adjustment with decreasing polarity and a chromatographic path of 80 mm, using a mixture of organic solvents as the mobile phase: hexane/ethyl acetate/methanol (1% formic acid), ranging linearly from 70/15/15% to 100/0/0%. It was then developed using a selective reagent for terpenes and limonoids (VSA) and scanned using the TLC Visualizer photodocumenter in white light. The data was stored and processed in the WinCats - Planar Chromatography Manager software, version 1.4.6 (CAMAG, Muttenz, Switzerland).
2.5. Fractionation and isolation
The fractionation of 50 g of the extract obtained from the hot ethanolic extraction of the agro-industrial residue of C. guianensis (E9) was performed by column chromatography (CC), using silica Flash G60 (60–200 μm) (SILICYCLE®) as the stationary phase and, as a mobile phase, a gradient of increasing polarity with seven hexane/ethyl acetate/methanol systems: (1) 90:0.5:0.5, (2) 80:10:10, (3) 70:15:15, (4) 60:20:20, (5) 50:25:25, (6) 00:50:50, and (7) 00:00:100. The fractions obtained were analyzed by HPTLC and combined based on similarities into 4 fractions: F1 (2.0 g), F2 (2.77 g), F3 (1.62 g), and F4 (3.65 g).
Fractions F1 to F3 were subjected to silica gel column chromatography using mixtures of hexane, ethyl acetate, and methanol as eluents, in ascending order of polarity. The fractions were monitored by TLC and revealed with VSA and visible light. Fraction F4 was also subjected to silica gel column chromatography, but using dichloromethane (100%) as the mobile phase. The resulting chromatographic fractions were analyzed by TLC and combined into fractions 55 to 80, which were purified by preparative thin layer chromatography. Two 50 mg injections of samples solubilized in methanol were deposited as a 180 mm × 3 mm band on preparative TLC and eluted in a 15% dichloromethane/methanol system, following a 150 mm chromatographic path. The chromatographic bands were demarcated and removed, each sample was solubilized in methanol and filtered. All the substances were identified by 1D (1H and 13C) and 2D (1H–13C HETCOR, HSQC, and HMBC) NMR spectroscopy , and the data compared with literature:
Gedunin (S1): From F1, fractions 56 to 72, a white amorphous solid (15 mg); 1H NMR (CDCl3) and 13C NMR (CDCl3) (see Tables 2 and 3; Section S1, Supplementary Material).
6α-Acetoxygedunin (S2): From F2, fractions 33 to 36 (white crystals) (18 mg); 1H NMR (CDCl3) and 13C NMR (CDCl3) (see Tables 2 and 3; Section S2, Supplementary Material).
7-Desacetoxy-7-oxogedunin (S3): From F3, fractions 38 to 52 (white crystals) (15 mg), 1H NMR (CDCl3) and 13C NMR (CDCl3) (see Tables 2 and 3; Section S3, Supplementary Material).
Oleanolic acid 3-O-[α-L-ramnopyranosyl-(1→2)-α-L-arabinopyranosyl] (S4): From F4, a white amorphous solid (38 mg); 1H NMR (C5D5N) and 13C NMR (C5D5N) (see Tables 4 and 5; Section S4, Supplementary Material).
Hederagenin 3-O-[α-L-ramnopyranosyl-(1→2)-α-L-arabinopyranosyl] (Pulsatilla A) (S5): From F4, a white amorphous solid (15 mg); 1H NMR (C5D5N) and 13C NMR (C5D5N) (see Tables 4 and 5; Section S5, Supplementary Material).
2.6. Fingerprint of hot ethanolic extract (E9) and commercial C. guianensis oil
The fingerprint of E9 and commercial andiroba oil was evaluated according to Section 2.4, this time by injecting the masses of the substances isolated and identified in this work (S1, S2, S3, S4, and S5).
3. Results and discussion
3.1. Extractor efficiency
Regardless of the solvent used, hot extraction gave higher mass percentage yields than cold extraction, with a percentage increase in yield ranging from 38.96 to 53.18%. When comparing the extracting capacity of each solvent, ethanol gave the highest mass yield (26.96%).
When the extraction was carried out with solvents in succession in increasing order of polarity, hexane was the one with the highest mass yield (12.14%). The cold extraction method with successive solvents could therefore be more suitable to extract low polarity components with greater affinity for hexane.
Thus, this work uses a chemical investigation approach to investigate the agro-industrial residue of C. guianensis. The choice of the extracting solvents was according to their selectivity with low, medium, and high polarity molecules, which allowed phytochemical screening. The ethanolic extract was chosen for the other studies due to its higher degradation rate. Above all, the preference for ethanol arises from its prevalence in biological studies using plant extracts, due to its low toxicity and low persistence in Nature. In addition, its low cost and large-scale production from renewable sources make it one of the safest solvents in the recovery of natural assets [19].
At the same time, green chemistry approaches have been developed to mitigate the undesirable effects of traditional extraction protocols, aiming to replace organic solvents with environmentally friendly alternatives. In this scenario, natural deep eutectic solvents (NADESs) have emerged as a pioneering proposal for the recovery of phytochemicals, as they offer advantages such as low toxicity, biodegradability, solute stabilization, sustainability, simple preparation, and tunable viscosity and density [20]. However, it is important to emphasize that for efficient extraction, some parameters must be considered, such as the physical properties of the solvent. For example, NADESs present hydrogen bond networks between the constituents, making them viscous, which compromises the extraction efficiency and, consequently, the affinity capacity of the target compounds with their phase. Therefore, there is a need to adjust this property [21, 22]. This implies additional investigations on the use of NADESs in the activities of isolation, separation, and recovery of bioactive compounds present in plant matrices, in addition to the elaboration and evaluation of extraction protocols using NADESs, the stability of biomolecules, production costs and their effects on human life and health, before their use in the pharmaceutical industry [21].
3.2. Chemical profile by high performance thin layer chromatography (HPTLC)
Chemical profile by HPTLC made it possible to evaluate the metabolic complexity of the compounds present in the extracts of the agro-industrial residue of C. guianensis. Following the methods described by [15], the use of vanillin–sulphuric acid solution (VSA) as a chemical developer allows the detection of fatty acids (blue), as well as terpenes, limonoids (chemotaxonomic marker) and steroids (purple). It was therefore possible to determine the occurrence of substances from these classes in all the extracts, because bands were formed with blue and/or purple tones after the plate was revealed with VSA. The Rf comparison with the standard 7-desacetoxy-7-oxogedunin (track 1 in Figure 1 Rf 0.53) made it possible to observe the presence of the limonoid 7-desacetoxy-7-oxogedunin in some extracts (0.53), based on the proportion of mass and intensity of coloration. It is notably observed in the hot ethanolic extract (tracks 18–19 in Figure 1), in addition to the diversity of compounds displayed through chromatographic bands throughout the chromatoplate, thus proving that this biomass still has a wealth of biomolecules even after extracting andiroba oil.
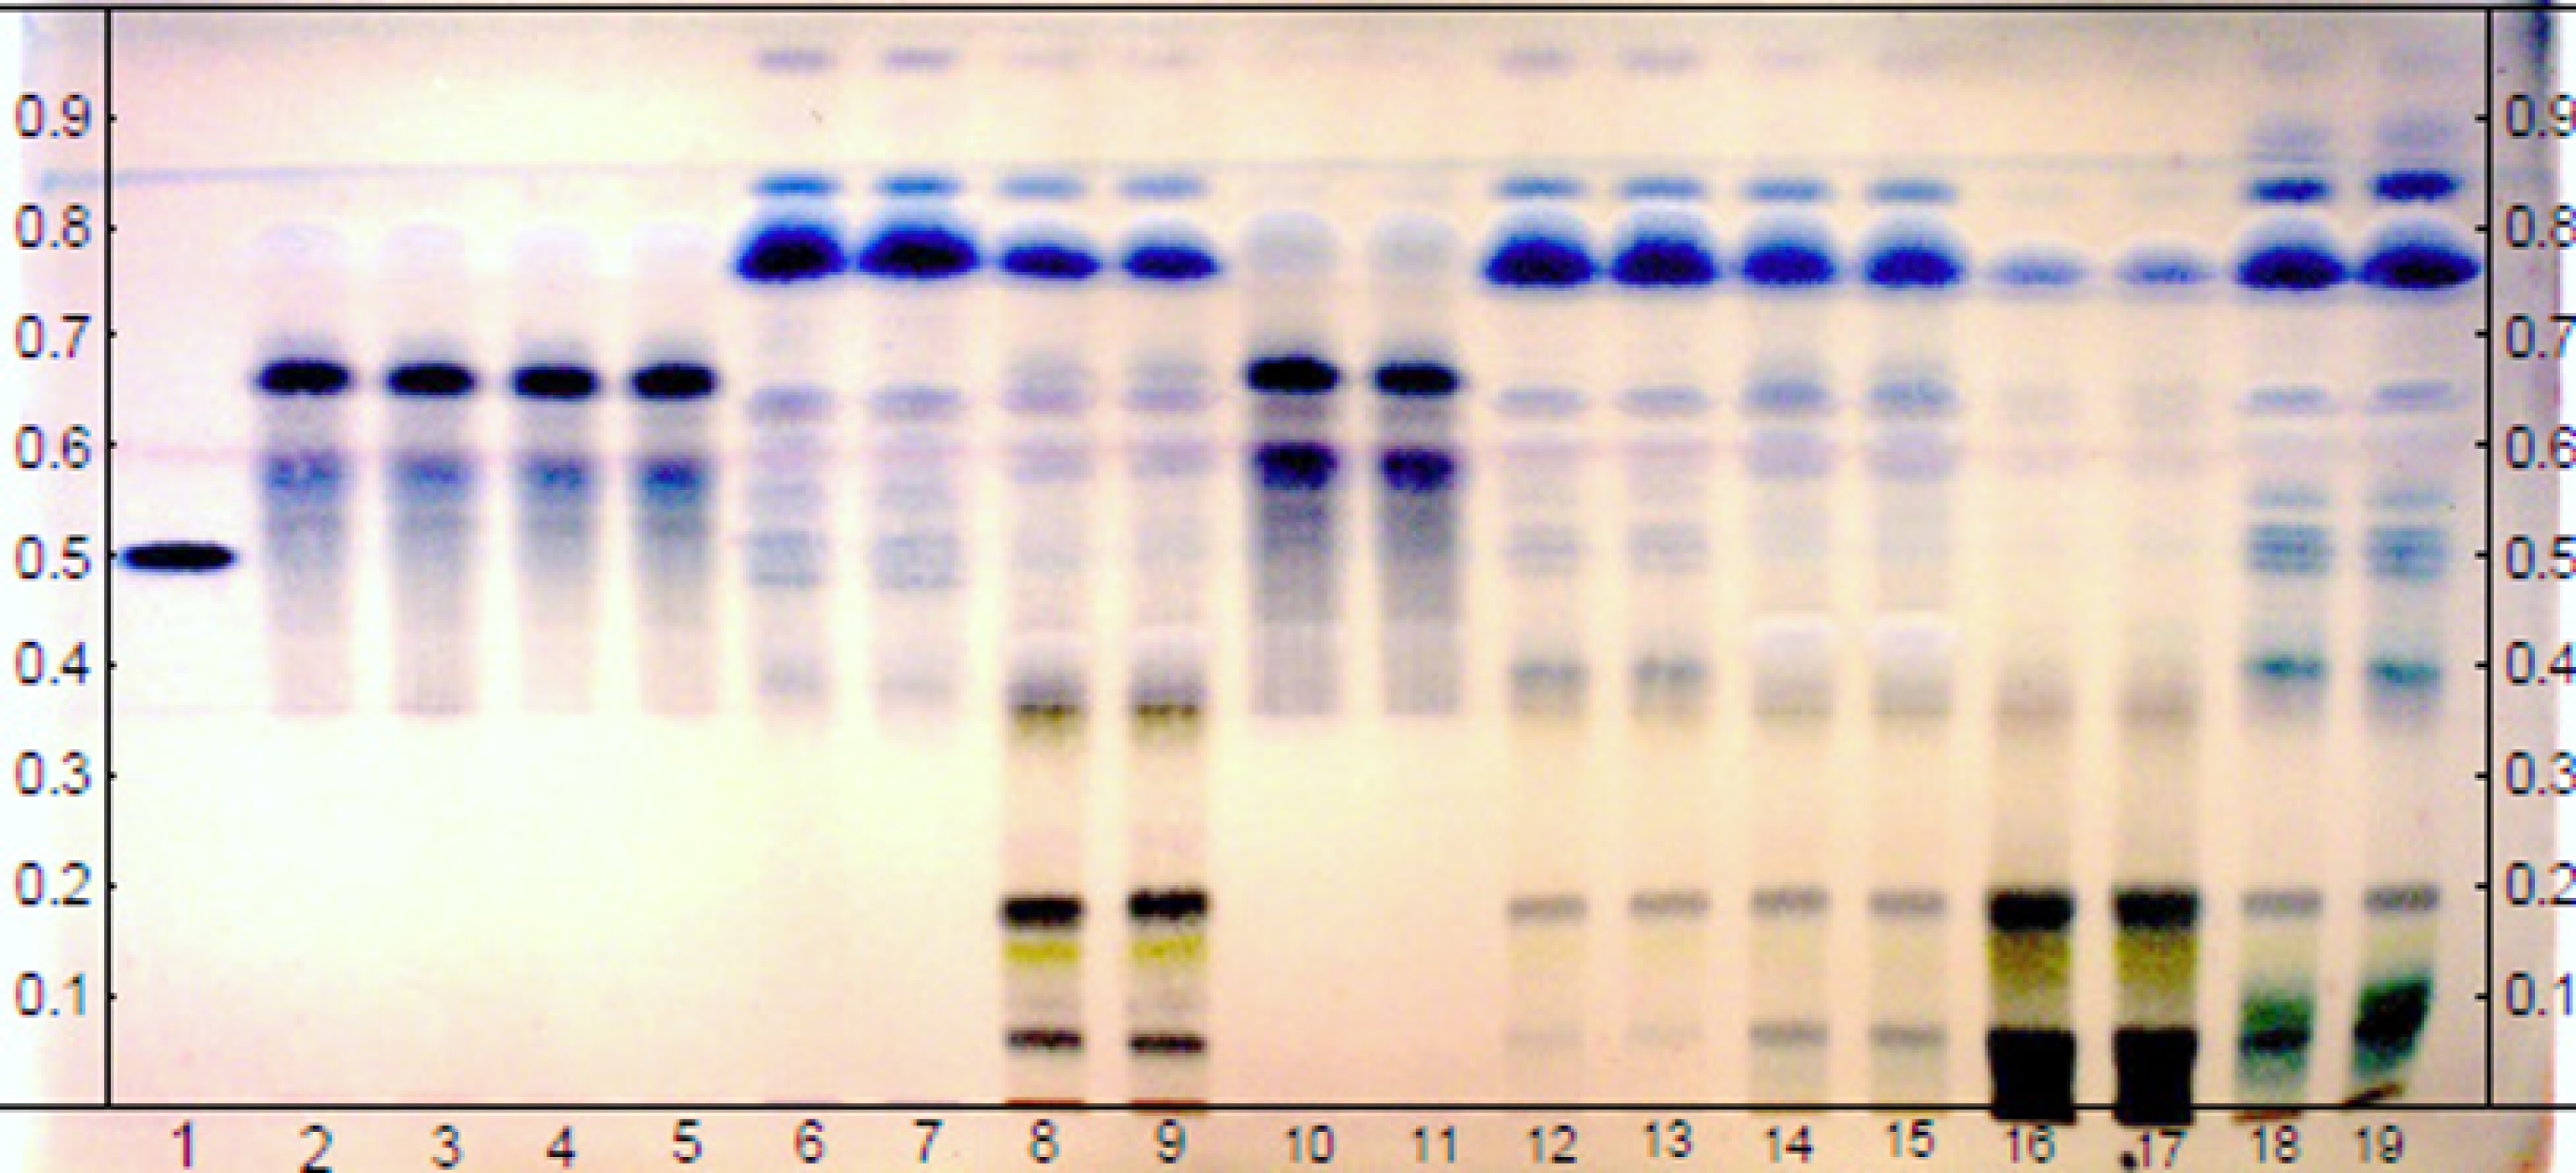
Result of the analysis of the chemical profile, via HPTLC, of the extracts obtained cold and hot, with the solvents Hex, AcOEt and EtOH (each in duplicate, see Table 1) and the limonoid standard 7-desacetoxy-7-oxogedunin (track 1). Elution system, gradient mode: Hexane/AcOEt/MeOH (1% HCOOH). VSA derivatizer.
Table 1 identifies, by means of acronyms, all the extracts obtained from the andiroba agro-industrial residue, in the cold and hot method, with the solvents: hexane, ethyl acetate and ethanol, as well as the standard.
Names of cold and hot extracts and the limonoid standard
| Standard | Organic solvents | Cold extraction | Hot extraction | |||||
|---|---|---|---|---|---|---|---|---|
| Single solvent maceration | Successive maceration | |||||||
| 7-desacetoxy-7-oxogedunin | Track | Extract | Track | Extract | Track | Extract | Track | |
| P | 1 | Hexane | E1 | 2–3 | E2 | 4–5 | E3 | 6–7 |
| Ethyl acetate | E4 | 8–9 | E5 | 10–11 | E6 | 12–13 | ||
| Ethanol | E7 | 14–15 | E8 | 16–17 | E9 | 18–19 | ||
3.3. Structural identification
Tetranortriterpenes identified in the study, gedunin (S1), 6α-acetoxygedunin (S2), and 7-desacetoxy-7-oxogedunin (S3) (Figure 2), are already known in the species, and the study only compared the 13C (CDCl3, 75 MHz) and 1H (CDCl3, 300 MHz) NMR signals with data from the literature, in addition to two-dimensional correlation maps 2D 1H 13C (HETCOR) and 1H 13C (HMBC).
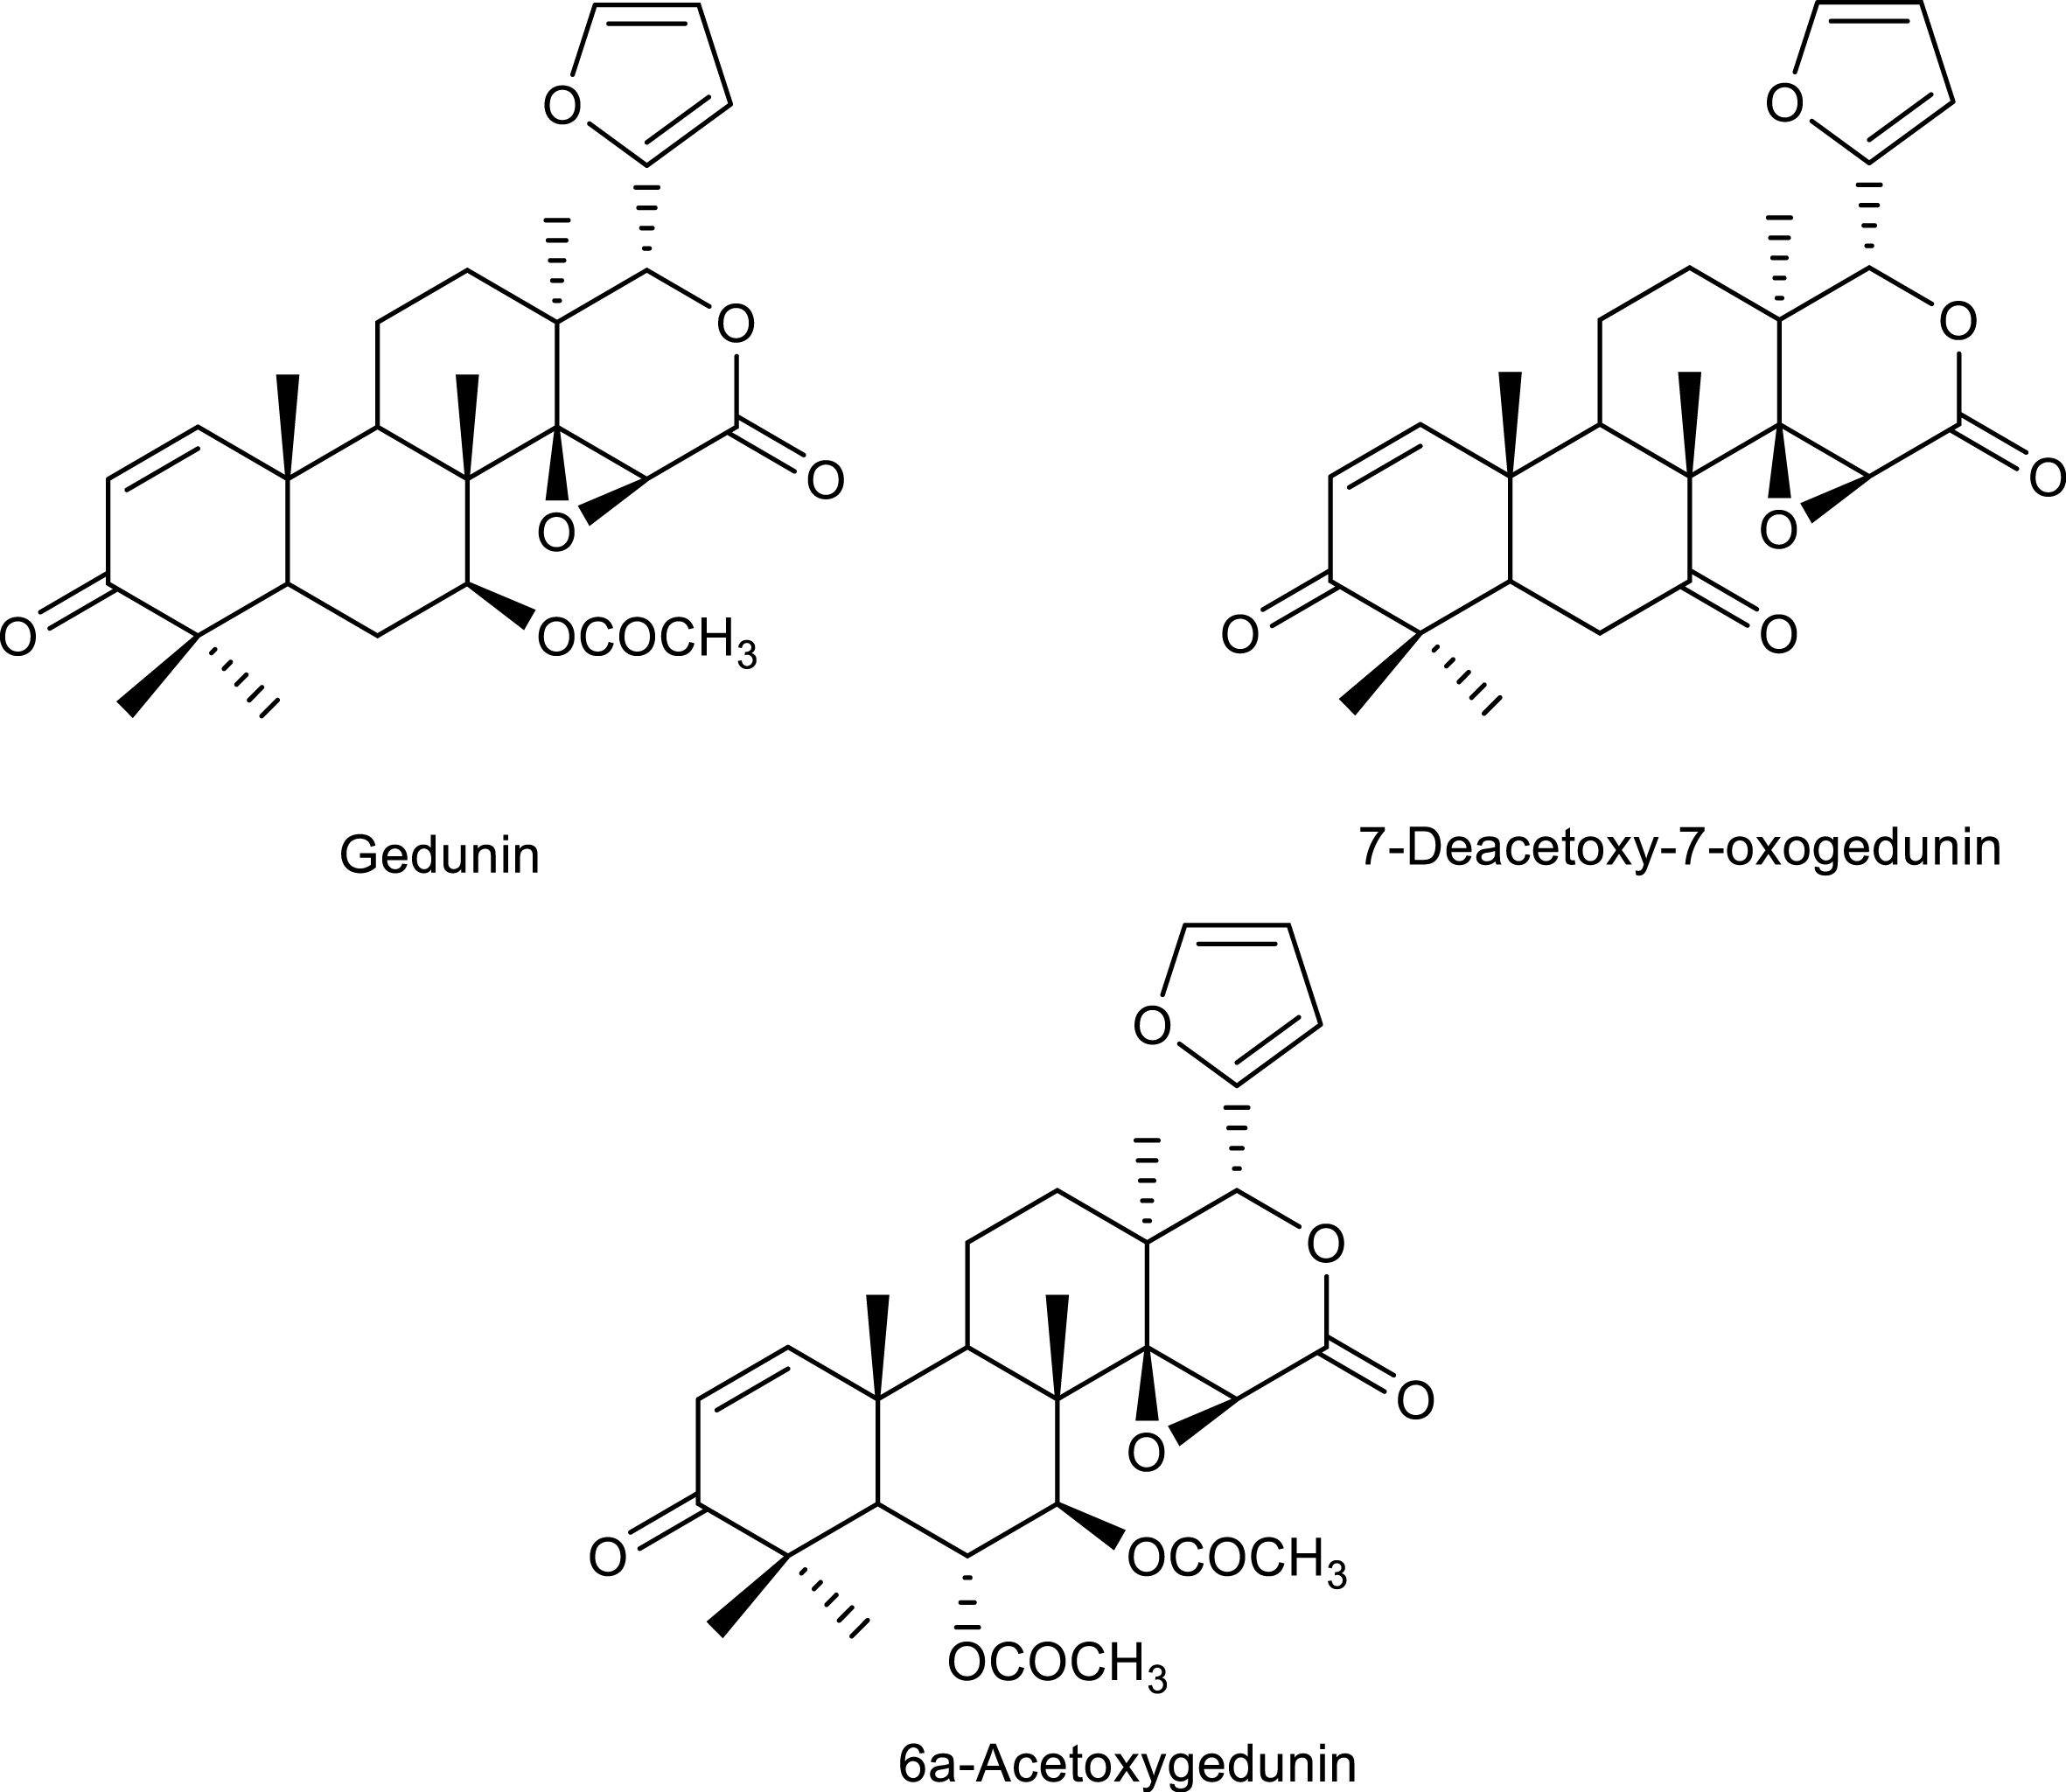
Limonoids identified in the agro-industrial waste of C. guianensis.
Gedunin (S1): characteristic signals of hydrogens and aromatic carbons at δH 7.41 (dl, J 1.5 Hz, 2H) and 6.33 (t, J 1.2 Hz, 1H); δC 120.4, 143.1, 109.8, and 141.2, respectively, indicating the presence of a furan ring in the structure (Tables 2 and 3; Section S1, Figures S1A–S1C, Supplementary Material).
1H NMR spectroscopic data for S1–S3
| 1H | S1 | 1a | S2 | 2b | S3 | 3b |
|---|---|---|---|---|---|---|
| δH | δH | δH | ||||
| 1 | 7.09 (d 10.2 Hz) | 7.07 (d 10.2 Hz) | 7.07 (d 10.2 Hz) | 7.07 (d 10.0 Hz) | 7.09 (d 10.2 Hz) | 7.09 (d 10.0 Hz) |
| 2 | 5.87 (d 10.2 Hz) | 5.84 (d 10.2 Hz) | 5.94 (d 10.0 Hz) | 5.93 (d 10.0 Hz) | 5.91 (d 10.2 Hz) | 5.94 (d 10.0 Hz) |
| 3 | - | - | - | - | - | - |
| 4 | - | - | - | - | - | - |
| 5 | 2.16 (dd 12.9 and 2.4 Hz) | 2.12 (dd 12.9 and 2.4 Hz) | 2.52 (d 12.6 Hz) | 2.52 (d 13.0 Hz) | 2.16 (dd 14.4 and 3.0 Hz) | 2.17 (dd 14.0 and 3.0 Hz) |
| 6 | 1.80–1.92 (m) | 1.79 (t 12.0 Hz) 1.92 (d 12.0 Hz) | 5.27 (dd 12.6 and 2.4 Hz) | 5.27 (dd 13.0 and 2.5 Hz) | α 2.39 (dd 13.8 and 3.3 Hz) β 2.92 (t 14.4 Hz) | α 2.41 (dd 14.0 and 3.0 Hz) β 2.92 (t 14.0 Hz) |
| 7 | 4.55 (sl) | 4.52 (sl) | 4.88 (d, 2.1 Hz) | 4.89 (d, 2.5 Hz) | - | - |
| 8 | - | - | - | - | - | - |
| 9 | 2.48 (dd 12.3 and 6.3 Hz) | 2.46 (dd 12.7 and 6.2 Hz) | 2.52 (d 12.6 Hz) | 2.53 (d 13.0 Hz) | 2.19 (dd 10.5 and 1.8 Hz) | 2.21 (dd 10.5 and 1.5 Hz) |
| 10 | - | - | - | - | - | - |
| 11 | 1.80–2.03 (m) | 1.81–2.00 (m) | 1.88–1.99 (m) | 1.88–1.99 (m) | 1.80–1.99 (m) | 1.80–1.99 (m) |
| 12 | 1.60–1.71 (m) | 1.56 (dd, 11.0 and 12.0 Hz) 1.70 (m) | 1.59–1.75 (m) | 1.59–1.74 (m) | 1.48–1.84 (m) | 1.48–1.84 (m) |
| 13 | - | - | - | - | - | - |
| 14 | - | - | - | - | - | - |
| 15 | 3.53 (s) | 3.50 (s) | 3.61 (s) | 3.61 (s) | 3.85 (s) | 3.86 (s) |
| 16 | - | - | - | - | - | - |
| 17 | 5.61 (s) | 5.59 (s) | 5.61 (s) | 5.61 (s) | 5.45 (s) | 5.46 (s) |
| Me-18 | 1.22 (s) | 1.22 (s) | 1.25 (s) | 1.24 (s) | 1.12 (s) | 1.13 (s) |
| Me-19 | 1.20 (s) | 1.19 (s) | 1.21 (s) | 1.20 (s) | 1.34 (s) | 1.35 (s) |
| 20 | - | - | - | - | - | - |
| 21 | 7.41 (dl 1.5 Hz) | 7.39 (dl 1.3 Hz) | 7.41 (dl 1.0 Hz) | 7.41 (dl 1.0 Hz) | 7.40 (dl 1.0 Hz) | 7.41 (dl 1.0 Hz) |
| 22 | 6.33 (t 1.2 Hz) | 6.31 (t 1.3 Hz) | 6.33 (t 1.2 Hz) | 6.33 (t 1.5 Hz) | 6.35 (dl 1.2 Hz) | 6.36 (dl 1.5 Hz) |
| 23 | 7.41 (dl 1.5 Hz) | 7.39 (dl 1.3 Hz) | 7.41 (dl 1.0 Hz) | 7.41 (dl 1.0 Hz) | 7.38 (t 1.8 Hz) | 7.39 (t 1.5 Hz) |
| Me-28 | 1.06 (s) | 1.03 (s) | 1.26 (s) | 1.25 (s) | 1.14 (s) | 1.15 (s) |
| Me-29 | 1.07 (s) | 1.04 (s) | 1.16 (s) | 1.16 (s) | 1.12 (s) | 1.12 (s) |
| Me-30 | 1.15 (s) | 1.12 (s) | 1.24 (s) | 1.27 (s) | 1.20 (s) | 1.21 (s) |
| 6-OCOCH3 | - | - | 2.03 (s) | 2.03 (s) | - | - |
| 7-OCOCH3 | 2.03 (s) | 2.07 (s) | 2.15 (s) | 2.15 (s) | - | - |
13C NMR spectroscopic data for S1–S3
| 13C | S1 | 1a | S2 | 2b | S3 | 3b |
|---|---|---|---|---|---|---|
| δC | δC | δC | ||||
| 1 | 157.0 | 157.0 | 156.2 | 156.0 | 155.9 | 156.3 |
| 2 | 126.0 | 125.9 | 126.6 | 126.7 | 126.3 | 126.8 |
| 3 | 204.0 | 204.0 | 204.1 | 204.2 | 203.2 | 203.4 |
| 4 | 44.0 | 44.0 | 44.9 | 45.2 | 45.1 | 45.4 |
| 5 | 46.0 | 46.0 | 38.4 | 38.6 | 54.5 | 54.8 |
| 6 | 23.2 | 23.2 | 69.6 | 69.8 | 36.6 | 36.9 |
| 7 | 73.2 | 73.2 | 72.6 | 72.8 | 208.2 | 208.3 |
| 8 | 42.6 | 42.6 | 43.0 | 43.8 | 53.5 | 53.6 |
| 9 | 39.5 | 39.5 | 47.8 | 47.9 | 47.5 | 47.8 |
| 10 | 40.0 | 40.0 | 40.6 | 40.8 | 39.5 | 39.8 |
| 11 | 14.9 | 14.9 | 15.0 | 15.2 | 17.3 | 17.6 |
| 12 | 26.0 | 25.9 | 25.8 | 26.1 | 32.1 | 32.4 |
| 13 | 38.7 | 38.7 | 38.7 | 38.9 | 37.7 | 37.9 |
| 14 | 69.8 | 69.7 | 69.5 | 69.7 | 65.5 | 65.8 |
| 15 | 56.8 | 56.8 | 56.2 | 56.4 | 53.4 | 53.8 |
| 16 | 167.5 | 167.4 | 167.1 | 167.3 | 166.8 | 167.0 |
| 17 | 78.3 | 78.2 | 78.1 | 78.3 | 77.9 | 78.2 |
| Me-18 | 17.7 | 17.7 | 17.9 | 18.1 | 20.6 | 20.8 |
| Me-19 | 19.7 | 19.7 | 21.4 | 21.6 | 19.8 | 20.0 |
| 20 | 120.4 | 120.4 | 120.3 | 120.4 | 120.1 | 120.5 |
| 21 | 143.1 | 143.1 | 141.2 | 141.2 | 141.0 | 141.0 |
| 22 | 109.8 | 109.8 | 109.8 | 110.0 | 109.7 | 109.9 |
| 23 | 141.2 | 141.2 | 143.1 | 143.3 | 143.1 | 143.3 |
| Me-28 | 27.1 | 27.1 | 31.6 | 31.6 | 26.9 | 27.2 |
| Me-29 | 21.2 | 21.2 | 20.2 | 20.5 | 20.9 | 21.2 |
| Me-30 | 18.3 | 18.3 | 18.0 | 18.3 | 17.1 | 17.4 |
| 6-OCOCH3 | - | - | 21.2 | 21.4 | - | - |
| 6-OCOCH3 | - | - | 170.1 | 170.3 | - | - |
| 7-OCOCH3 | 21.0 | 21.0 | 20.9 | 21.1 | - | - |
| 7-OCOCH3 | 169.9 | 169.9 | 170.0 | 170.2 | - | - |
6α-Acetoxygedunin (S2): typical signals from hydrogens and aromatic carbons at δH 7.41 (dl, J 1.0 Hz, 1H) and 6.33 (t, J 1.2 Hz, 1H); at δC 120.3, 141.2, 109.8, and 143.1, respectively, indicating the presence of a furan ring in the structure (Tables 2 and 3; Section S2, Figures S2A–S2C, Supplementary Material).
7-Deacetoxy-7-oxogedunin (S3): typical signals from hydrogens and aromatic carbons at δH 7.40 (dl, J 1.0 Hz, 1H), 6.35 (dl, J 1.2 Hz, 1H), and 7.38 (t, 1.8 Hz, 1H); at δC 120.1, 141.0, 109.7, and 143.1, respectively, indicating the presence of a furan ring in the structure (Tables 1 and 2; Section S3, Figures S3A–S3C, Supplementary Material).
The findings were compared with those of [23, 24] (Tables 2 and 3). These compounds are noted for their diverse biological activities, including insecticidal, antifungal, antimalarial, antibacterial, antiviral, and anticancer properties. Such a variety illustrates their broad applicability, spanning the agricultural and pharmaceutical sectors. For example, their phytotoxic properties make them potential bio-inputs for the formulation of new herbicides in the control of parasitic plants. In clinical trials, the three compounds showed protective effects against liver damage induced by D-GalN/LPS in mice, which shows that they are promising for making hepatoprotective formulations [9, 10].
The research highlights the unprecedented identification of these substances in the Carapa gender, although the triterpene saponins identified in this study have already been reported in the literature (Figure 3). Therefore, the study only compared the 13C (C5D5N, 75 MHz) and 1H (C5D5N, 300 MHz) NMR signals with the data from [25, 26], (2006) (Tables 4 and 5) in addition to two-dimensional correlation maps 2D 1H 13C (HETCOR and HSQC) and 1H 13C (HMBC).
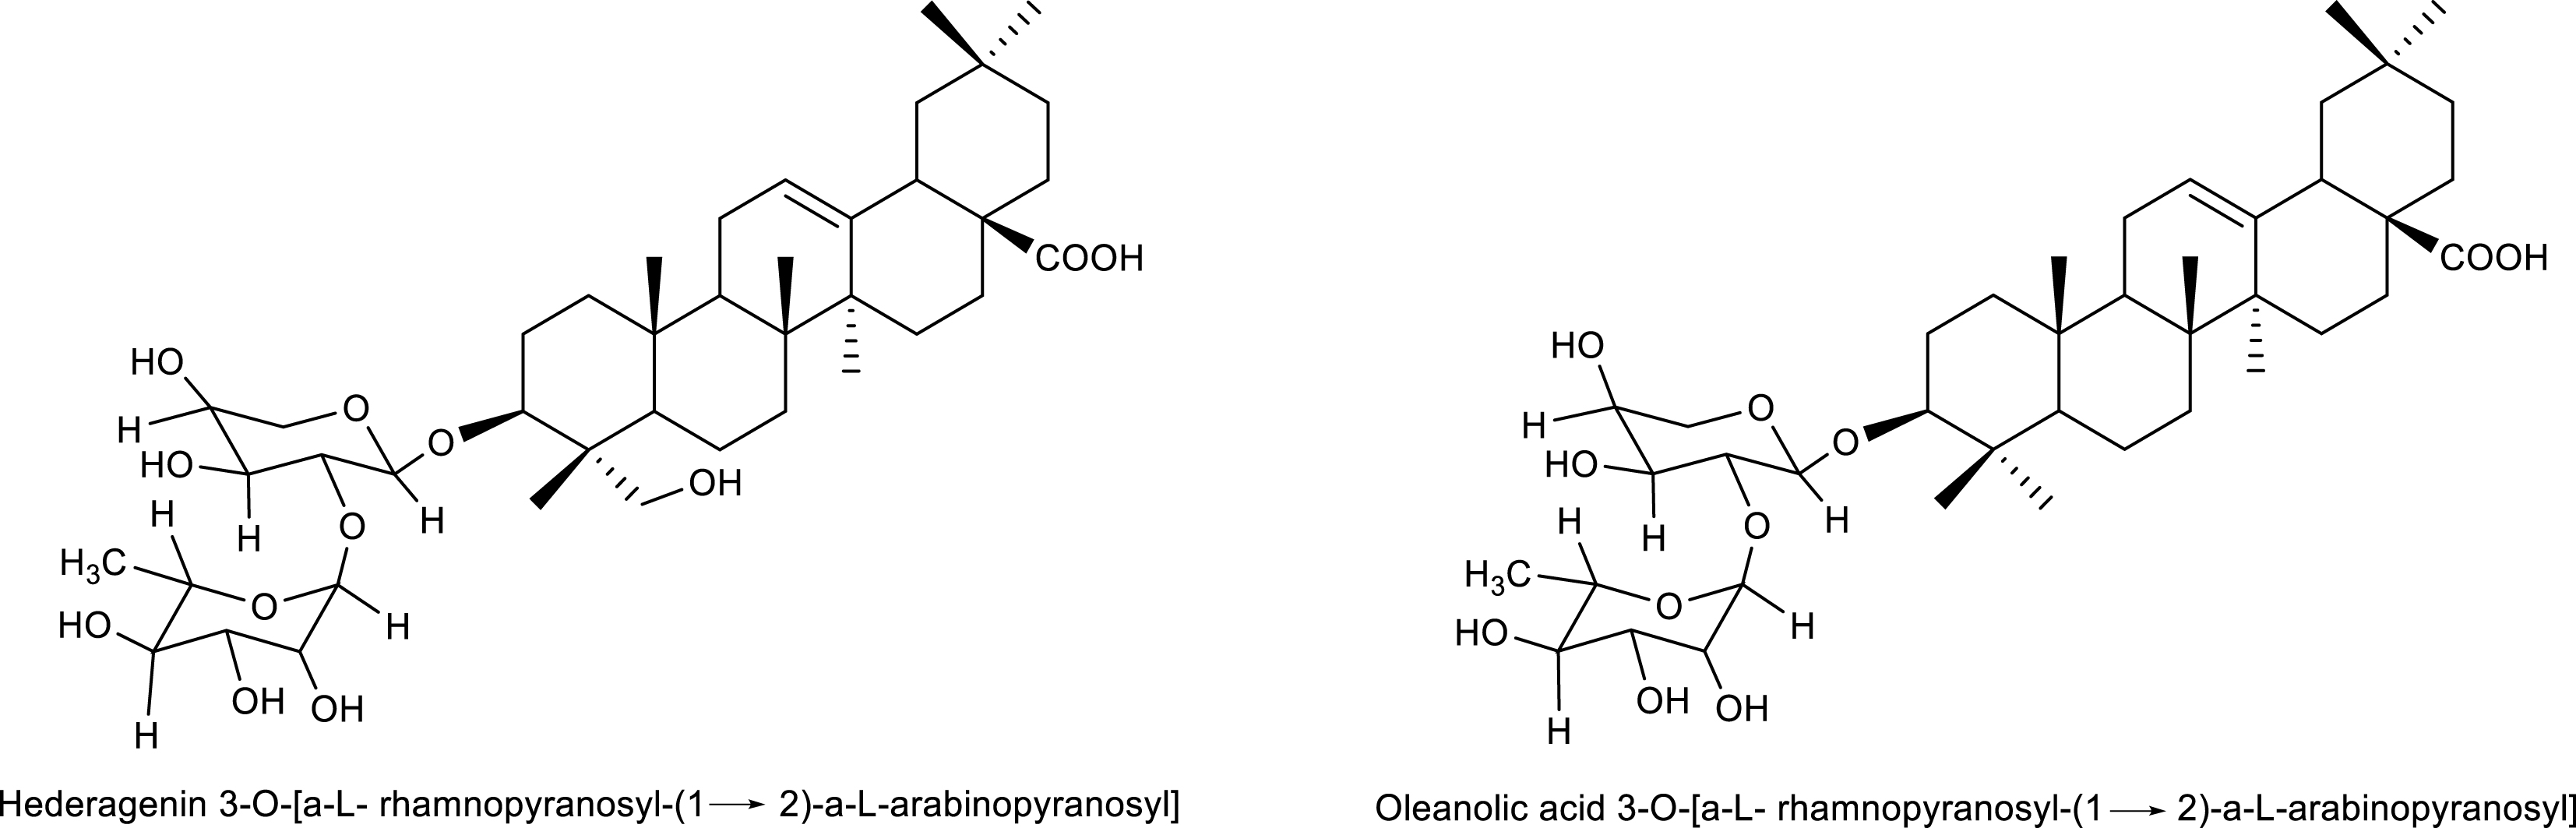
Triterpene saponins identified in the agro-industrial residue of C. guianensis.
1H NMR spectroscopic data for S4 and S5
| 1H | S4 | 4a | S5 | 5b |
|---|---|---|---|---|
| δH | δH | |||
| 1 | 1.42–1.54 (m) | - | - | - |
| 2 | 2.02–2.07 (m) | - | 1.20–1.28 (m) | - |
| 3 | 3.26 (dd 12.0 and 3.6 Hz) | - | 4.28 (dd 9.3 and 5.1 Hz) | - |
| 4 | - | - | - | - |
| 5 | 0.80 (dd 11.4 and 5.1 Hz) | - | 1.68–1.76 (m) | - |
| 1.54–1.75 (m) | - | - | - | |
| 6 | - | - | - | - |
| 7 | 1.76–2.04 (m) | - | - | - |
| 8 | - | - | - | - |
| 9 | 1.54–1.76 (m) | - | 1.77–1.81 (m) | - |
| 10 | - | - | - | - |
| 11 | 1.82–1.94 (m) | - | 1.89–1.94 (m) | - |
| 12 | 5.48 (sl) | - | 5.46 (sl) | - |
| 13 | - | - | - | - |
| 14 | - | - | - | - |
| 15 | 2.11–2.20 (m) | - | - | - |
| 16 | 1.82–1.94 (m) | - | 1.89–1.94 (m) | - |
| 17 | - | - | - | - |
| 18 | 3.30 (dd 12.0 and 3.6 Hz) | - | 3.23–3.32 (m) | - |
| 19 | 1.82 (s) | - | - | - |
| 20 | - | - | - | - |
| 21 | 1.24–1.52 (m) | - | - | - |
| 22 | 1.76–2.04 (m) | - | - | - |
| 23 | - | - | 3.74 (t 9.6 Hz) | - |
| Me-23 | 1.19 (s) | - | - | - |
| Me-24 | 1.08 (s) | - | 1.05 (s) | - |
| Me-25 | 0.85 (s) | - | 0.92 (s) | - |
| Me-26 | 1.00 (s) | - | 1.00 (s) | - |
| Me-27 | 1.31 (s) | - | 1.23 (s) | - |
| 28 | - | - | - | - |
| Me-29 | 0.97 (s) | - | 0.92 (s) | - |
| Me-30 | 1.02 (s) | - | 1.01 (s) | - |
| 1′ (Ara) | 4.91 (d 5.7 Hz) | 4.92 (d 5.3 Hz) | 5.13 (d 6.3 Hz) | 5.12 (d 6.2 Hz) |
| 2′ (Ara) | 4.54–4.70 (m) | - | 4.58 (dd 6.3 and 7.2 Hz) | - |
| 3′ (Ara) | 4.26–4.38 (m) | - | 4.12–4.16 (m) | |
| 4′ (Ara) | 4.26–4.38 (m) and 4.65 (dd 3.6 and 9.9 Hz) | - | 4.19–4.22 (m) | - |
| 5′ (Ara) | 3.85 (dl 9.9 Hz) and 4.26–4.38 (m) | - | 3.74 (t 96 Hz) 4.20–4.34 (m) | - |
| 1′′ (Ram) | 6.16 (sl) | 6.10 (sl) | 6.23 (sl) | 6.22 (sl) |
| 2′′ (Ram) | 4.76 (sl) | - | 4.73–4.76 (m) | - |
| 3′′ (Ram) | 4.54–4.70 (m) | - | 4.65 (dd 9.4 and 3.3 Hz) | - |
| 4′′ (Ram) | 4.26–4.38 (m) | - | 4.31 (t 9.4 Hz) | - |
| 5′′ (Ram) | 4.54–4.70 (m) | - | 4.68–4.74 (m) | - |
| Me-6′′ (Ram) | 1.64 (d 6.3 Hz) | - | 1.64 (d 6.0 Hz) | - |
13C NMR spectroscopic data for S4 and S5
| 13C | S4 | 4a | S5 | 5b |
|---|---|---|---|---|
| δC | δC | |||
| 1 | 39.0 | 38.9 | 39.0 | 39.0 |
| 2 | 26.7 | 26.5 | 26.2 | 26.2 |
| 3 | 88.9 | 88.8 | 81.1 | 81.1 |
| 4 | 39.7 | 39.5 | 43.5 | 43.6 |
| 5 | 56.0 | 55.9 | 47.7 | 47.7 |
| 6 | 18.7 | 18.5 | 18.2 | 18.2 |
| 7 | 33.3 | 33.3 | 32.9 | 32.8 |
| 8 | 39.9 | 39.8 | 39.8 | 39.8 |
| 9 | 48.2 | 48.1 | 48.2 | 48.2 |
| 10 | 37.2 | 37.1 | 36.9 | 36.9 |
| 11 | 24.0 | 23.8 | 23.9 | 23.8 |
| 12 | 122.6 | 122.4 | 123.0 | 122.6 |
| 13 | 145.0 | 144.9 | 145.2 | 144.8 |
| 14 | 42.3 | 42.2 | 42.1 | 42.2 |
| 15 | 28.5 | 28.4 | 28.4 | 28.3 |
| 16 | 23.9 | 23.7 | 23.9 | 23.7 |
| 17 | 46.6 | 46.7 | 46.6 | 46.6 |
| 18 | 42.1 | 42.0 | 42.2 | 42.0 |
| 19 | 46.9 | 46.6 | 46.8 | 46.4 |
| 20 | 31.1 | 31.0 | 31.0 | 30.9 |
| 21 | 34.4 | 34.3 | 34.3 | 34.2 |
| 22 | 33.4 | 33.3 | 32.9 | 33.2 |
| 23 | - | - | 64.0 | 64.0 |
| Me-23 | 28.2 | 28.1 | - | - |
| Me-24 | 17.2 | 17.0 | 14.0 | 14.0 |
| Me-25 | 15.7 | 15.5 | 16.1 | 16.1 |
| Me-26 | 17.5 | 17.4 | 17.6 | 17.5 |
| Me-27 | 26.3 | 26.2 | 26.2 | 26.2 |
| 28 | 180.6 | 180.6 | 181.2 | 180.2 |
| Me-29 | 33.5 | 33.3 | 33.3 | 33.2 |
| Me-30 | 24.0 | 23.8 | 23.9 | 23.8 |
| 1′ (Ara) | 105.0 | 104.6 | 104.4 | 104.3 |
| 2′ (Ara) | 76.0 | 76.0 | 75.9 | 75.9 |
| 3′ (Ara) | 74.2 | 74.0 | 74.6 | 74.5 |
| 4′ (Ara) | 68.9 | 68.6 | 69.3 | 69.3 |
| 5′ (Ara) | 64.9 | 64.5 | 65.6 | 65.5 |
| 1′′ (Ram) | 101.9 | 101.7 | 101.7 | 101.7 |
| 2′′ (Ram) | 72.5 | 72.4 | 72.4 | 72.3 |
| 3′′ (Ram) | 72.7 | 72.6 | 72.6 | 72.5 |
| 4′′ (Ram) | 74.0 | 73.7 | 74.1 | 74.2 |
| 5′′ (Ram) | 70.0 | 69.9 | 69.8 | 69.8 |
| Me-6′′ (Ram) | 18.8 | 18.5 | 18.6 | 18.6 |
Oleanolic acid 3-O-[α-L-ramnopyranosyl-(1→2)-α-L-arabinopyranosyl] (S4): typical hydrogen signals from glycidic units such as arabinose were observed at δH 4.91 (d, J 5.7 Hz) (anomeric hydrogen H-1′), as well as raminose at δH 6.16 (sl) (anomeric hydrogen H-1′′), in addition to the characteristic signals of anomeric carbons for two sugar units of the arabinose type at δC 105.1 and raminose at δC 101.9. (Tables 4 and 5; Section S4, Figures S4A–S4C, Supplementary Material).
Hederagenin 3-O-[α-L-rhamnopyranosyl-(1→2)-α-L-arabinopyranosyl] (Pulsatilla A) (S5): typical hydrogen signals from glycidic units such as arabinose were observed at δH 5.13 (d, J 6.3 Hz) (anomeric hydrogen H-1′) and from raminose at δH 6.23 (sl) (anomeric hydrogen H-1′′), in addition to signals characteristic of anomeric carbons for two sugar units of the arabinose type at δC 104.4 and raminose at δC 101.7, and an oxymethylene carbon signal at δC 64.0 (Tables 4 and 5; Section S5, Figures S5A–S5C, Supplementary Material).
In summary, this phytochemical study provides new information on C. guianensis and the Carapa gender, revealing greater chemical diversity in the species. Triterpene saponins have previously been detected in C. procera and C. guianensis through preliminary tests [27, 28], but the present study provides the first structural identification of these metabolites in C. guianensis. The glycosides identified in the agro-industrial residues of C. guianensis have important biological characteristics such as: antiviral, antitumor and hepatoprotective [29, 30, 31, 32, 33]. Saponins with the aglycones hederagenin or oleanolic acid in their structures, such as those identified in this study, have antifungal activities due to their ability to bind to sterols in the fungal membrane, causing pore formation and loss of membrane integrity [34]. These promising biomolecules could be of interest to the pharmaceutical and cosmetics industries. The results of this study provide new perspectives for the reuse of C. guianensis industrial waste as a source of bioactive substances of industrial interest.
3.4. HPTLC fingerprint
The fingerprinting of the hot ethanolic extract (E9) and the commercial oil of C. guianensis (OA), using the substances isolated in this research (S1, S2, S3, S4 and S5) in duplicate via HPTLC, enabled a certain similarity to be observed between the chemical composition of OA and E9. This finding is supported by the observation of chromatographic bands suggestive of limonoids when derivatized with VSA, as observed for limonoids S1, S2, and S3 isolated from andiroba agro-industrial residue. This observation can be explained by the fact that the process of obtaining andiroba oil from the seeds of the species does not deplete the limonoid content, since substances of this class are still present in the residue. It was also possible to observe the presence of substances other than limonoids, which are absent in andiroba oil, such as triterpene saponins (S4 and S5), revealing the chemical potential of the agro-industrial residue of Carapa guianensis Aubl. (Figure 4).
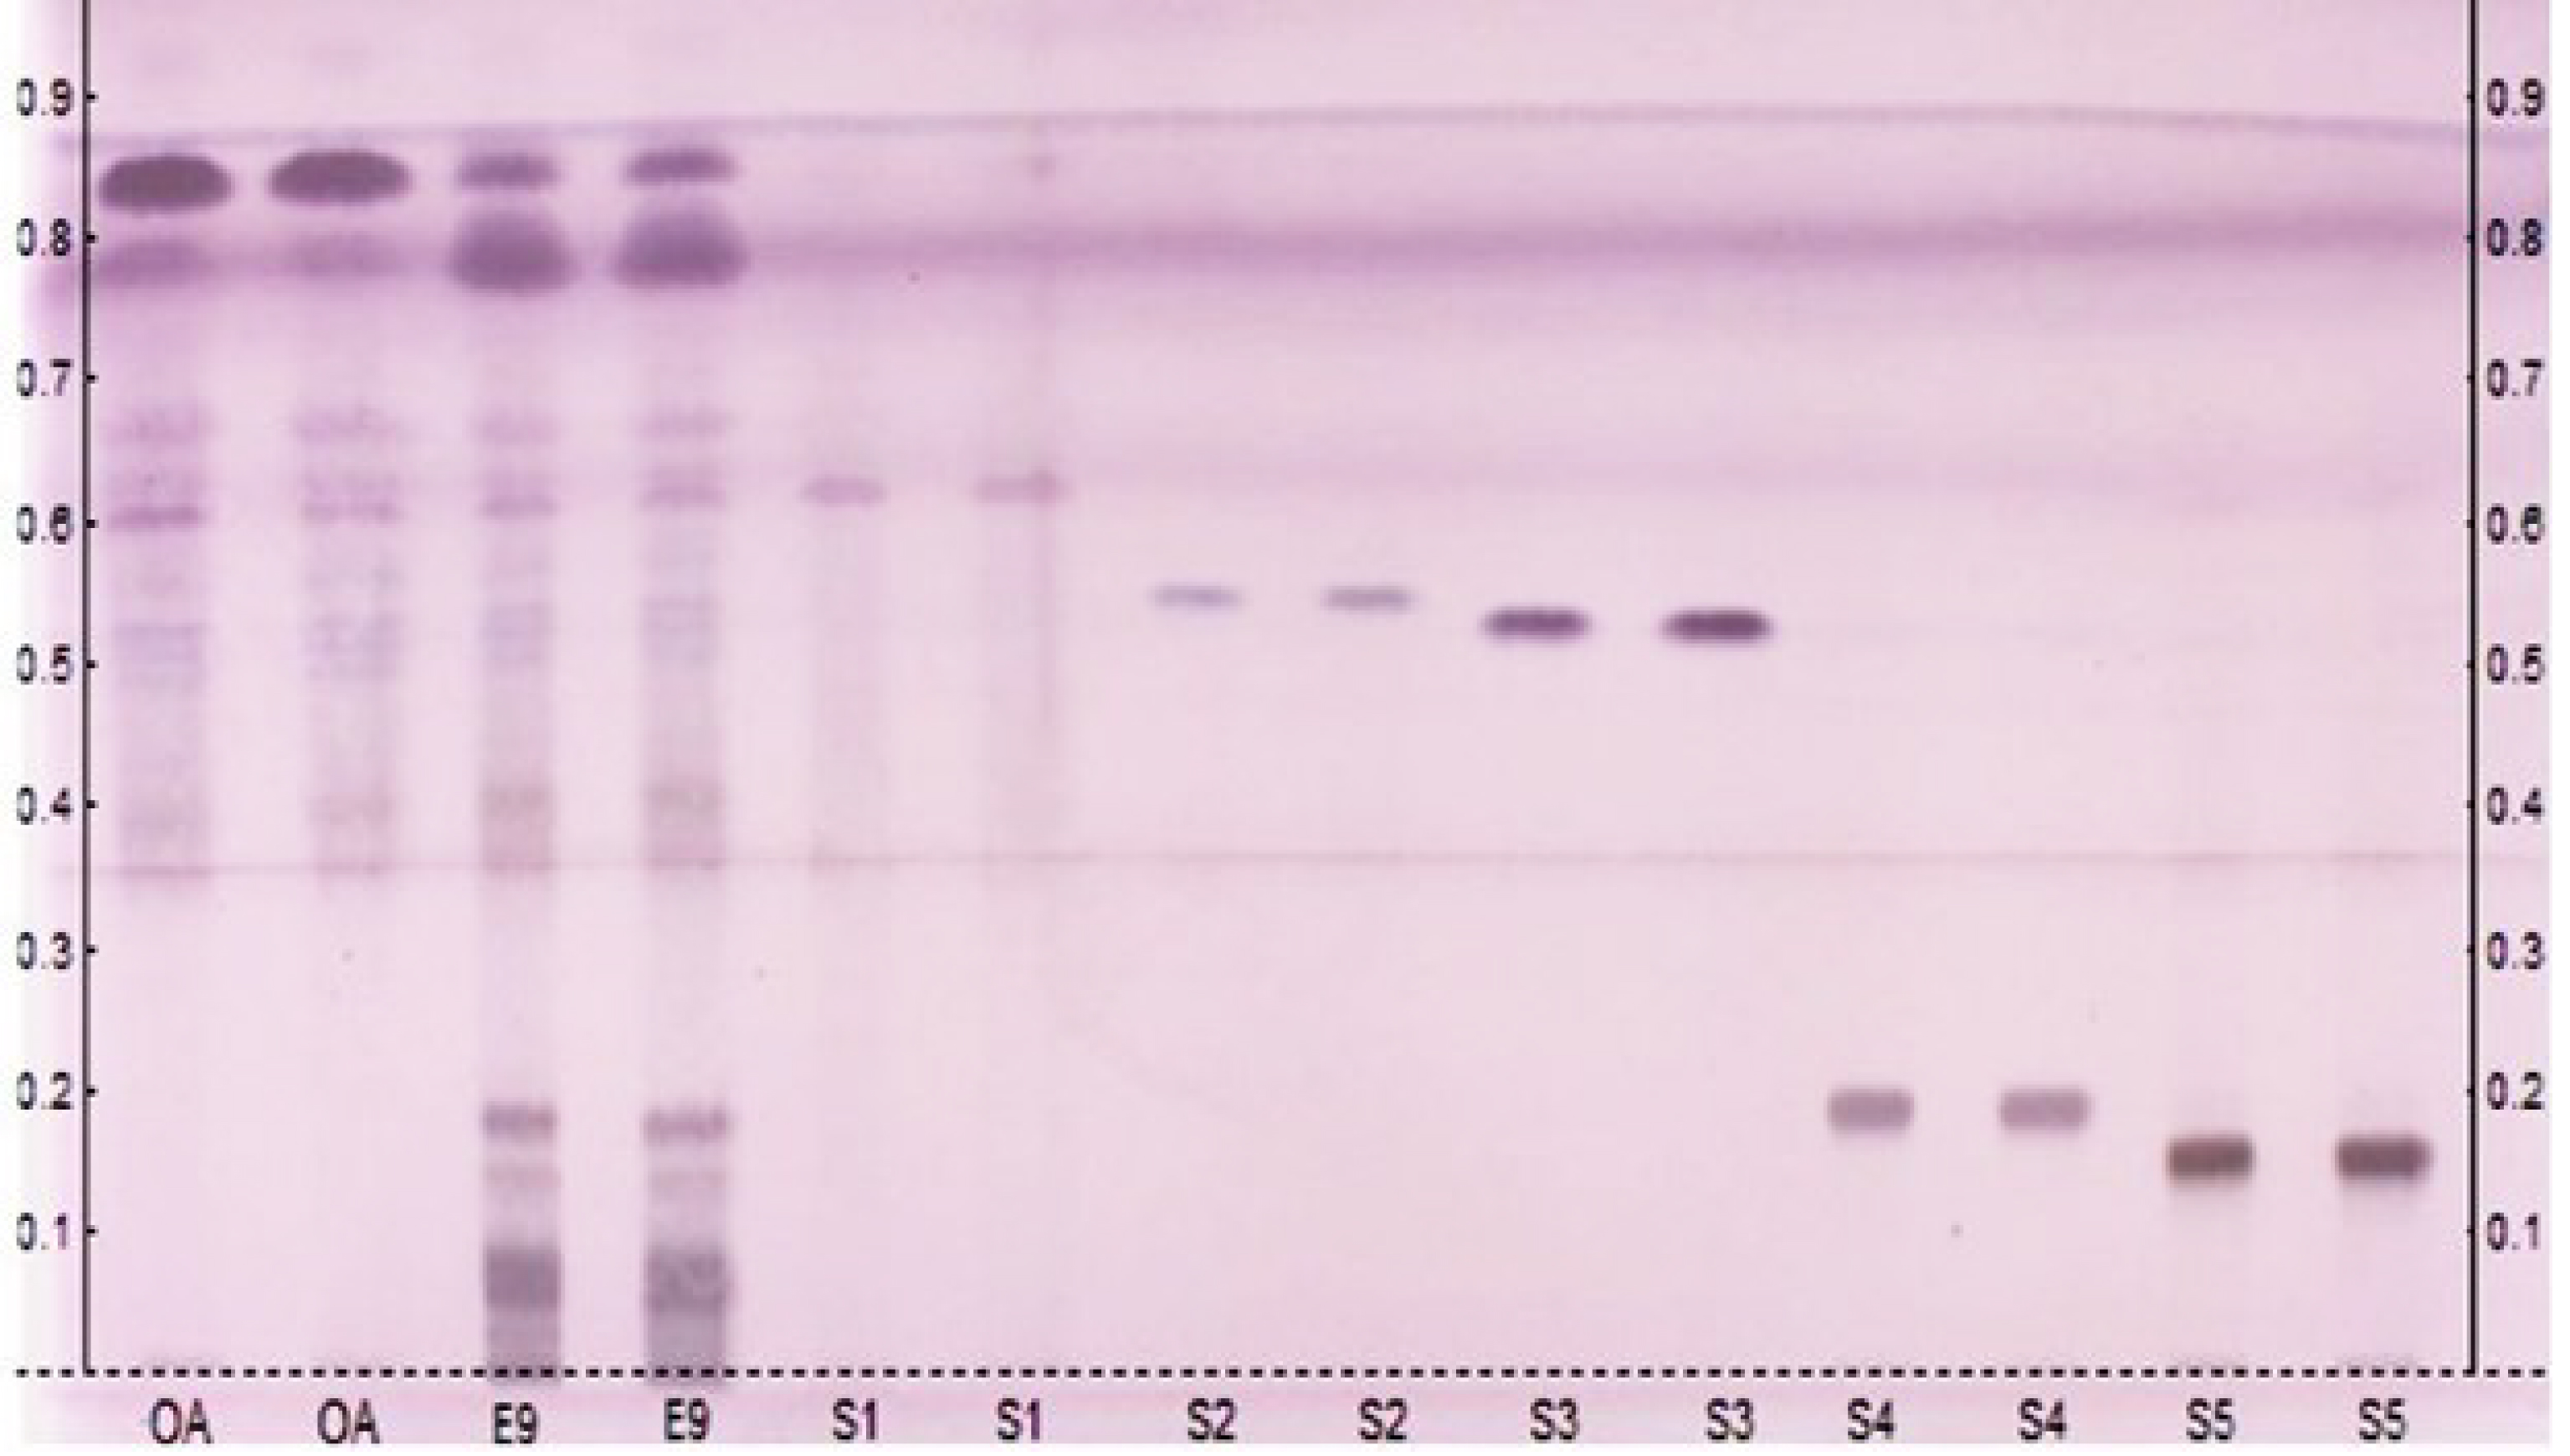
Fingerprint—andiroba oil (OA), hot ethanolic extract (E9) and isolated substances (S1, S2, S3, S4 and S5) in duplicate via HPTLC. Elution system, gradient mode: Hexane/AcOEt/MeOH (1% HCOOH). VSA derivatizer.
The results obtained in this study are relevant and promising, as they show that even after obtaining andiroba oil, the agro-industrial residue of C. guianensis still has a wealth of phytochemicals. This contributes to the phytochemical study of the species, as well as identifying the presence of substances of economic and pharmacological interest. This biomass can be used as an alternative in the search for bioproducts, thus adding value to the residue.
4. Conclusion
Bioprospecting of the agro-industrial residue of C. guianensis indicated that the most efficient extraction method was a warm extraction (Soxhlet—EtOH), with the highest percentage yield of 26.96% and the greatest diversity of secondary metabolites. NMR analysis and comparison with data from the literature allowed us to identify 5 compounds present in the agro-industrial residue of C. guianensis, 3 of which are limonoids (S1, S2 and S3—gedunin, 6α-acetoxygedunin and 7-desacetoxy-7-oxogedunin, respectively), important bioactive compounds that have actions: antinociceptive, anti-inflammatory, antitumor, hepatoprotective, etc. In addition, we discovered classes of substances unknown in the Carapa genus until this study, such as the triterpene saponins (S4: 3-O-[α-L-arabinopyranoside-α-L-ramnopyranoside-(1→2)] oleanolic acid and S5: 3-O-[α-L-arabinopyranoside-α-L-ramnopyranoside-(1→2)] hederagenin (Pulsatilla A)), glycosides with antiviral, antitumor, and hepatoprotective properties. The HPTLC fingerprint of the hot ethanolic extract (E9) and the commercial oil of C. guianensis, using the substances isolated in this research (S1, S2, S3, S4 and S5), although qualitative, shows that E9 has lower concentrations of limonoid components than andiroba oil. However, it is worth noting that there are chemical substances present in the extract studied that are absent in andiroba oil, such as substances S4 and S5. In this way, the research showed that even after obtaining andiroba oil, the agro-industrial residue generated still has a wealth of phytochemicals, biomass that can be used as an alternative in the search for bioproducts.
Declaration of interests
The authors do not work for, advise, own shares in, or receive funds from any organization that could benefit from this article, and have declared no affiliations other than their research organizations.
Supplementary data
Supporting information for this article is available on the journal’s website under https://doi.org/10.5802/crchim.399 or from the author.