


 CC-BY 4.0
1. Introduction
Textile engineers can design fabrics with electromagnetic shielding properties, which are particularly valuable in aerospace, military, and medical applications. Electrically conductive fabrics offer excellent electromagnetic interference (EMI) shielding capabilities, making them suitable for a wide range of uses [1]. Krishnasamy et al. [2] have developed and characterized various EMI shielding materials, including textiles, designed to protect against radio waves, radar signals, and other forms of electromagnetic energy. Rubežienė et al. [3] demonstrated that the distribution and thickness of poly (3,4-ethylenedioxythiophene) (PEDOT) coatings significantly influence the shielding effectiveness (SE) of textiles. These fabrics represent a promising approach to electromagnetic shielding, with a clear correlation established between their electrostatic properties and shielding performance. Patel et al. [4] provide a comprehensive analysis of recent advancements in photocatalytic, super-hydrophobic, and EMI shielding textile treatments using nanomaterials. While these developments offer significant advantages for both users and manufacturers, it is crucial to address the challenges and limitations associated with the integration of nanomaterials. The SE of treated fabrics depends on the fabric’s geometry and the quantity of metal present. Such textiles can be used as protective workwear to shield individuals from electromagnetic radiation or as covers to block electromagnetic fields [5]. Recent research has focused on innovative strategies, primarily based on passive textile designs, to enhance thermal conductivity [6]. Shukla et al. [7] optimized the thickness of a carbon layer to develop a porous Fe3O4/C shell, achieving an electromagnetic wave attenuation of 38.8 dB at a thickness of 2.1 mm. Guo et al. [8] successfully created novel graphene-based foams that are remarkably lightweight (0.011 g/cm3) and exhibit exceptional electromagnetic wave attenuation capabilities. These foams demonstrate an average attenuation of 37.2 dB with a graphene loading of just 0.105%, highlighting their impressive SE.
According to Liu et al. [9], increasing the content of functional particles (such as graphite, graphene, and silver-coated copper powder) up to 60% within the frequency range of 0.01–3.0 GHz optimizes the shielding properties of the coating. However, exceeding this threshold may degrade absorption capabilities due to the formation of conductive structures that alter the material’s dielectric properties. The resulting graphene nanosheet (GNS)/water-based polyurethane (WPU) composites exhibit exceptional EMI shielding performance, achieving approximately 32 dB while maintaining flexibility and lightweight characteristics. Notably, these composites demonstrate high electrical conductivity, reaching 5.1 S/m at a low GNS content of 5% by volume (approximately 7.7% by weight) [10].
Sol–gel and in situ polymerization are the most commonly employed methods for ferrite fabrication. Polyaniline (PANI) nanocomposites, created by combining ferrite nanoparticles with PANI, show promising properties for EMI shielding [11]. Avloni et al. [12] demonstrated that fabrics coated with polypyrrole (PPy) provide effective electromagnetic shielding (37 dB), comparable to other conductive polymers. These fabrics allow precise tuning of surface resistivity, enabling control over their SE. Akif Kaynak’s research [13] further underscores the excellent electromagnetic shielding capabilities of PPy-coated textiles. These findings highlight that conductive textiles based on polymers are lightweight, high-performance shielding materials, opening new opportunities in this field.
Graphene-based composites are also widely used in biological applications, including tissue engineering, drug and gene delivery, and bioimaging. Table 1 summarizes the remarkable properties and diverse applications of various graphene-based composites in tissue engineering.
Properties and diverse applications of various graphene-based composites in tissue engineering
| Composite | Production | Effects | Applications | Ref. |
|---|---|---|---|---|
| PLA/GO | Fused deposition modeling | Increase mechanical properties, benefit cell proliferation | Tissue engineering | [14] |
| PLA/PU | - | Remarkable improvement in antibacterial capacity | Tissue engineering | [15] |
| TCP/PLA | - | Showing swelling profile, improved biomineralization capacity, and alkaline phosphatase (ALP) activity | Tissue engineering | [16] |
| PE/rGO | - | High mechanical strength, thermal stability, electrical property, and antibacterial capacity | Tissue engineering | [17] |
| Gr-ZnO | Depositing zinc oxide on graphene nanosheet surfaces | Exhibit superior antimicrobial effects | Tissue engineering | [18, 19] |
The table highlights the potential of graphene in tissue engineering by combining it with other materials to create composites with enhanced mechanical properties, antibacterial characteristics, and improved biomineralization capacity, among other benefits. These attributes are particularly relevant for developing materials designed to interact with living tissues, such as implants or scaffolds for tissue regeneration [20].
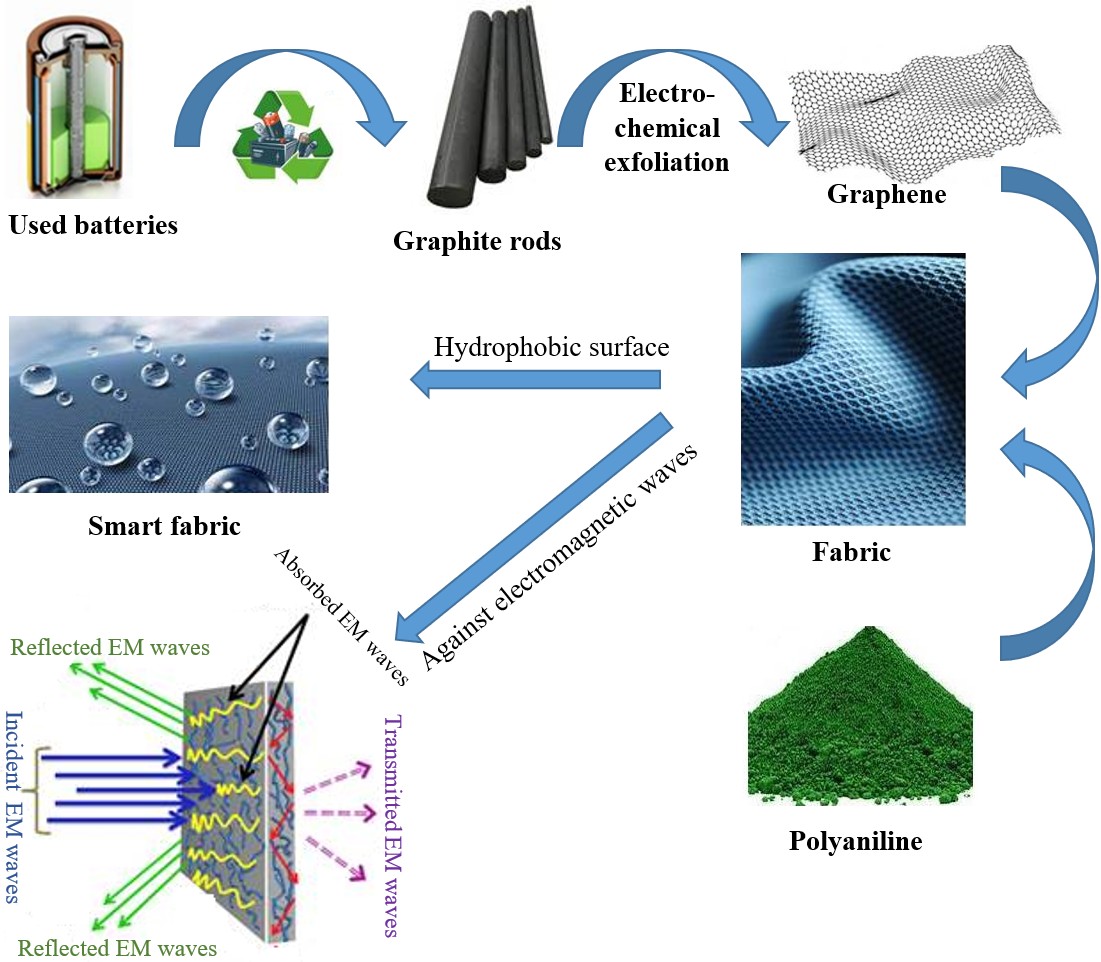
The primary objective of our work is to develop high-performance smart textiles specifically designed to provide enhanced protection for humans against the harmful effects of electromagnetic waves. To achieve this, we have developed an innovative process for functionalizing fabrics using nanomaterials, particularly graphene obtained through the electrochemical exfoliation of recycled graphite from spent batteries. Simultaneously, we synthesized a conductive polymer, polyaniline, using a novel alternative oxidant, hydrogen peroxide. By integrating these two nanomaterials into textile fibers, we have created composite materials that exhibit excellent electrical conductivity and significant electromagnetic shielding capabilities, particularly within the 8–9 GHz frequency range.
2. Experimental
2.1. Preparation of graphene
We employed an electrochemical method to exfoliate graphite rods into graphene using a sulfuric acid electrolyte. In this study, electrochemical exfoliation was carried out using graphite rods sourced from electrical battery units, which served as the electrodes, along with a container filled with a mixture of H2SO4 and H2O as the electrolyte. This process yielded high-performance, large-area thin graphene sheets. The presence of graphene in the synthesized material was confirmed using advanced characterization techniques, including Raman spectroscopy, scanning electron microscopy (SEM), X-ray diffraction (XRD), BET (Brunauer–Emmett–Teller) surface area analysis, Fourier transform infrared spectroscopy (FT-IR), and X-ray fluorescence analysis (XRF) [21, 22, 23].
3. Preparation of polyaniline
The standard method for preparing polyaniline (PANI) involves the chemical polymerization of aniline in an acidic environment, using an oxidant as a catalyst. This process results in the formation of a polymeric chain composed of repeating aniline units, which can exist in various oxidation states depending on the synthesis conditions. The production protocols for PANI vary based on factors such as operating conditions, including temperature and pH of the reaction medium [24]. Table 2 summarizes the different PANI synthesis protocols.
Production protocol for PANI
| Composite name | Preparation method | Properties | Application | Ref. |
|---|---|---|---|---|
| PANI/graphite | In situ chemical oxidative polymerization | Increased thermal stability | Antistatic coating | [25] |
| PANI/exfoliated graphene | In situ chemical oxidative polymerization | Better cyclic stability | Supercapacitor and sodium battery cathode | [26] |
| PANI/magnetic graphene | Hydrothermal method | High sensitivity | Biosensors | [27] |
| PANI/graphene oxide | Precipitation polymerization | Good selectivity | Electrochemical sensor | [28] |
| PANI/reduced graphene oxide | In-situ interfacial polymerization method | Excellent mechanical properties | Anticorrosion, antistatic, and antibacterial applications | [29] |
| Graphene oxide/PANI manganese oxide | In situ chemical oxidative polymerization | Synergic behavior of PANI | Adsorbent application | [30] |
| SnO2/reduced graphene oxide/PANI | In situ chemical oxidative polymerization | Improved chemical stability | Ammonia gas sensing | [31] |
| PANI/graphene obtained by recycling graphite from spent batteries | In situ chemical oxidative with H2O2 polymerization | Good screen against EMI | Continuous dyeing for intelligent fabrics | This work |
The synthesis protocol for PANI comprised three essential steps:
3.1. Pretreatment of monomer (aniline)
To prevent side reactions and enhance polymerization yield, aniline (analytical grade, Merck) was purified using vacuum distillation. The purified aniline was then stored in a cool, dark environment.
3.2. Protonation of aniline monomer
As PANI is a base-conjugated semiconductor, the dopant plays a critical role during polymerization. To initiate the reaction, 50 mL of hydrochloric acid (HCl, 37%) was added dropwise to purified aniline under continuous mechanical stirring for one hour. This step facilitates the cleavage of N–H and N–C bonds in aniline, enabling the attachment of protons (H+) to nitrogen atoms, which act as polymerization initiators in the presence of an oxidant.
3.3. Polymerization
Following protonation, polymerization was initiated by slowly adding hydrogen peroxide (H2O2) as the oxidant dropwise over 4–6 h. The oxidant-to-monomer ratio ([H2O2]/[aniline]) was maintained at 1.15, and the reaction temperature was held at −5 °C. The resulting dark green PANI powder was filtered under vacuum, washed sequentially with 0.1 N HCl, methanol, and deionized water, and dried in an oven at 60 °C for 24 h.
4. Continuous dyeing process
Two dispersions were prepared:
(G) Graphene dispersion: 1 g of graphene was dispersed in 100 mL of distilled water and sonicated for 1 h; (PANI) Polyaniline dispersion: 1 g of PANI was dispersed in 100 mL of acetic acid and sonicated for 1 h. Both dispersions were simultaneously applied to a plain-weave cotton fabric (properties listed in Table 3), yielding three samples:
T/G: Fabric coated with graphene.
T/PANI: Fabric coated with polyaniline.
T/G/PANI: Fabric coated with graphene and polyaniline.
Characteristics of the cotton fabric
| Characteristic | Weave structure | Warp and weft density | Thread count | Weight | Hand feel |
|---|---|---|---|---|---|
| Value | Plain-weave | 100 threads per inch (TPI) | Approximately 60 threads per inch | Approximately 150 g/m2 | Soft |
4.1. Conductivity measurement
To measure conductivity, a PANI sample was prepared as a film or pellet. Two electrodes were connected to the sample, and a voltage was applied across it. The conductivity (𝜎) of the sample was calculated using the formula:
| \begin {equation*} \sigma = 1/\rho \times t/A \end {equation*} |
The conductivity of PANI can vary significantly depending on factors such as the synthesis method, doping level, and sample purity. The conductivity of various materials is summarized in Table 4.
Conductivity of various materials
| Material | Conductivity (S⋅cm−1) | Ref. |
|---|---|---|
| Silver, gold, iron | ∼105 | [32] |
| Silicon, germanium | ∼101 | |
| Doped polyaniline | ∼101 | |
| Undoped polyaniline | ∼10−8 | |
| Nylon | ∼10−14 | |
| PANI | 4.7 × 10⁻¹ | This work |
4.2. Structural characterization by FT-IR
During FT-IR analysis, PANI is exposed to infrared radiation, which causes the polymer’s chemical bonds to absorb specific wavelengths of the radiation. The resulting spectrum reveals absorption frequencies that correspond to vibrational modes of functional groups within PANI. These vibrational modes are compared to standard reference bands to identify functional groups and confirm their presence in the polymer structure. The FT-IR spectrum of the as-synthesized PANI is shown in Figure 1. A quinoid-ring stretching vibration appears as a band at about 1560 cm−1, and the peak around 1325 cm−1 is attributed to the C–N stretching vibration between the benzenoid and quinoid units [33]. The band at 1475 cm−1 is due to the C–C stretching vibration in the benzene ring. Another peak appears around 1290 cm−1, associated with the delocalization of π-electrons due to protonation or C–N stretching vibration, while a high absorption band near 1246 cm−1 is observed due to the deformation of the polaron structure from the C–N stretching mode [34, 35]. The band between 1145 and 1601 cm−1 corresponds to in-plane C–H bending (N=Q=N and B–NH+–B where Q = NH+–B and B represents the aromatic ring) resulting from protonation [36]. Researchers refer to this as the “electronic-like band”, indicating electron delocalization in PANI [37].
Fourier transform infrared (FTIR) spectrum of the conducting polyaniline (PANI).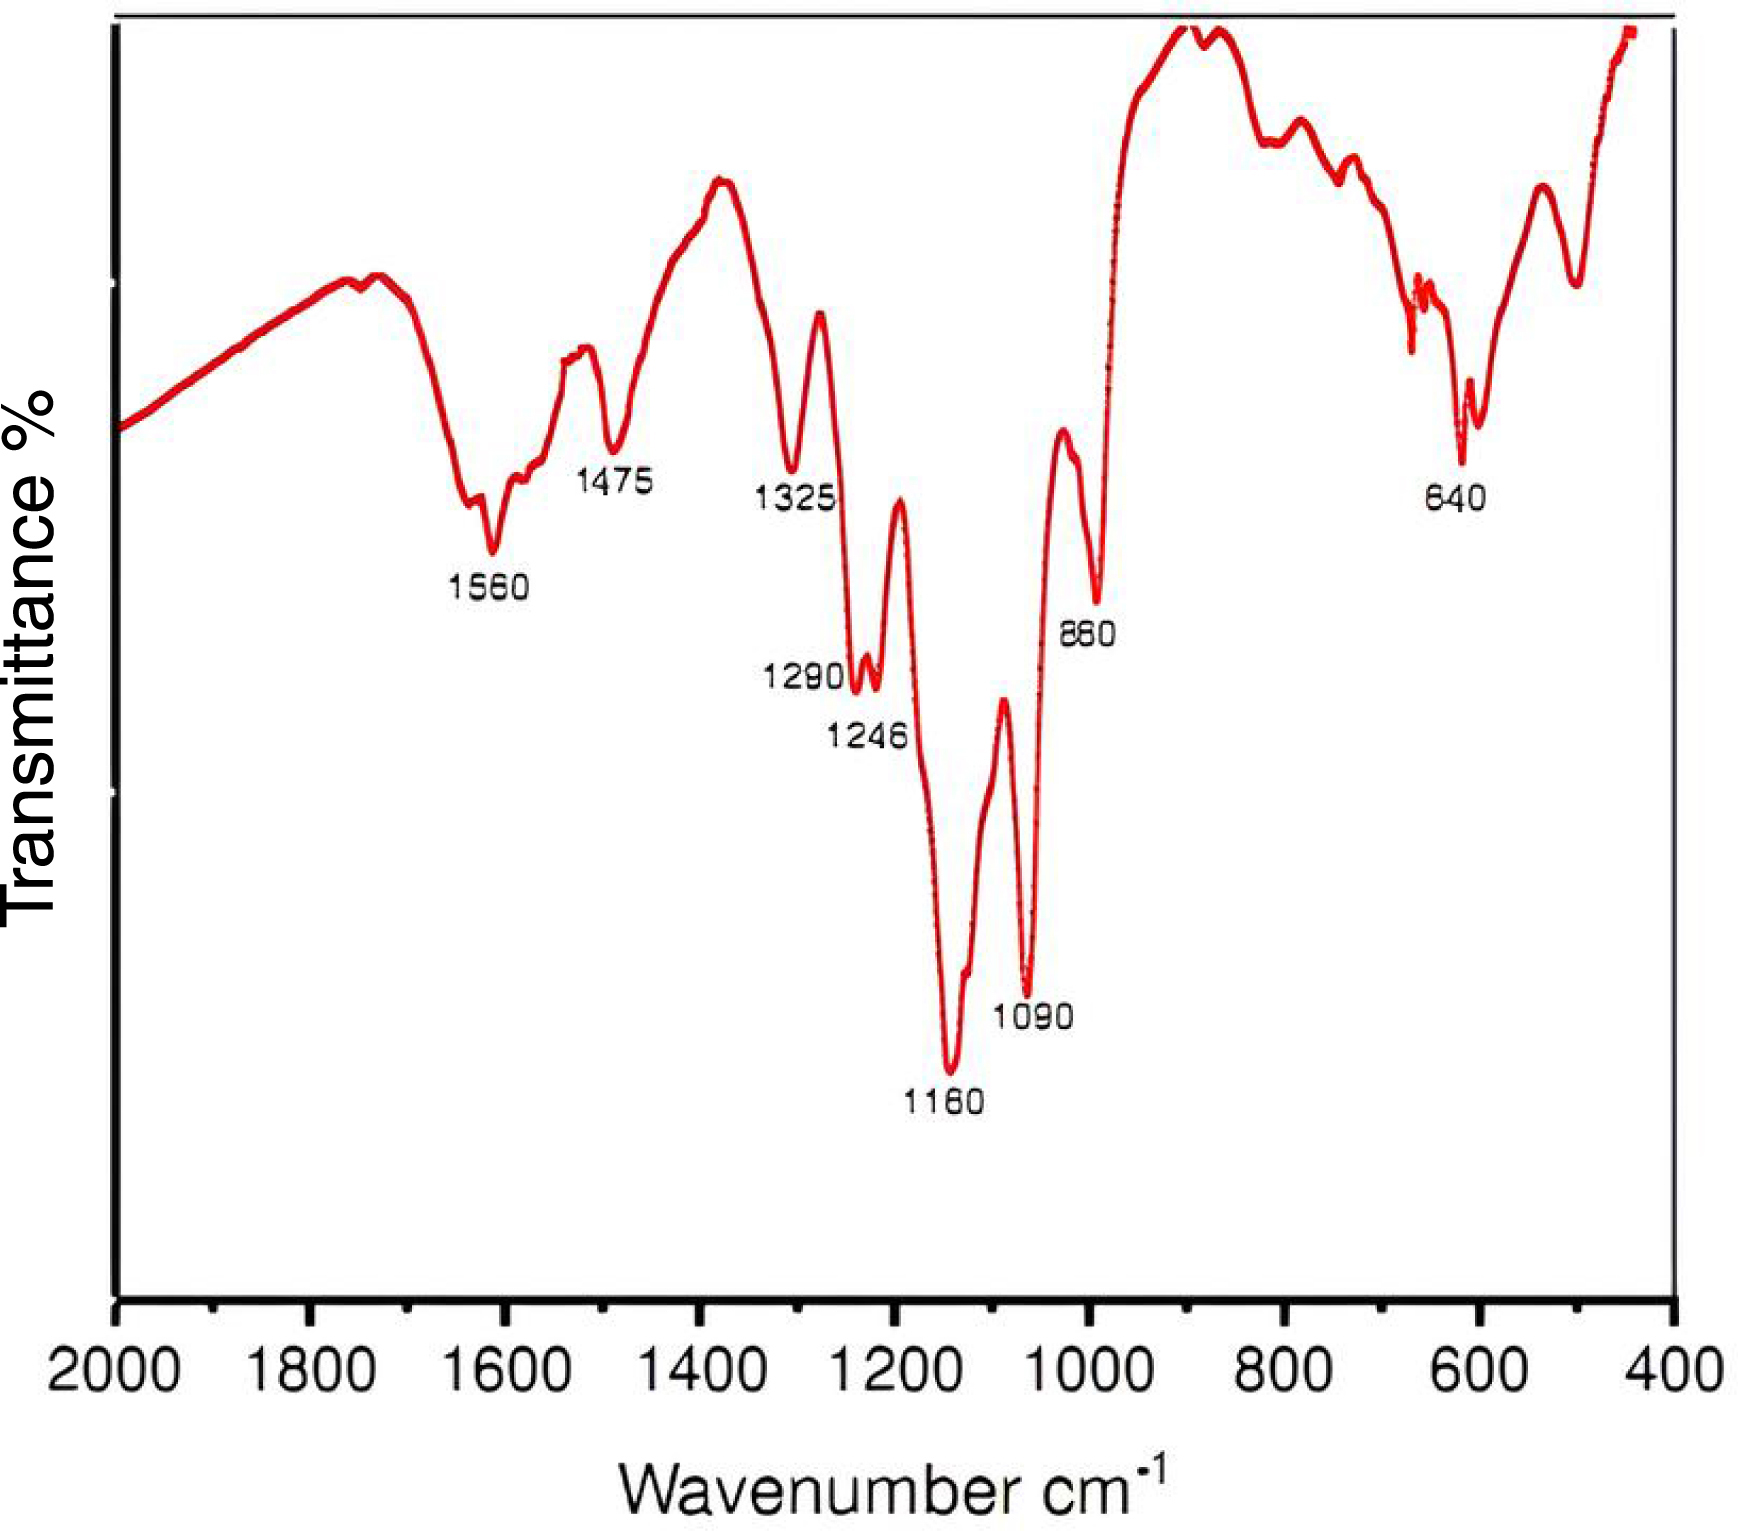
In addition, the peak at 1090 cm−1 is attributed to the in-plane bending of aromatic C–H in the 1,4-disubstituted aromatic ring [38]. Researchers have identified the band at 860 cm−1 as the out-of-plane bending vibration mode of C–H, as previously discussed for single-walled carbon nanotubes (SWCNTs) [39]. The band at 640 cm−1 corresponds to the S–O stretching vibration of sulfonate substituents in aromatic rings, indicating that PANI nanotubes have been doped [40]. The characteristic bands are consistent for all PANI salts, confirming the presence of the emeraldine salt phase in each compound [41]. The differences in the intensities of the 1350–1000 cm−1 peaks among the PANI salts can be explained by the different degrees of protonation [42].
4.3. Contact angle measurement
Contact angle measurements are used to characterize the hydrophilic/hydrophobic nature of a material, enabling the evaluation of the influence of nanofillers on the wetting properties of the fabric [43, 44]. This technique involves depositing a liquid droplet onto the fabric and measuring the angle formed between the tangent to the droplet surface and the solid surface at any point during the process. This angle, known as the contact angle or sessile angle, describes the interaction between the liquid, solid, and air [45]. We characterized the shape of the droplets at equilibrium on our substrates using the sessile-drop method and imaging software (Figure 2).
Contact angle degrees: (T) fabric 66.749°, (T/PANI) fabric coated with polyaniline 137.643°, (T/G/PANI) fabric coated with graphene and polyaniline 108.635°.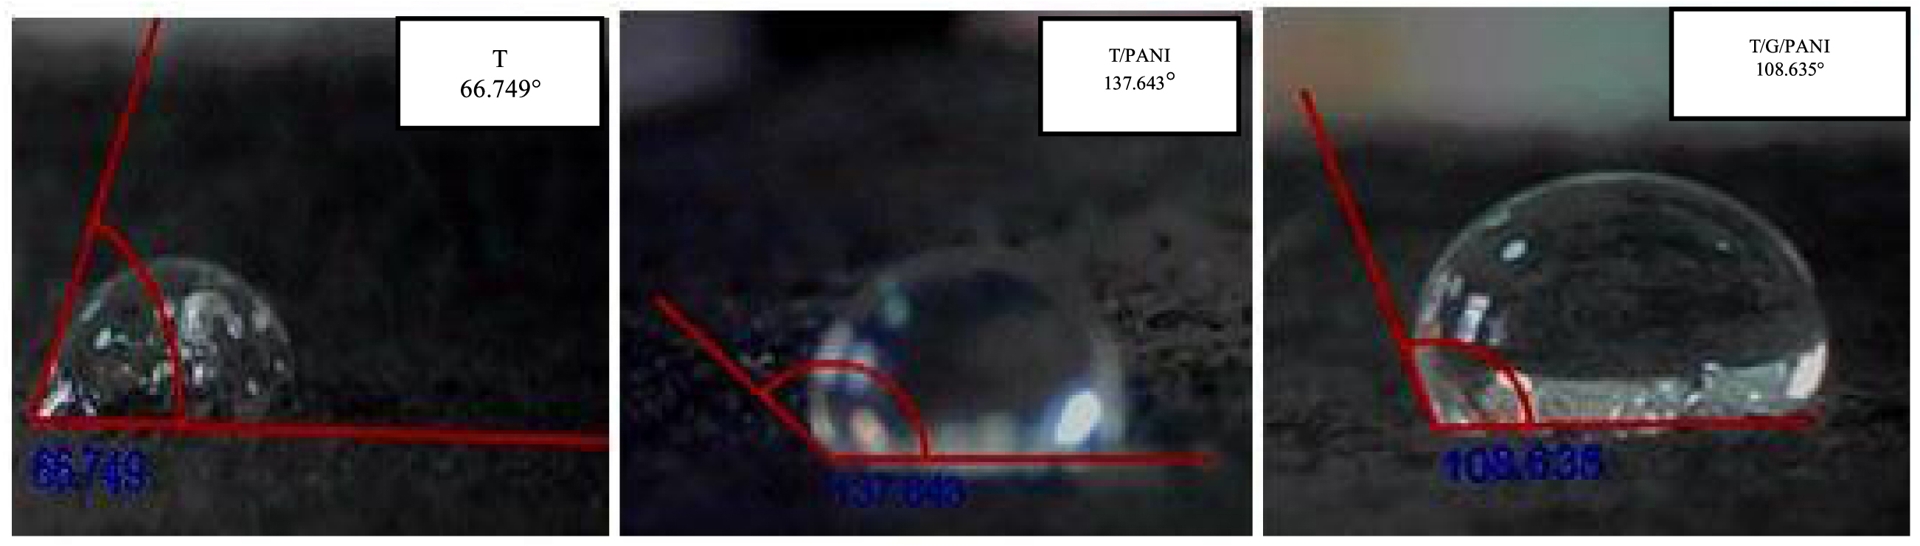
The researchers used these measurements to determine whether the modified fabric exhibited hydrophilic or hydrophobic properties. The contact angles of the samples are summarized in Table 5.
Contact angles of our samples
| Fabric type | Contact angle | Interval of young | Nature of sample |
|---|---|---|---|
| T | 66.749 | α < 90 | Hydrophilic |
| T/PANI | 137.643 | 90 < α < 150 | Hydrophobic |
| T/G/PANI | 108.635 | 90 < α < 150 | Hydrophobic |
Our observation was that the contact angle increased with the conductivity of the coating filler, indicating a trend toward a more hydrophobic surface. This shift toward hydrophobicity suggests a change in the surface’s polar characteristics. Generally, hydrophilic surfaces (low contact angles) are more polar, exhibiting stronger interactions with polar liquids like water through hydrogen bonding and dipole–dipole interactions. Conversely, hydrophobic surfaces (high contact angles) are typically less polar, with weaker interactions with water, favoring interactions through London dispersion forces. Therefore, our finding that higher conductivity fillers led to higher contact angles implies that these fillers, when integrated into the fabric, resulted in a less polar surface. This could be attributed to the nature of the conductive materials used—graphene and polyaniline—which, in their deposited form, present a less polar surface compared to the untreated fabric.
5. Shielding effectiveness
A network analyzer is an instrument used to characterize devices in microwave circuits, such as amplifiers, attenuators (both fixed and variable), and cables, among others. It integrates the system and evaluates its impact on signal transmission or reception. This instrument enables the quantification of the S-parameters (short for scattering parameters). These parameters provide critical information, including power, gain and/or attenuation, return loss, and impedance. The rectangular waveguide, based on a quadrupole structure, is a technique used to determine key parameters such as the reflection coefficient and transmission coefficient using a network analyzer. To measure the electromagnetic shielding effectiveness (SE), we placed fabric samples into the waveguide support of a Keysight N5222A vector network analyzer, as illustrated in Figure 3.
(a) Sample holder; (b) Fabrics (4 cm2); (c) Waveguide holder; (d) Vector network analyzer.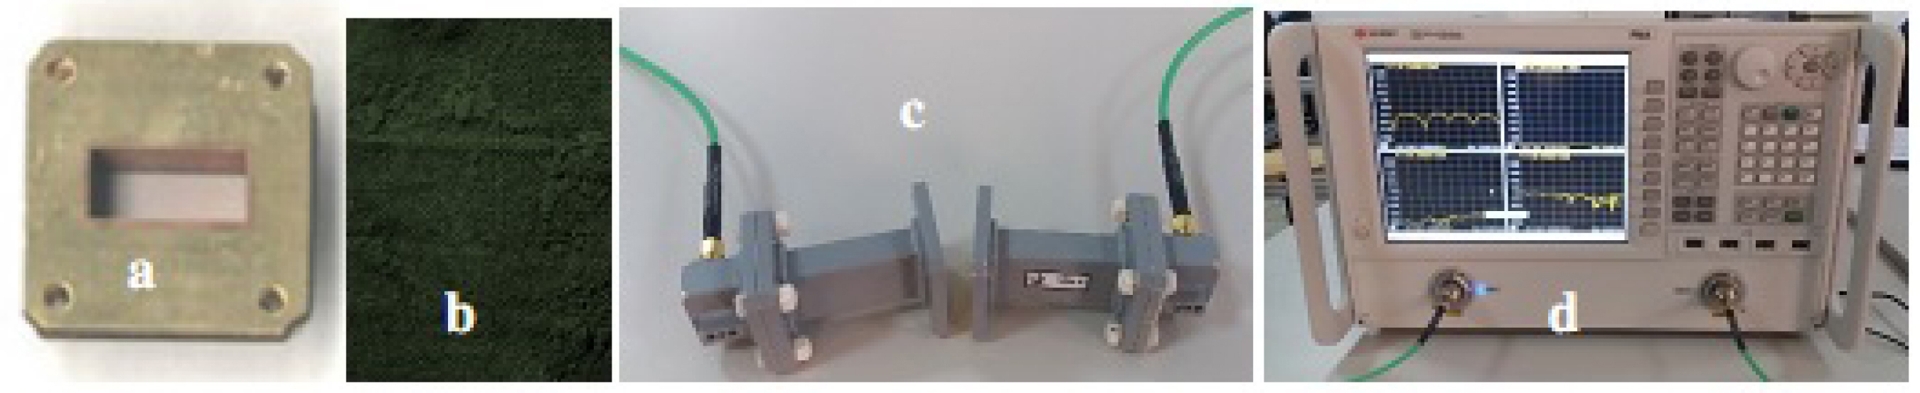
The SE experiments were conducted within the frequency range of 8–9 GHz, which is commonly used in both military and civilian communications. Using a two-port vector network analyzer, the S-parameters were measured and analyzed. These parameters are defined as: S11 = b1/a1 (reflection coefficient), S21 = b2/a1 (transmission coefficient), where a and b represent the normalized incident and reflected waves, respectively. The process involves measuring the reflected signal (S11) and the transmitted signal (S21), as well as calculating the absorbance using the following equations:
| \begin {eqnarray} \mbox {Transmittance }T &=& | S_{21}|^2 \label {eq1}\end {eqnarray} | (1) |
| \begin {eqnarray} \mbox {Reflection }R &=& | S_{11}|^2 \label {eq2}\end {eqnarray} | (2) |
| \begin {eqnarray} \mbox {Absorbance }A &=& 1-R -T \label {eq3}\end {eqnarray} | (3) |
| \begin {eqnarray} \mbox {SER }&=& 10{\cdot }\log _{10}(1-R) \label {eq4}\end {eqnarray} | (4) |
| \begin {eqnarray} \mbox {SEA }&=& 10{\cdot }\log _{10}|T/(1-R)| \label {eq5}\end {eqnarray} | (5) |
| \begin {eqnarray} \mbox {SE }&=& \mbox {SER} + \mbox {SEA} \label {eq6} \end {eqnarray} | (6) |
We calculate the SEA and the SER of each sample by measuring the S11 and S21 parameters of our various samples using a vector network analyzer. Figures 4 and 5 present the results of the SE measurements, illustrating the variation in the effectiveness of the shielding for reflection SER and absorption SEA. It is evident from the plots that the SEA and SER values exhibit a proportional relationship with the frequency at low frequencies, as well as with the type of nanofiller added. Furthermore, the addition of conductive nanofillers primarily contributes to the increases in SEA and SER. The purpose of these tests was to evaluate the electromagnetic SE and obtain values for S-parameters S11 (reflected incident) and S21 (transmitted incident). These findings indicate that the SE of the composite fabrics increases with a higher surface conductive charge. For instance, a fabric coated with graphene displayed S21 and S11 (S-parameters) values of 5.2 and 10.95 dB, respectively, compared to 9.2 and 7.24 dB for a PANI-coated fabric. On the other hand, a fabric coated with both PANI and graphene displayed S21 and S11 values of 11.9 and 10.24 dB, respectively. The increase in conductive loading also led to an increase in the S21 transmission parameter from 3.15 dB (fabric) to 5.2 dB (graphene-coated fabric), 9.2 dB (PANI-coated fabric), and 11.9 dB (T/G/PANI). In addition, the S11 reflection parameter increased from 5.2 dB (fabric) to 10.24 dB (graphene and PANI-coated fabric). The S-parameters of different fabrics are summarized in Table 6.
Shielding effectiveness for reflection (SER) in the 8–9 GHz range.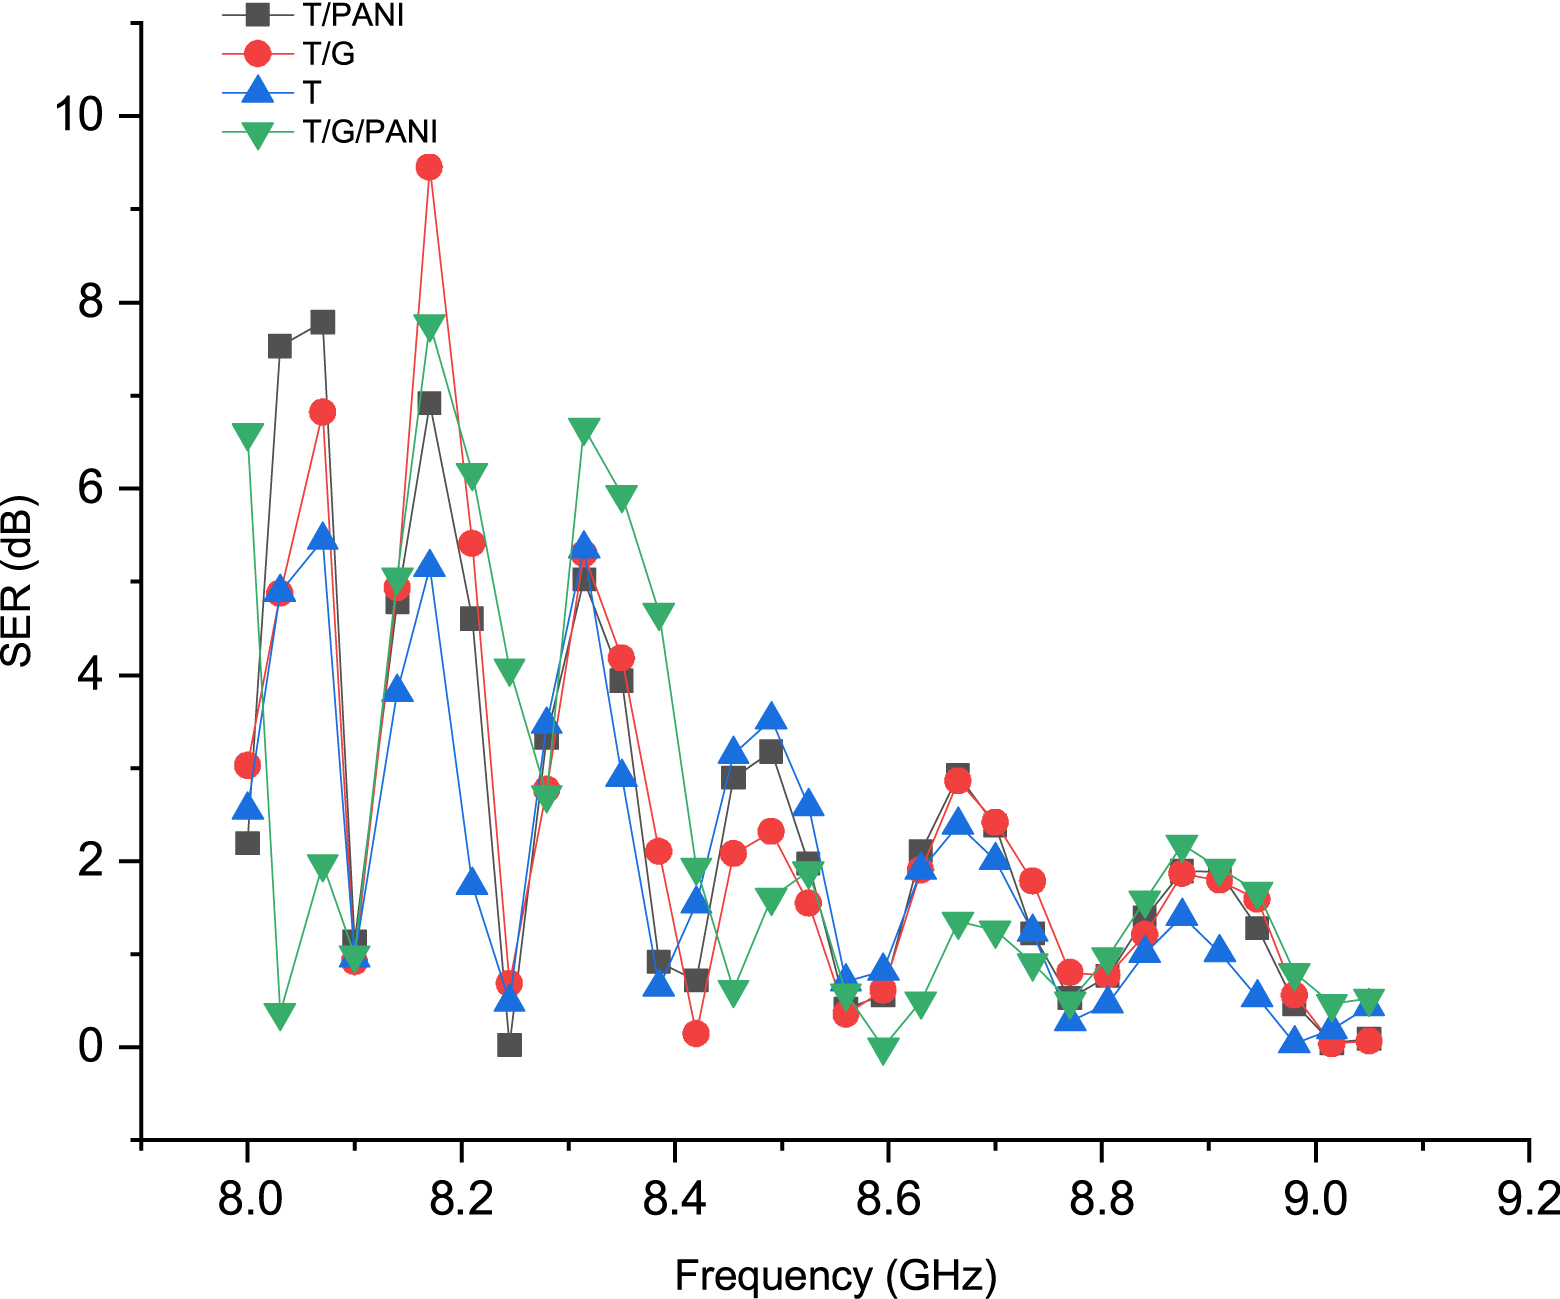
Shielding effectiveness for absorption (SEA) in the 8–9 GHz range.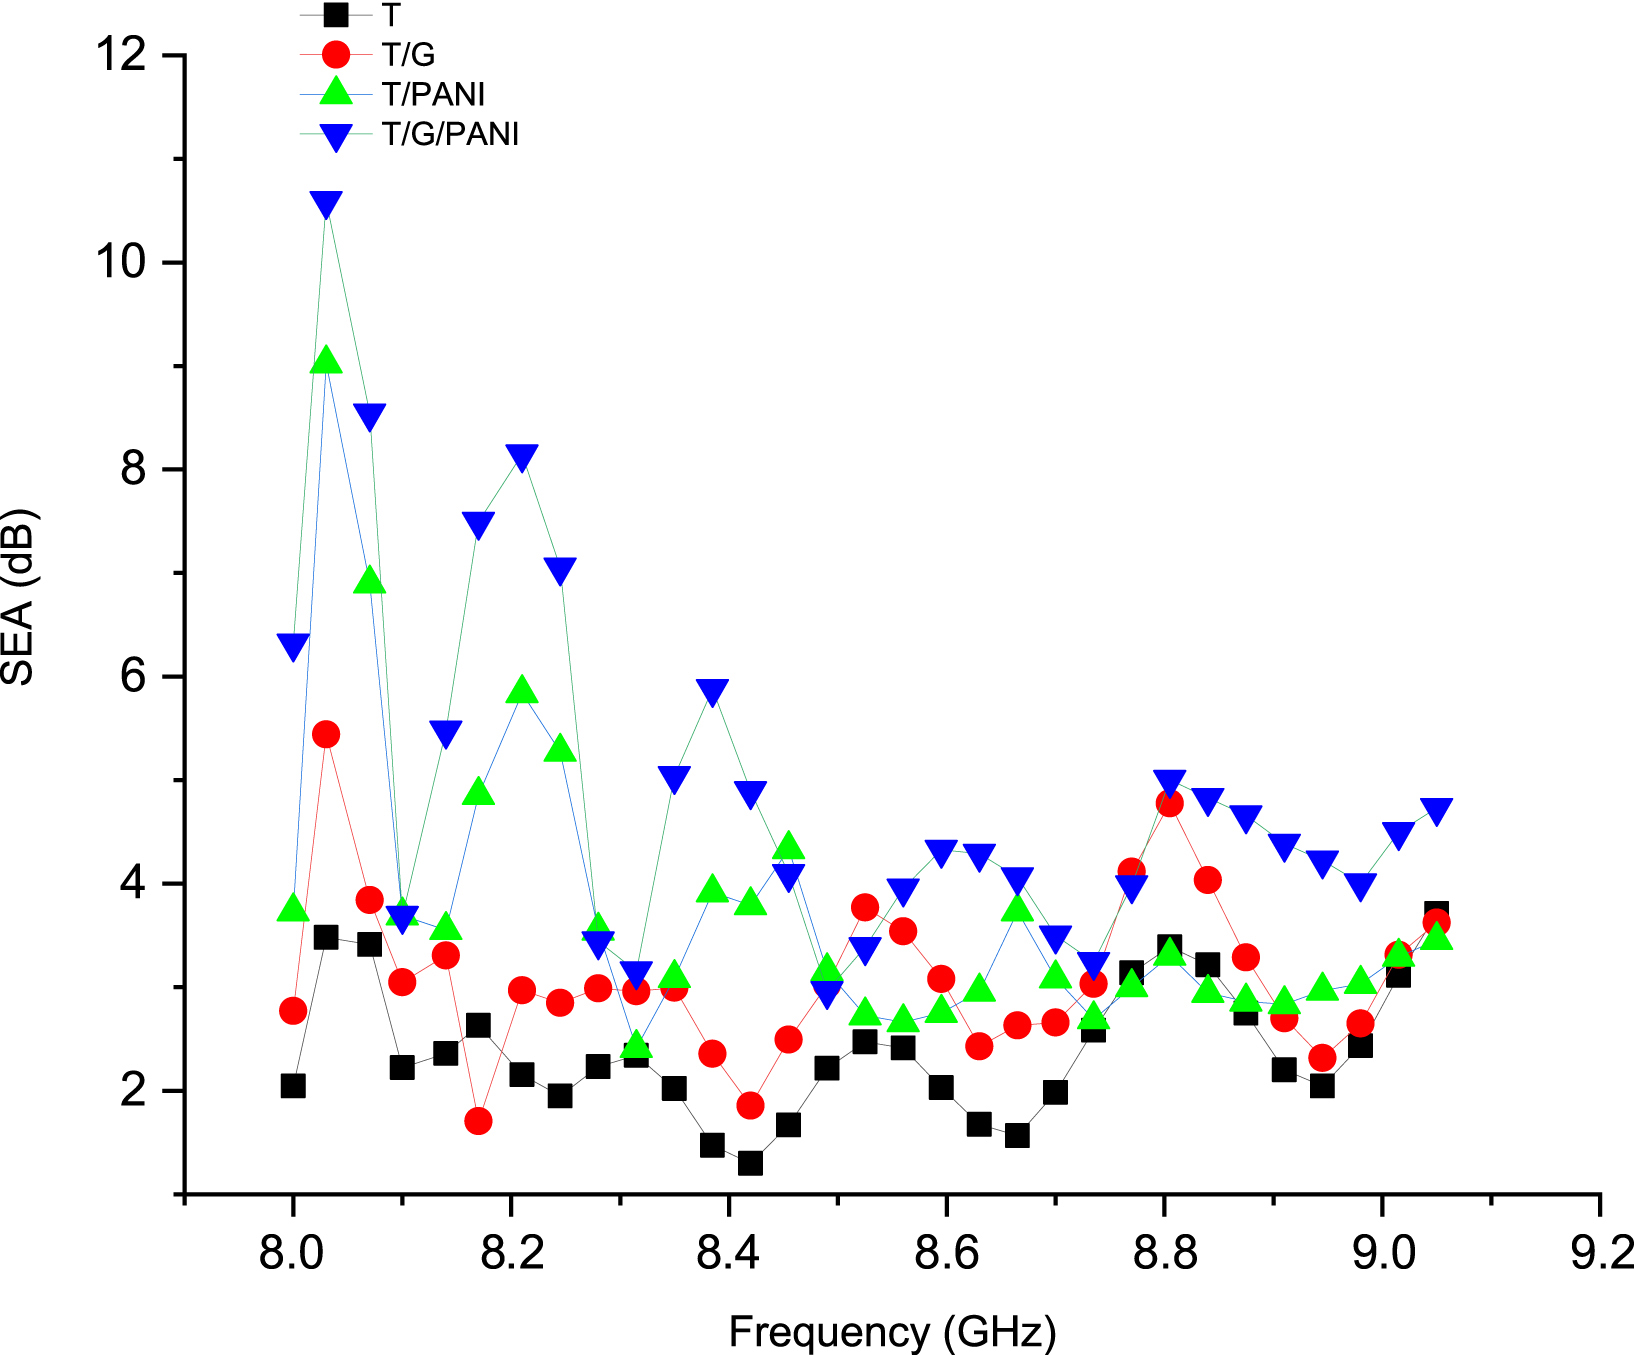
S-parameters of different fabrics
| Fabric | S21 (dB) | S11 (dB) |
|---|---|---|
| T/G | 5.2 | 10.95 |
| T/PANI | 9.2 | 7.24 |
| T/G/PANI | 11.9 | 10.24 |
However, the PANI/G composite fabric showed a lower S11 reflection parameter of 10.24 dB compared to the graphene-coated fabric, which had an S11 value of 10.95 dB [22]. This decrease can be attributed to the way PANI/graphene is absorbed and retained on the fabric surfaces and within its interstices. Despite this, researchers notably found that all the composite fabrics studied could serve as effective materials for constructing electromagnetic shielding. Figure 6 presents the SE of various samples as a function of frequency within the 8–8.6 GHz range. The data reveals a clear frequency dependence of SE, indicating that both the conductive charge and the specific nature of the fabric’s coating significantly influence its shielding capabilities.
Electromagnetic shielding effectiveness (SE) for various samples in the 8 to 8.6 GHz range.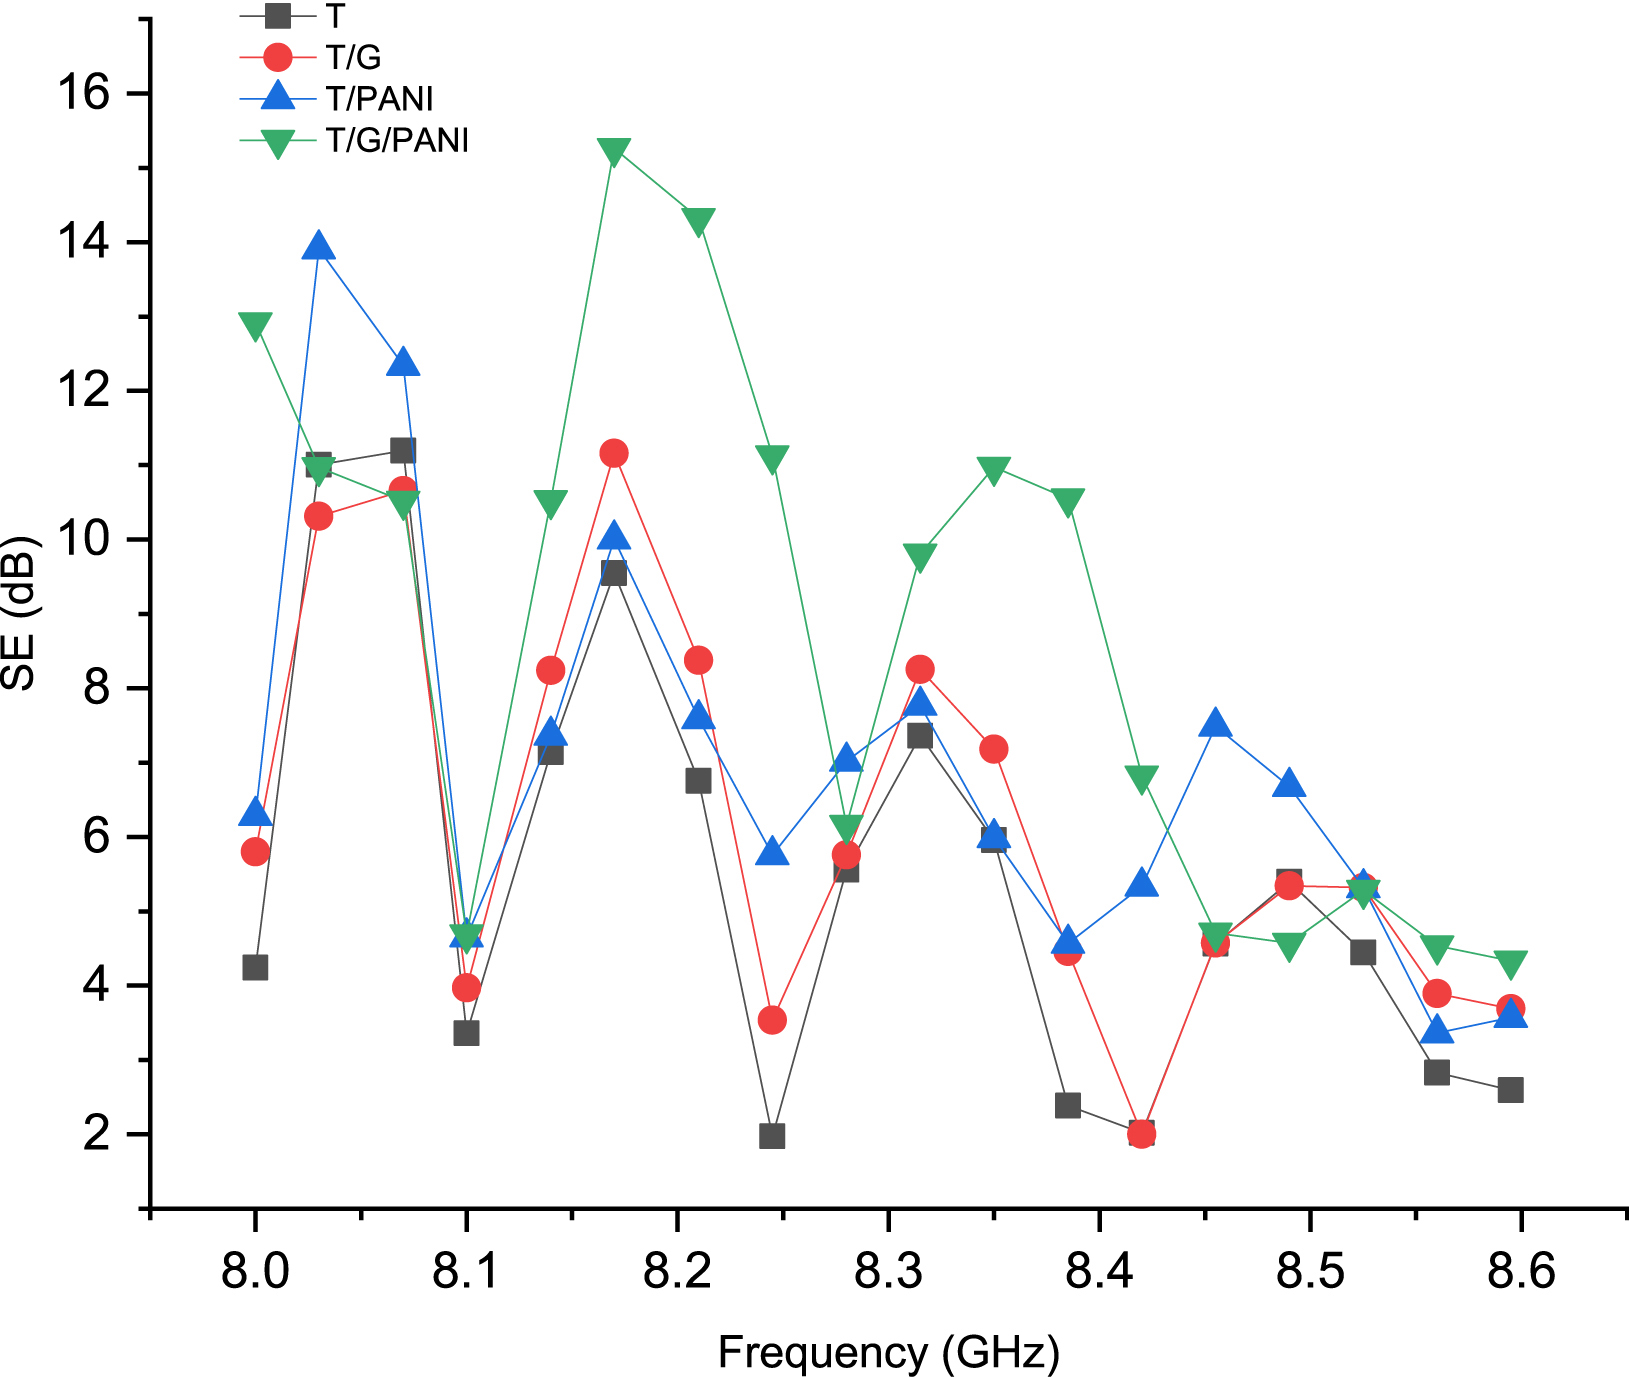
Table 7 summarizes the electromagnetic interference (EMI) SE of fabrics coated with carbon-based materials.
EMI shielding effectiveness of carbon-coated fabrics
| Substrates | Medication routes | Carbon-based materials | EMI SE (dB) | Ref. |
|---|---|---|---|---|
| Cotton | Dip-drying process | MWCNTsa | 9.0 | [46] |
| Vinylon | Blade coating method | Graphite nanosheets | 28.0 | [47] |
| Polyester | Pad-dry-cure method | Nano carbon black | 7.7 | [48] |
| Polyester | Plasma-assisted dip-drying | NH2–MWCNTs | 18.2 | [49] |
| Cotton | Knife-over-roll coating | Carbon black | 31 | [50] |
| Nonwoven fabric | Knife-over-roll coating | Graphene nanotube | 15 | [51] |
| Cotton | Continuous dyeing | Graphene + PANI | 15.4 | This work |
aMultiwall carbon nanotubes.
Table 8 lists the electromagnetic SE of some typical PANI-based composites. Max RL (Frequency) refers to the maximum attenuation in decibels (dB), indicating the peak absorption efficiency at a given frequency. Bandwidth (GHz) indicates the frequency range over which absorption exceeds a certain threshold.
Microwave absorption properties of various PANI-based composites
| Absorber | Thickness (mm) | Max RL (frequency) | Bandwidth (GHz) | Ref. |
|---|---|---|---|---|
| PANI nanoparticles | 2.0 | 18.8 dB (17.2 GHz ) | 14.1–18.0 | [52] |
| BaFe12O19/PANI | 2.0 | 19.7 dB (14.6 GHz) | 13.0–16.9 | [53] |
| Ba(CoTi)xFe12−2xO19/PANI | 2.0 | 33.7 dB (14.6 GHz) | 12.0–17.3 | [54] |
| Fe3O4 microspheres/PANI | 2.0 | 18.6 dB (14.0 GHz) | 12.1–16.0 | [55] |
| Fe3O4/MWCNT/PANI | 2.0 | 8.0 dB (14.7 GHz) | Undetected | [56] |
| graphite/CoFe2O4/PANI | 2.0 | 11.0 dB (3.8 GHz) | 3.4–4.0 | [57] |
| graphene/PANI | 2.0 | 25.3 dB (16.5 GHz) | 13.9–18.0 | [58] |
| α-MoO3/PANI | 2.0 | 33.7 dB (16.9 GHz) | 14.2–18.0 | [59] |
| Fe3O4/PANI | 2.0 | 13.8 dB (16.7 GHz) | 16.3–17.2 | [60] |
| Fe3O4 microspheres/PANI | 2.0 | 37.4 dB (15.4 GHz) | 13.0–18.0 | [61] |
| NiZn ferrite/PANI | 2.0 | 20.0 dB (14.0 GHz) | 12.0–16.6 | [62] |
| Fe3O4/CIP/PANI | 2.0 | 25.5 dB (10.1 GHz) | 7.1–9.9 | [63] |
| BaTiO3/PANI | 2.0 | 13.8 dB (11.6 GHz) | 10.7–12.5 | [64] |
| MnO2/PANI | 2.0 | 20.9 dB (13.5 GHz) | 11.4–16.8 | [65] |
| graphene@Fe3O4@SiO2@PANI | 2.0 | 19.4 dB (16.4 GHz) | 10.4–18.0 | [66] |
| Ni/C/PANI | 2.0 | 7.5 dB (10.0 GHz) | Undetected | [67] |
| PPy@PANI-0.8 | 2.0 | 23.3 dB (15.8 GHz) | 13.5–18.0 | [68] |
| PPy@PANI-1.2 | 2.0 | 34.8 dB (13.9 GHz) | 11.9–16.6 | |
| PPy@PANI-1.6 | 2.0 | 31.5 dB (13.6 GHz) | 11.7–16.4 | |
| Textile | 2.0 | 9.53 dB (8.17 GHz) | 8–9 | This work |
| Textile/Graphene | 2.0 | 11.17 dB (8.17 GHz) | ||
| Textile/PANI | 2.0 | 9.98 dB (8.17 GHz) | ||
| Textile/Graphene/PANI | 2.0 | 15.4 dB (8.17 GHz) |
The results show that the modification of the fabric coating with graphene nanofillers improves SE. The conductive PANI coating on the fabric achieved a SE of 9.98 dB, while graphene used as a coating material increased this effect to 11.17 dB. The effective shielding properties were further improved to a SE of 15.4 dB when the fabric was coated with PANI/graphene.
6. Conclusion
In this work, we report the use of graphene as filler uniformly distributed in the fabric matrix with polyaniline coating to improve its electromagnetic shielding effectiveness up to 15.4 dB from simulation results. The trade-off between the attenuation of electromagnetic waves and reflection loss results in a conductive network with a higher graphene content. Changing the type of carbon nanofillers within the matrix affects the shielding effectiveness, which may be due to the conductivity enhancement in each doped device.
Authorship contributions
Authors equally contributed to this work.
Ethics approval
There are no ethical issues with the publication of this manuscript.
Data availability statement
The authors confirm that the data that supports the findings of this study are available within the article. Raw data that support the findings of this study are available from the corresponding author, upon reasonable request.
Declaration of interests
The authors do not work for, advise, own shares in, or receive funds from any organization that could benefit from this article, and have declared no affiliations other than their research organizations.