


 CC-BY 4.0
1. Introduction
In recent years, phosphate-based compounds have garnered considerable attention within the scientific community owing to their intrinsic structural diversity and the breadth of their potential technological applications. The fundamental building units of these materials, PO4 tetrahedra, enable the construction of a wide array of crystalline architectures, allowing the systematic modulation of physical and chemical properties through compositional and structural variation. This versatility has rendered phosphate frameworks especially attractive for use in fields such as energy storage, catalysis, ion exchange, and solid-state ion conduction.
Within this broad class of materials, transition-metal phosphates have emerged as particularly promising candidates. Their utility stems from a unique combination of chemical robustness, redox flexibility, and tunable framework geometries. Several structural families have been extensively studied for their performance in various technological domains. Among them, phosphates of the NASICON (sodium super ionic conductor) type have drawn significant interest due to their three-dimensional open-framework structures and exceptional ionic conductivity, which are ideal for lithium- and sodium-ion battery applications [1, 2]. Likewise, diphosphates and langbeinite-type phosphates have been explored for their thermal stability and catalytic efficiency in both environmental and industrial processes [3, 4, 5]. Monophosphates, which are structurally simpler yet chemically versatile, have shown promise in electrochemical devices and ion transport systems [6, 7, 8, 9, 10].
A notable subcategory within monophosphates comprises compounds with general formula AIIMIV(PO4)2, where AII represents a divalent cation (e.g., Ca2+, Sr2+, Ba2+) and MIV denotes a tetravalent cation (e.g., Zr4+, Sn4+, Ti4+). These materials have been the focus of several structural studies aiming to correlate chemical composition with crystallographic arrangement. Two primary structural types have been identified in this family: cheralite-type and yavapaiite-type frameworks. The distinction between these two polymorphs is governed predominantly by the relative sizes of the constituent cations.
Specifically, a high ionic-radius ratio between the AII and MIV cations favors the formation of the yavapaiite-type structure, characterized by an ordered network of cationic polyhedra. This structural order is typically associated with enhanced material stability and predictable ion transport pathways, which are desirable for energy storage and ionic conduction applications. In contrast, systems with a lower radius ratio tend to crystallize in the cheralite-type structure, which exhibits a more disordered arrangement of cations. While such disorder can be detrimental to certain properties such as ionic mobility it may, in some contexts, introduce defect-mediated functionalities that are beneficial in applications like heterogeneous catalysis or proton conduction [10].
These insights into the structure–composition relationships within AIIMIV(PO4)2 compounds offer a rational basis for the design and optimization of phosphate-based materials. By carefully selecting suitable cation pairs, it is possible to direct the formation of targeted structures with tailored properties, thereby advancing the development of high-performance materials for next-generation electrochemical and catalytic technologies.
Recently, diverse compounds A(M0.5VX0.5III)(PO4)2 with M = Sb, Nb; A = Sr, Pb, Ba; and X = Ga, Cr, Fe, Sc, In, Yb, Al have been studied in terms of structural and vibrational properties [11, 12, 13, 14, 15, 16, 17, 18]. The barium phases Ba(X0.5IIIX′0.5V)(PO4)2 crystallized in the monoclinic C2/m space group (Z = 2), while other phases such as A(Sb0.5X0.5III)(PO4)2 (A: Pb, Sr; X: Fe, Cr, Ga) [11, 13, 14] crystallized in the distorted monoclinic yavapaiite structure type, of space group C2/c (Z = 4).
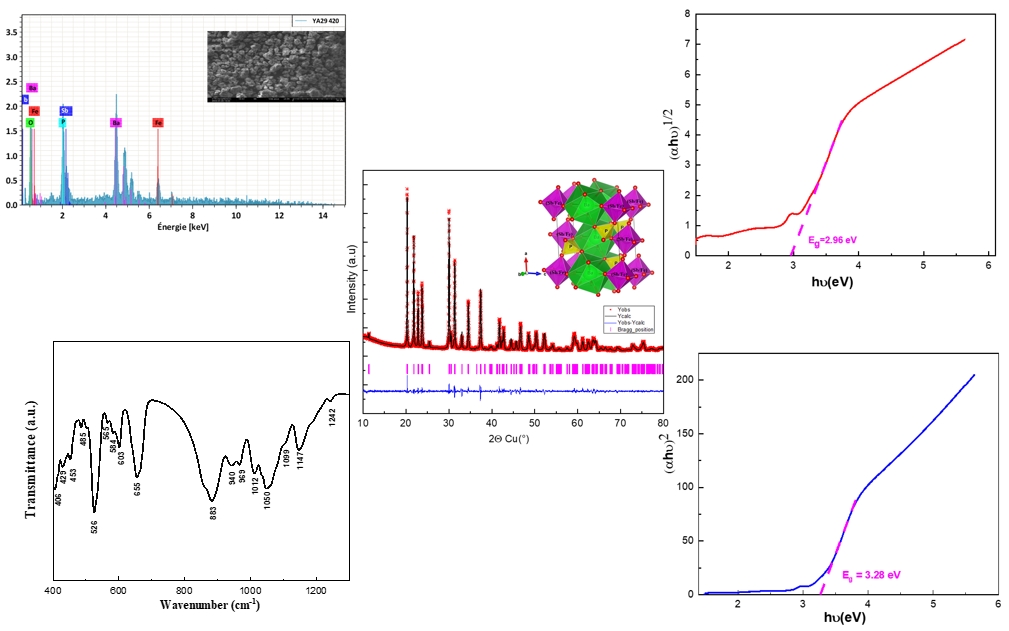
Searching UV–visible spectra of novel semiconducting phosphates, this paper investigates microstructural, vibrational properties of the BaSb0.5Fe0.5(PO4)2 space group (C2/m,Z = 2) [11]. In this context, microstructural morphology, Raman and infrared spectra and UV–visible absorption spectra are studied for optical properties of this phosphate.
2. Experimental
2.1. Synthesis
The BaSb0.5Fe0.5(PO4)2 compound was prepared using the conventional high-temperature solid-state process from mixtures of BaCO3, Fe2O3, Sb2O3, and NH4H2PO4 powders in an appropriate stoichiometric ratio. The reagents were transferred to an agate mortar and finely ground into a perfectly homogeneous mixture, which was then heated in air to a final temperature of 930 °C.
2.2. Characterization techniques
The X-ray powder diffraction (XRD) pattern of the resulting material was collected at room temperature using a D8 Advance Bruker diffractometer equipped with Cu anticathode (Cu–Kα radiation, 𝜆 = 1.5406 Å) and Lynx Eye detectors. The measurements were performed under Bragg–Brentano geometry at 2𝜃 with 0.0105° steps in the 10°–80° range. Structural refinements were carried out using the FullProf Suite software [19].
Infrared spectra of the compounds were recorded using Bruker’s VERTEX 70 FTIR spectrometer in the 1500–400 cm−1 range, with the samples prepared as KBr pellets. Raman spectra were recorded on the RENISHAW 1000B spectrometer in the 50–1500 cm−1 range.
The microstructural surface features of the samples were examined using scanning electron microscopy (SEM) with a JEOL JSM-IT100 InTouchScope microscope, operated at 15 kV. Prior to imaging, the sample was mounted on aluminum stubs using carbon tape and coated with a thin layer of carbon through metallization to ensure surface conductivity and to avoid charging effects. The observations were made at various magnifications (3000× at 20 μm and 2000× at 30 μm).
3. Results and discussion
3.1. Structure of BaSb0.5Fe0.5(PO4)2 phase
The Rietveld study, performed using the Le Bail profile, revealed that the BaSb0.5Fe0.5(PO4)2 phase crystallizes in the monoclinic C2/m space group. Accordingly, the initial structural parameters for the Rietveld refinement were adopted from the previously reported BaSb0.5Ga0.5(PO4)2 phase by Fakhreddine et al. [14], which also belongs to the C2/m space group. The refinement yielded satisfactory reliability indicators, with RF = 1.6%, RB = 2.2%, and 𝜒2 = 1.3. The Rietveld refinement for the BaSb0.5Fe0.5(PO4)2 compound is illustrated in Figure 1, while the detailed refinement parameters are summarized in Table 1. Table 2 presents the XRD data obtained from the “observed intensities” of the Rietveld refinement (Cu–Kα1; 𝜆 = 1.5406 Å).
Rietveld refinement of the BaSb0.5Fe0.5(PO4)2 phase.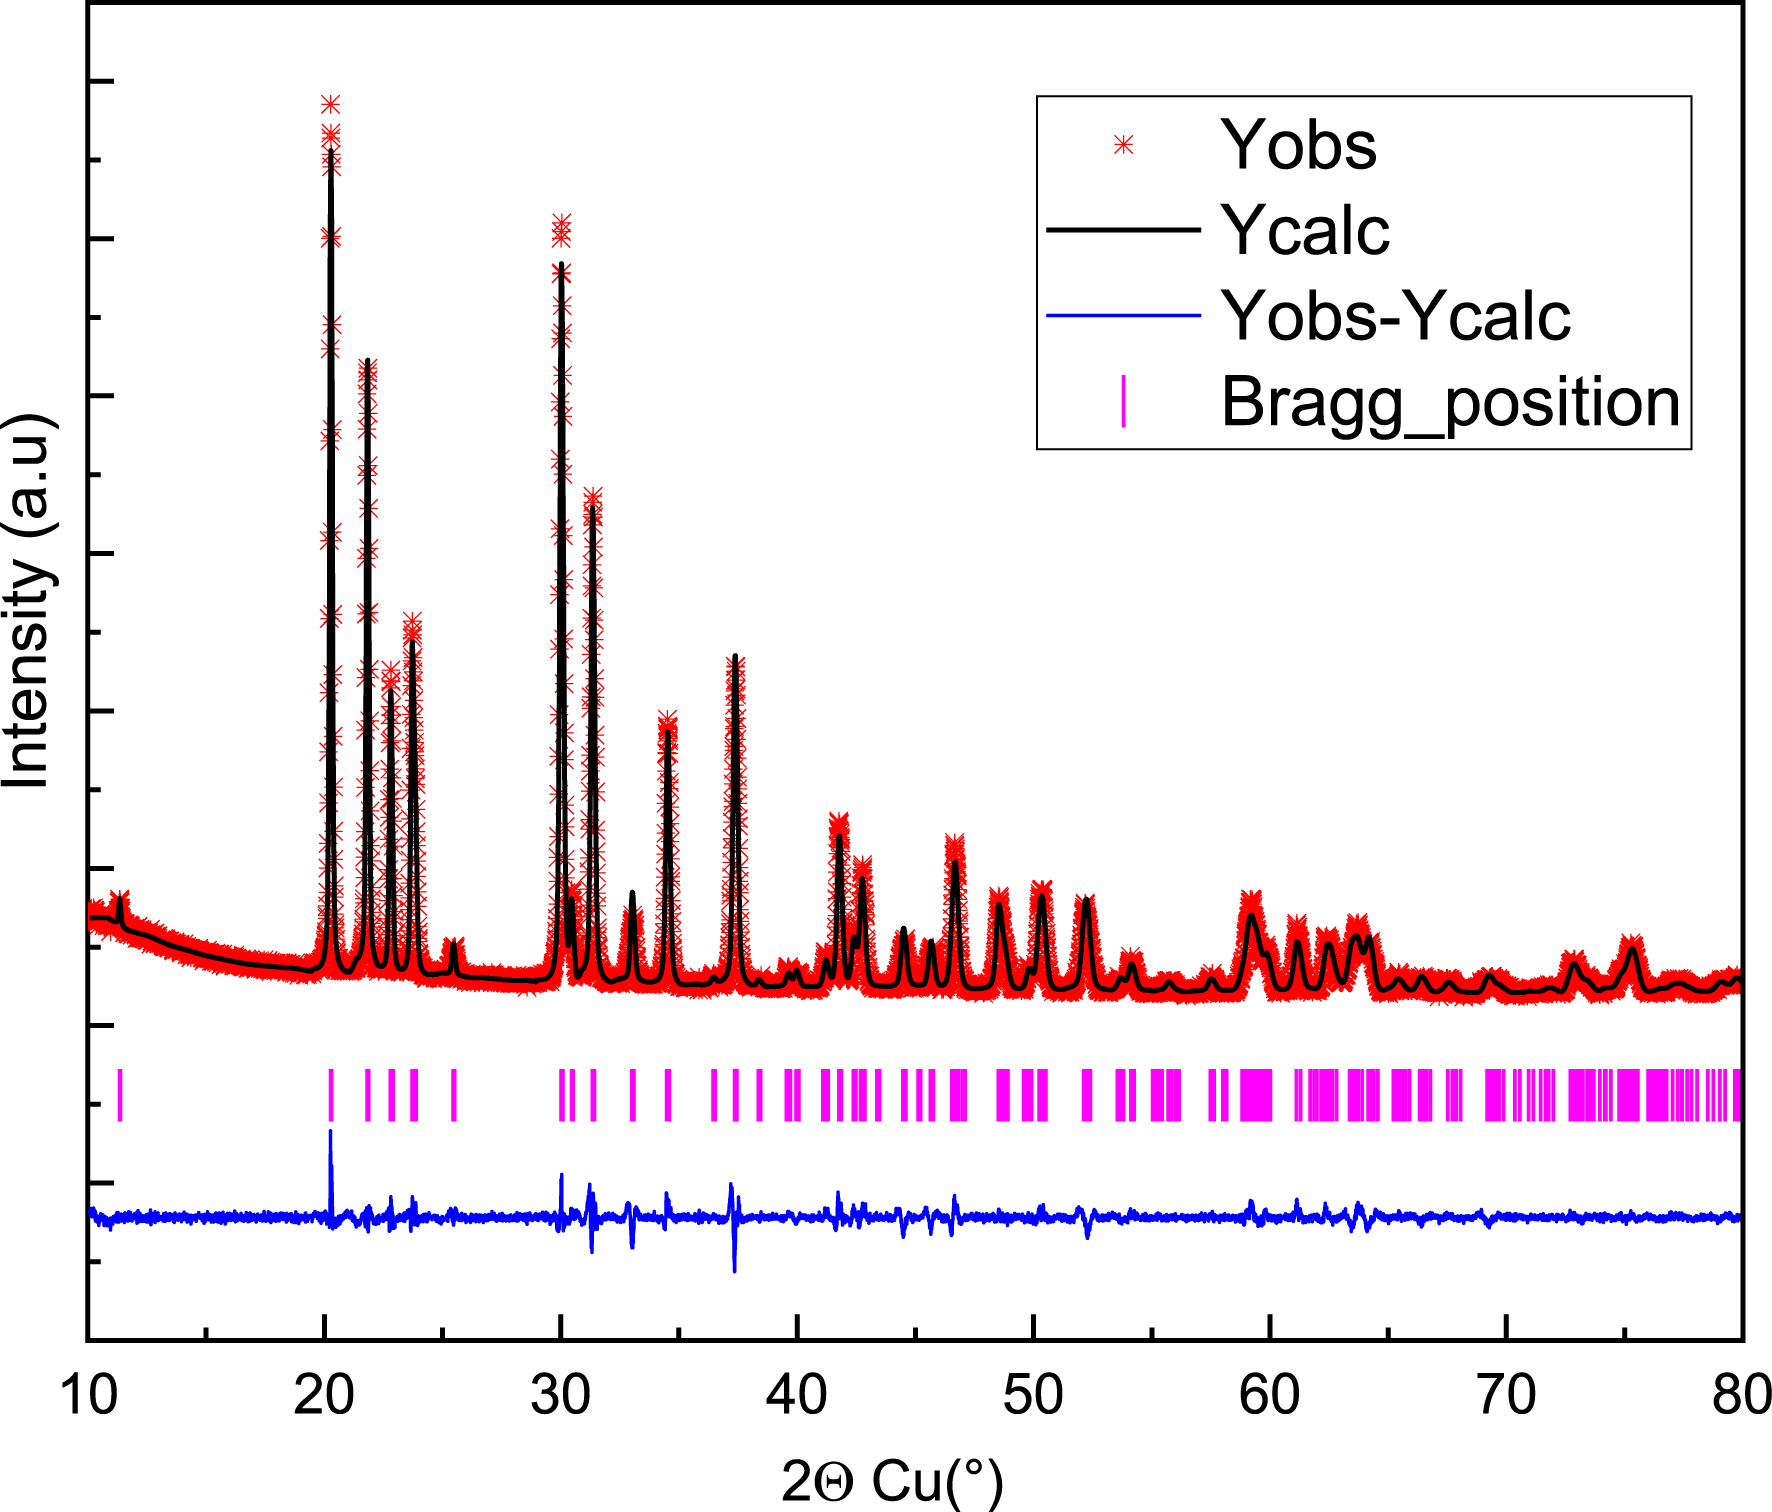
Crystallographic data for BaSb0.5Fe0.5(PO4)2
| Space group C2/m (N° 12); [Z = 2; a = 8.1661 (4) Å; b = 5.1934 (3) Å; c = 7.8212 (4) Å; 𝛽 = 94.51 (1)°; V = 331 (1) Å3] | ||||||
| Experimental data | ||||||
| Temperature 25 °C; angular range 10° ⩽ 2𝜃 ⩽ 80° | ||||||
| step scan increment (2𝜃): 0.0105° | ||||||
| Zero point (2𝜃), −0.021 (1)° | ||||||
| Profile parameters | ||||||
| Pseudo-Voigt function, PV = 𝜂L + (1−𝜂)G; 𝜂 = 0.586 (2) | ||||||
| Half-width parameters, U = 0.369 (3), V = −0.0597 (4), and W = 0.0120 (1) | ||||||
| Conventional Rietveld R-factors, RWP = 6.7%; RP = 4.9%; RB = 2.20%; RF = 1.59% | ||||||
| Atom | Site | Wyckoff positions | Biso (Å2) | Occupancy | ||
| Ba | 2c | 0 | 0 | 0.5 | 0.7 (1) | 1 |
| (Fe/Sb) | 2a | 0 | 0 | 0 | 0.3 (2) | 0.5/0.5 |
| P | 4i | 0.3644 (1) | 0 | 0.2045 (1) | 0.4 (1) | 1 |
| O (1) | 4i | 0.2342 (3) | 0 | 0.0560 (2) | 0.7 (4) | 1 |
| O (2) | 4i | 0.3106 (2) | 0 | 0.3854 (2) | 0.4 (3) | 1 |
| O (3) | 8j | 0.4839 (3) | 0.2414 (2) | 0.1922 (1) | 0.6 (2) | 1 |
Powder diffraction data of BaSb0.5Fe0.5(PO4)2 (Cu–Kα1; 𝜆 = 1.5406 Å)
| hkl | dobs (Å) | 100 I / I0 (obsd) | 100 I / I0 (calcd) | hkl | dobs (Å) | 100 I / I0 (obsd) | 100 I / I0 (calcd) |
|---|---|---|---|---|---|---|---|
| 001 | 7.7970 | 5 | 5 | 132 | 1.5449 | 6 | 5 |
| 110 | 4.3783 | 100 | 100 | −422 | 1.5150 | 6 | 5 |
| 200 | 4.0704 | 64 | 68 | −224 | 1.4887 | 5 | 4 |
| 002 | 3.8985 | 34 | 32 | −512 | 1.4811 | 3 | 3 |
| −111 | 3.8884 | 15 | 16 | 314 | 1.4654 | 4 | 5 |
| 111 | 3.7506 | 39 | 39 | −404 | 1.4667 | 4 | 4 |
| −201 | 3.7306 | 22 | 21 | 330 | 1.4602 | 7 | 6 |
| 201 | 3.4944 | 3 | 4 | 422 | 1.4502 | 5 | 6 |
| −112 | 2.9747 | 92 | 90 | 224 | 1.4271 | 2 | 1 |
| −202 | 2.9330 | 10 | 10 | 512 | 1.4063 | 2 | 3 |
| 112 | 2.8523 | 52 | 53 | −332 | 1.3871 | 1 | 1 |
| 202 | 2.7111 | 9 | 10 | 600 | 1.3552 | 2 | 2 |
| 020 | 2.5990 | 31 | 29 | 332 | 1.3489 | 1 | 1 |
| 310 | 2.4051 | 34 | 36 | 040 | 1.3000 | 3 | 3 |
| −311 | 2.3447 | 1 | 1 | −134 | 1.2902 | 2 | 2 |
| −203 | 2.2776 | 3 | 2 | 134 | 1.2693 | 2 | 2 |
| 311 | 2.2544 | 2 | 2 | −116 | 1.2619 | 5 | 4 |
| 220 | 2.1945 | 5 | 4 | 240 | 1.2372 | 1 | 1 |
| 022 | 2.1612 | 18 | 17 | 042 | 1.2323 | 1 | 1 |
| −221 | 2.1312 | 7 | 6 | 206 | 1.2108 | 2 | 1 |
| −312 | 2.1137 | 14 | 12 | 424 | 1.2016 | 3 | 3 |
| 400 | 2.0352 | 5 | 6 | ||||
| 312 | 1.9860 | 6 | 6 | ||||
| 004 | 1.9493 | 16 | 14 | ||||
| 222 | 1.8753 | 9 | 9 | ||||
| −402 | 1.8653 | 4 | 4 | ||||
| −313 | 1.8299 | 3 | 3 | ||||
| −204 | 1.8159 | 9 | 9 | ||||
| −114 | 1.8144 | 11 | 10 | ||||
| 114 | 1.7534 | 7 | 7 | ||||
| 402 | 1.7479 | 6 | 9 | ||||
| 130 | 1.6933 | 4 | 3 | ||||
| 131 | 1.6491 | 2 | 2 | ||||
| 420 | 1.6018 | 3 | 4 | ||||
| −132 | 1.5625 | 10 | 9 | ||||
| 510 | 1.5536 | 5 | 5 |
The three-dimensional framework of this phosphate can be considered as composed of an alternation of BaO10 polyhedra, PO4 tetrahedra, and Sb(Fe)O6 octahedra. The BaO10 polyhedra and Sb(Fe)O6 octahedra share edges and form infinite chains parallel to the c-axis. Each Sb(Fe)O6 octahedron is connected at its vertices to six PO4 tetrahedral groups. The PO4 tetrahedra are isolated, and each is linked, through two of its edges, to two BaO10 polyhedra. The three-dimensional framework consists of layers of Ba2+ cations in tenfold coordination, alternating with dense layers made up of MO4 octahedra (M = Sb, Fe) and PO4 tetrahedra, which are interconnected via their vertices (Figures 2 and 3).
Structure of the BaSb0.5Fe0.5(PO4)2 phase.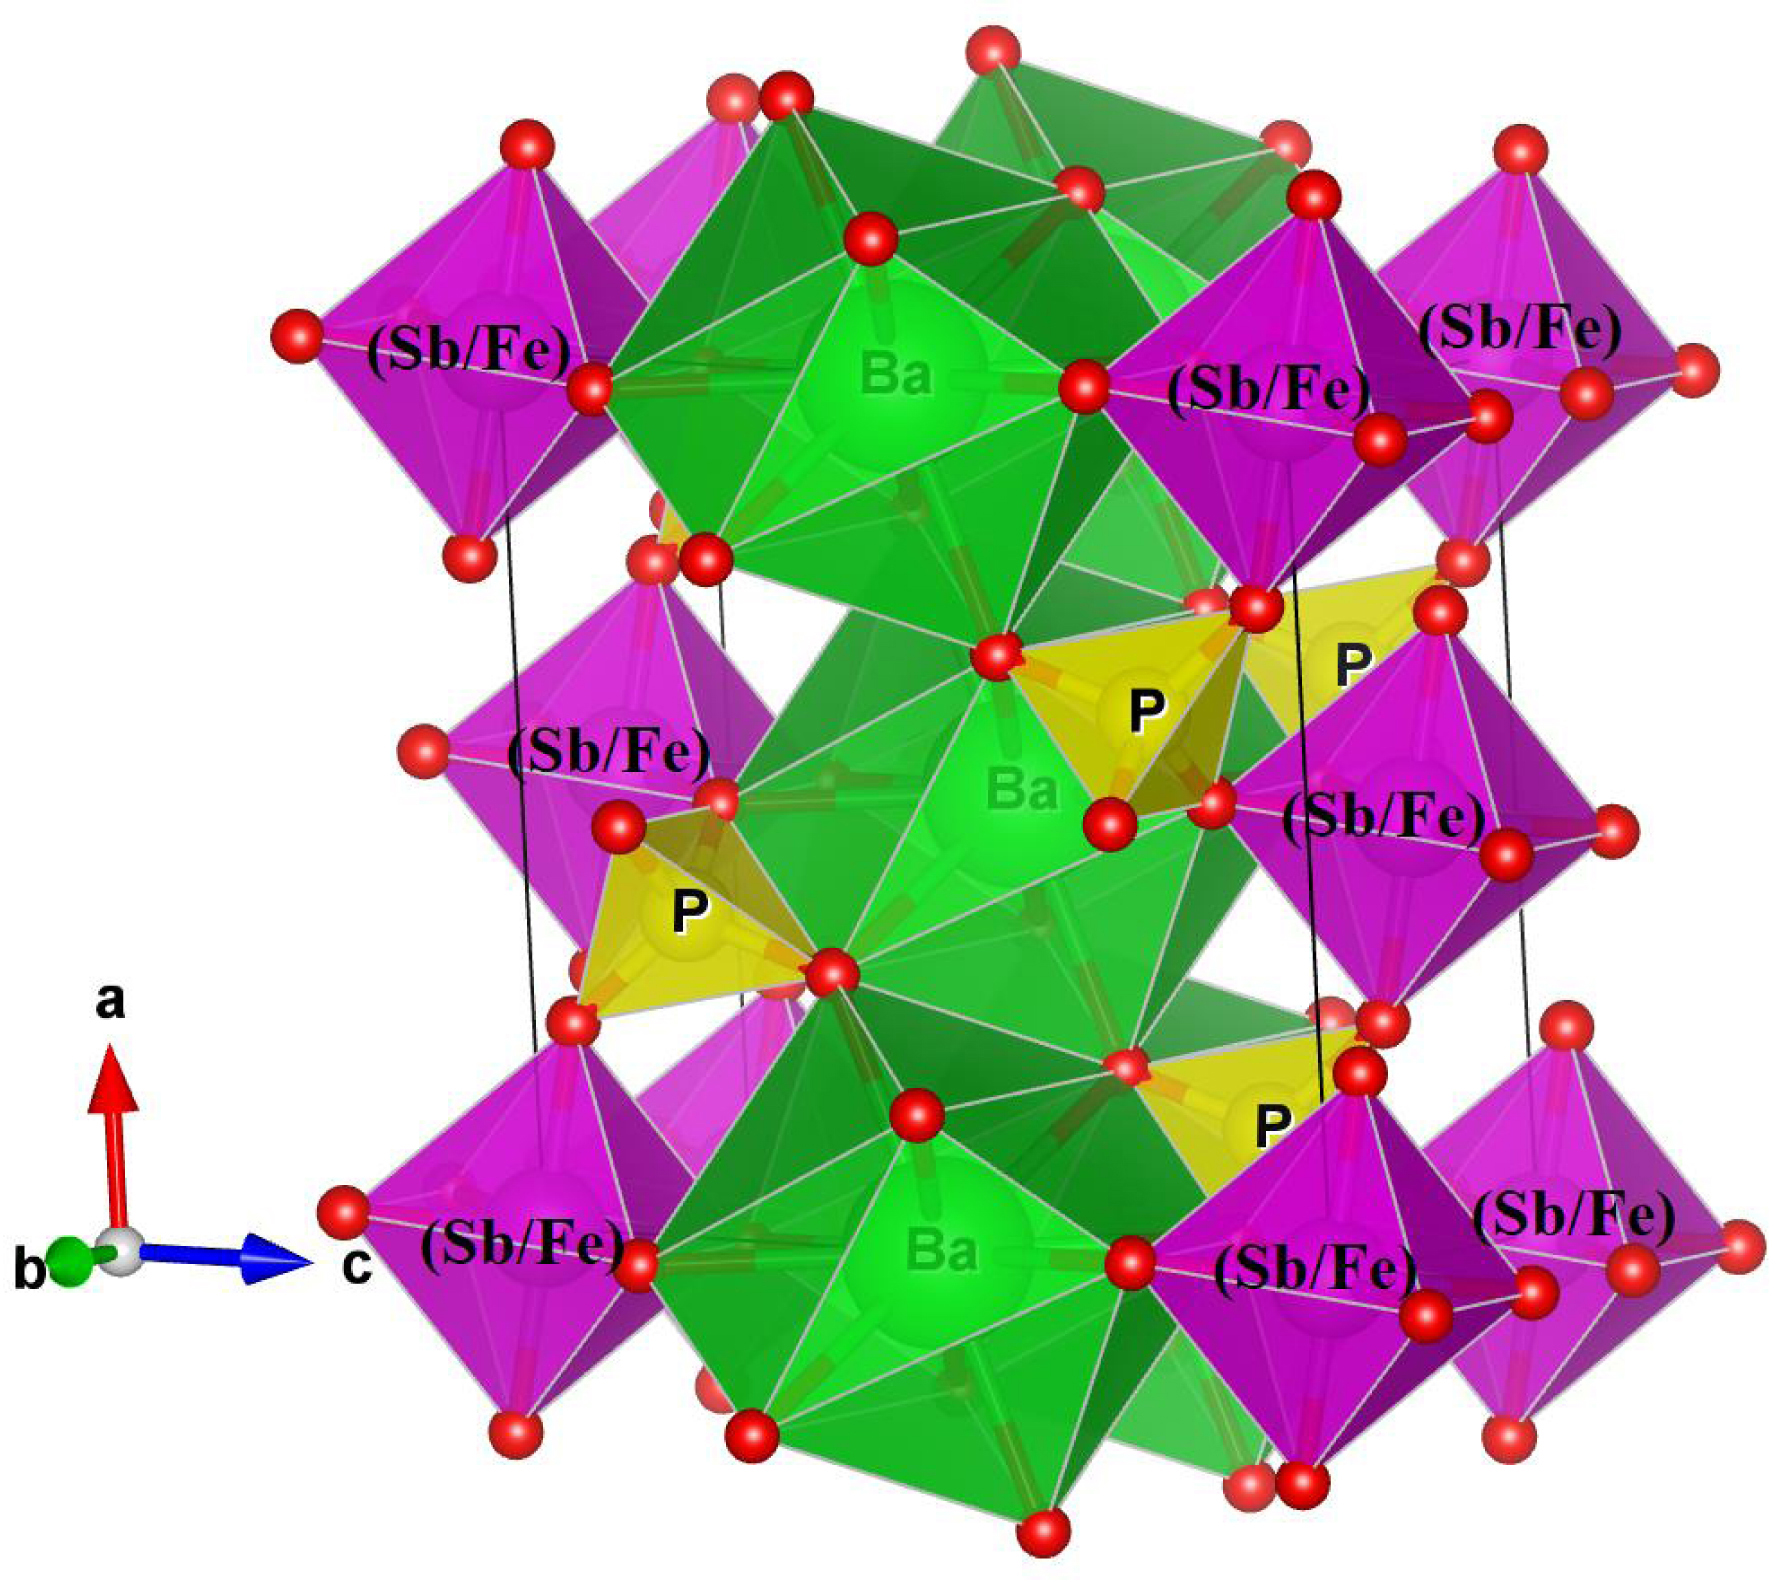
Projection onto the (ac) plane of the structure of the BaSb0.5Fe0.5(PO4)2 phosphate.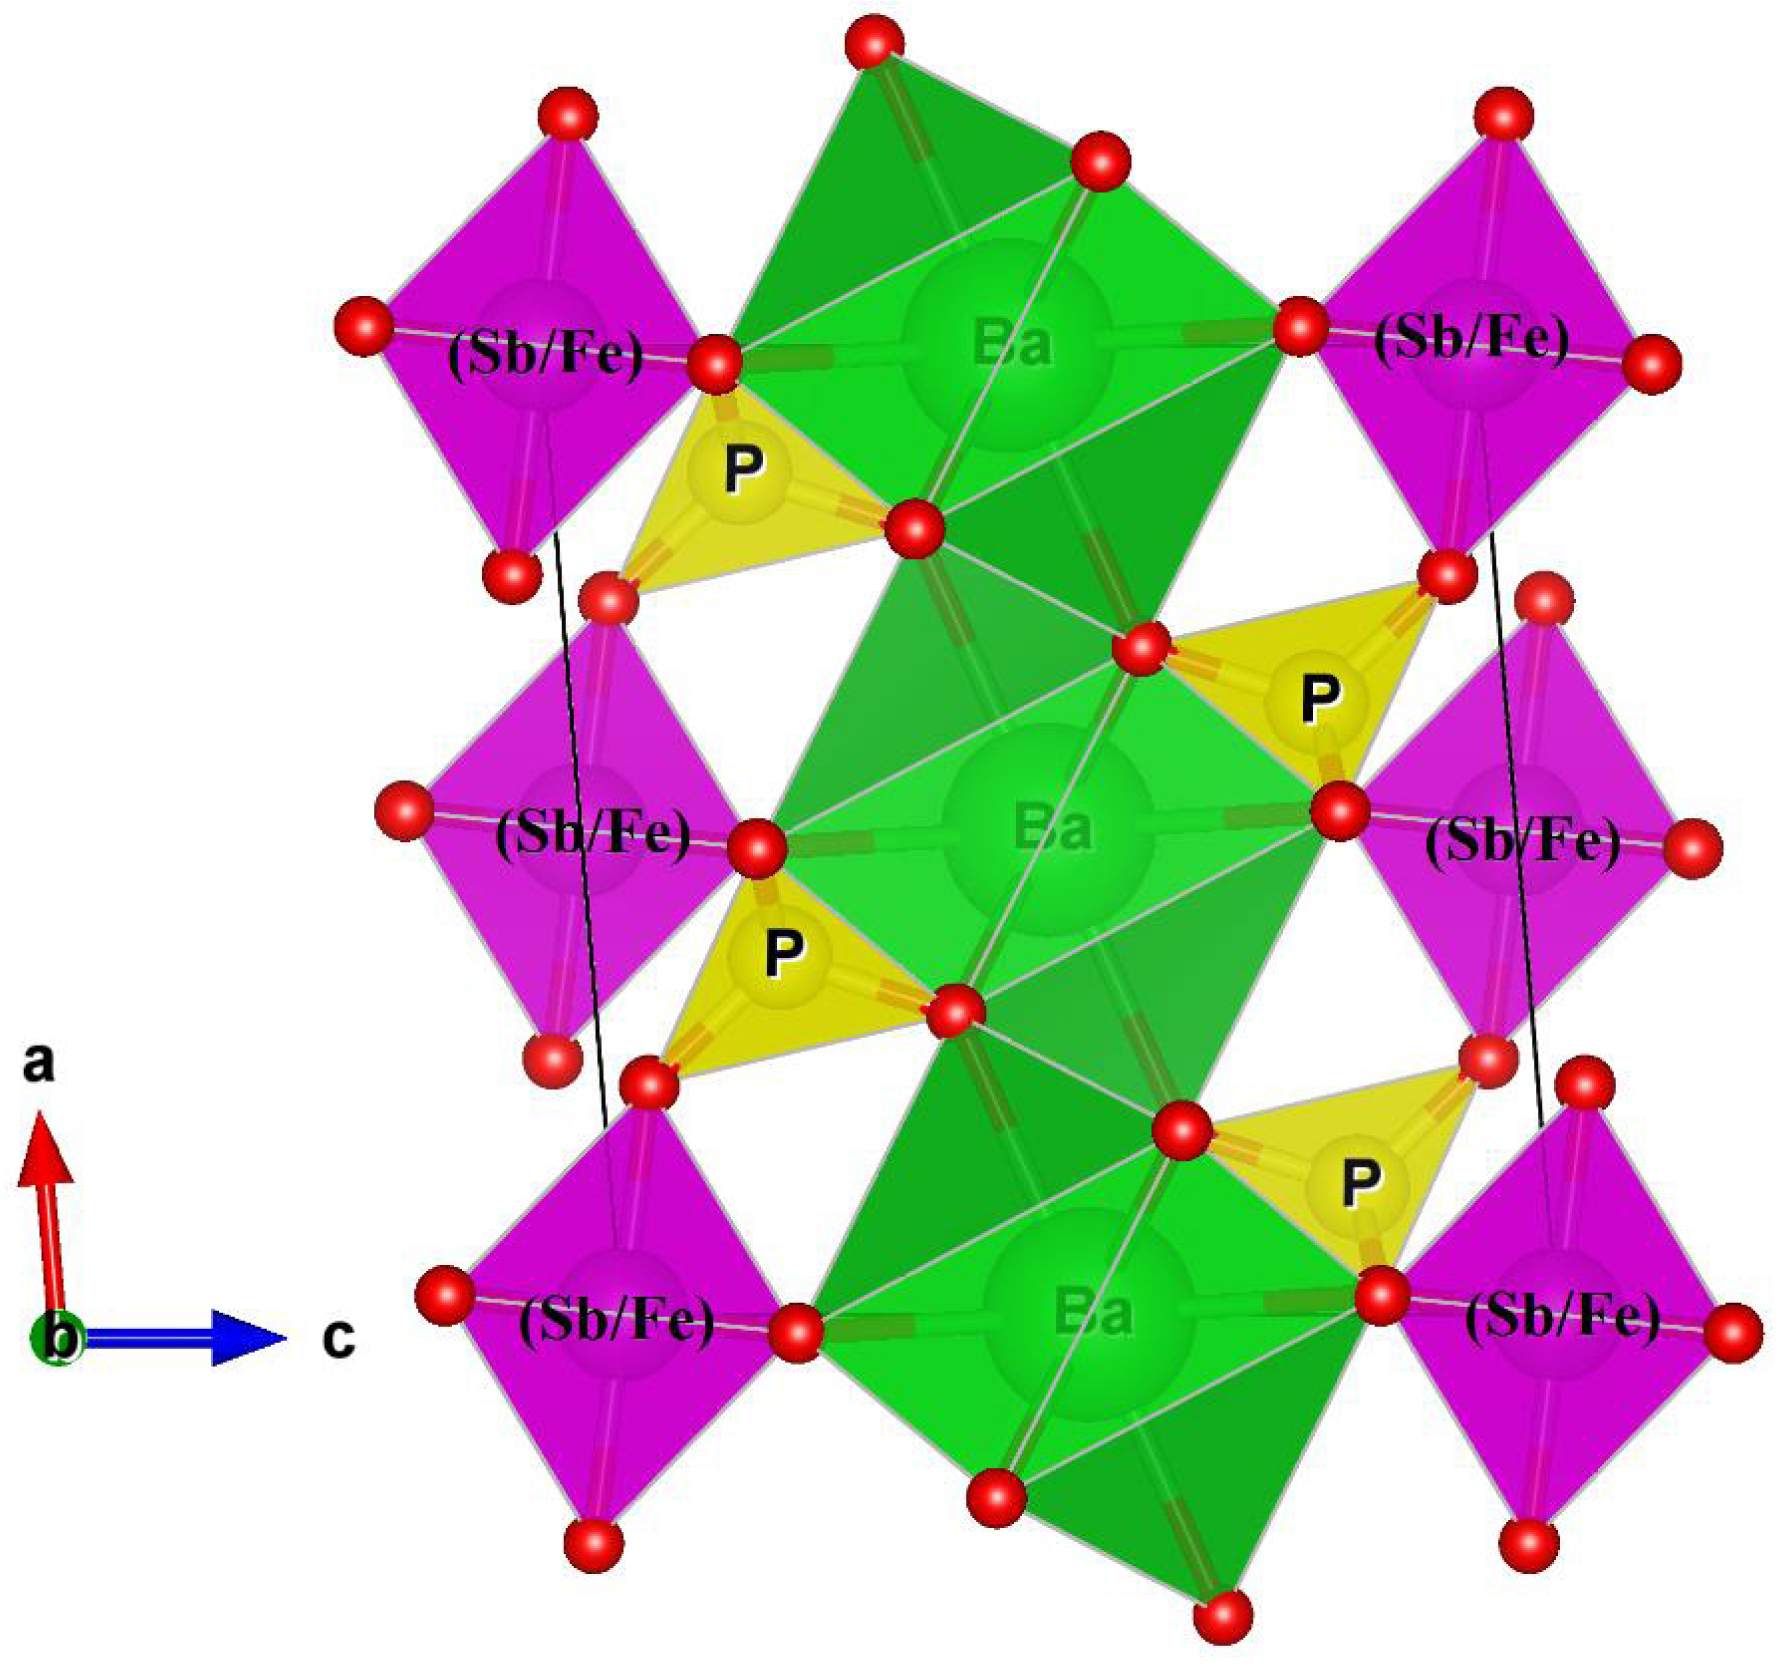
3.2. Scanning electron microscopy (SEM)
SEM Investigation by SEM of the BaSb0.5Fe0.5(PO4)2 powder (Figure 4), recorded at 2000× and 3000× magnifications, revealed a heterogeneous microstructure consisting of agglomerated grains of various sizes, interspersed with intergranular pores. The grains exhibit irregular morphology and clustering behavior, indicative of polycrystalline growth with incomplete densification, a common feature in materials synthesized at moderate temperatures. Based on the scale bars (30 μm and 20 μm), the individual grains and clusters display approximate sizes ranging from 2 to 10 μm, with some larger agglomerates extending beyond 10 μm. Such a morphology could influence the material’s functional properties, particularly in relation to surface activity and ionic diffusion paths.
SEM micrographs of BaSb0.5Fe0.5(PO4)2 at 2000× (a) and 3000× (b) magnifications.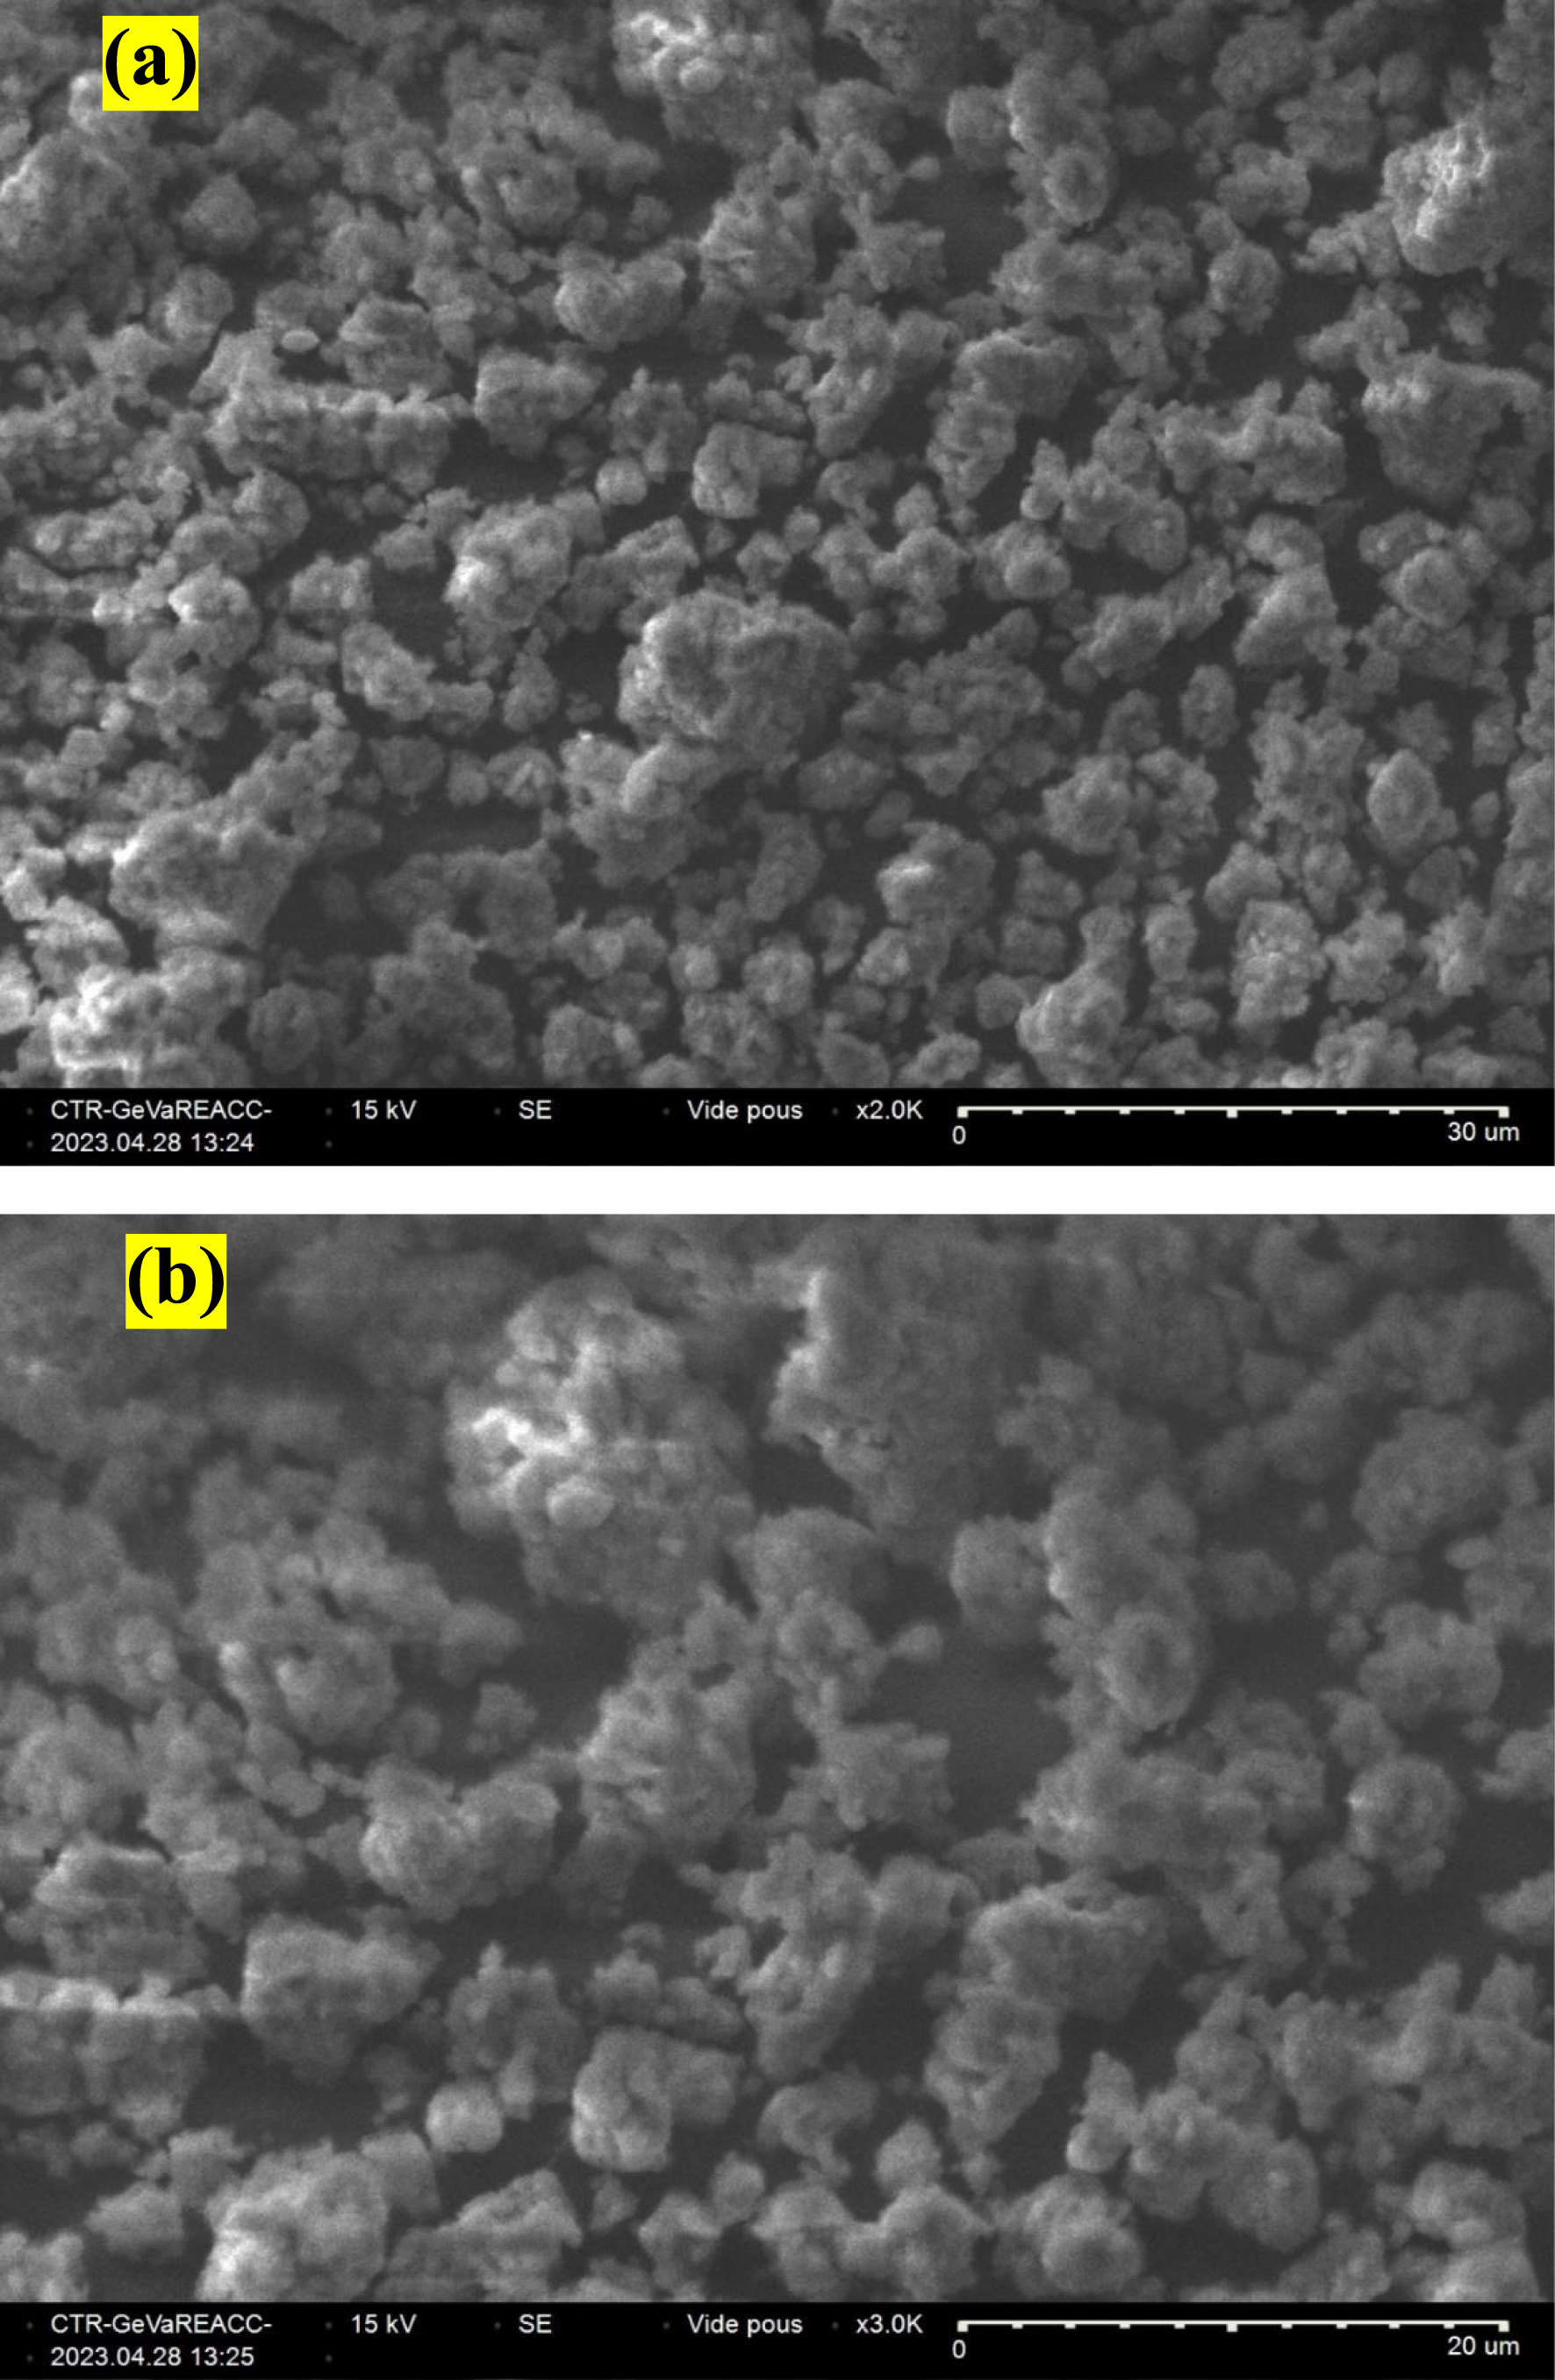
To evaluate the elemental composition of the synthesized material and verify the target stoichiometry, energy-dispersive X-ray spectroscopy (EDS) was performed. The quantitative results obtained from the EDS spectra (Figure 5 and Table 3) provide the mass and atomic percentages of the elements Ba, Fe, Sb, P, and O in the compound studied. From the atomic percentages, the calculated ratios (Ba/P = 0.557, Fe/P = 0.284, Sb/P = 0.307, Ba/Sb = 1.82, and Ba/Fe = 1.96) align well with the theoretical values for the BaSb0.5Fe0.5(PO4)2 composition (Ba/P = 0.50, Fe/P = 0.25, Sb/P = 0.25, Ba/Sb = 2.00, and Ba/Fe = 2.00). The small deviations observed are typical of EDS quantification due to matrix effects and the limited sensitivity for light elements. Nevertheless, the overall consistency between experimental and theoretical ratios confirms that the targeted stoichiometry is achieved, indicating successful incorporation of Sb and Fe in the structure. This result strongly supports the homogeneity of the sample, and the effectiveness of the synthesis route used for producing a well-defined, single-phase phosphate compound.
EDX spectrum of BaSb0.5Fe0.5(PO4)2.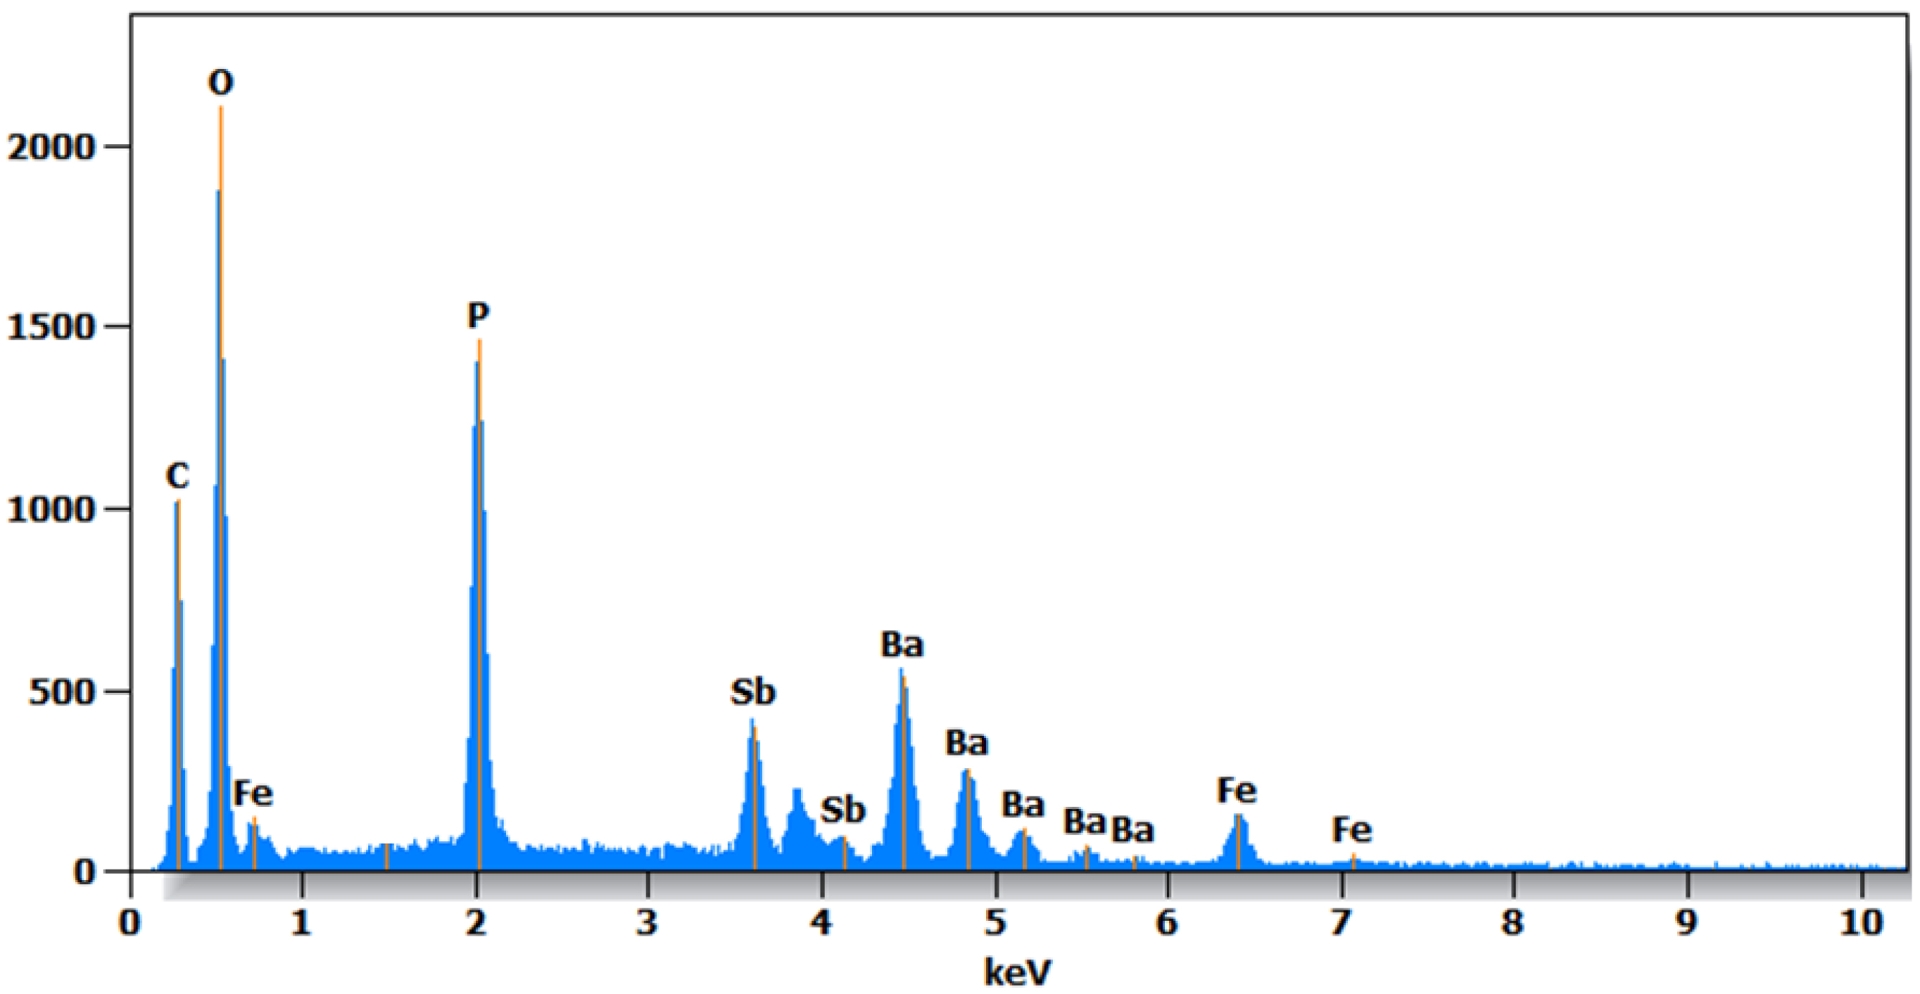
EDX composition analysis of BaSb0.5Fe0.5(PO4)2
| Element | Weight (%) | Atom (%) |
|---|---|---|
| C | 15.0 | 32.0 |
| O | 30.6 | 49.2 |
| P | 10.6 | 8.8 |
| Fe | 5.2 | 2.5 |
| Sb | 12.6 | 2.7 |
| Ba | 26.0 | 4.9 |
| Total | 100.0 | 100.0 |
3.3. Infrared and Raman study
Raman and infrared spectroscopic analyses were carried out to obtain a deeper understanding of the bonding environment within the BaSb0.5Fe0.5(PO4)2 compound. Given that its structure consists of both isolated PO4 tetrahedra and Sb(Fe)O6 octahedra, its vibrational features are characteristic of orthophosphates. The vibrational behavior of PO4 tetrahedral units is well established, and in such structures, the vibrational modes of the phosphate groups typically dominate over lattice vibrations and metal–oxygen interactions. Raman and IR spectra of the BaSb0.5Fe0.5(PO4)2 phase are given in Figures 6 and 7. The vibrational behavior of the phosphate units in the BaSb0.5Fe0.5(PO4)2 compound was investigated through infrared and Raman spectroscopic techniques. The analysis revealed distinct vibrational bands corresponding to the internal modes of the PO43− tetrahedra, consistent with expectations for well-ordered phosphate frameworks.
Infrared spectrum of BaSb0.5Fe0.5(PO4)2.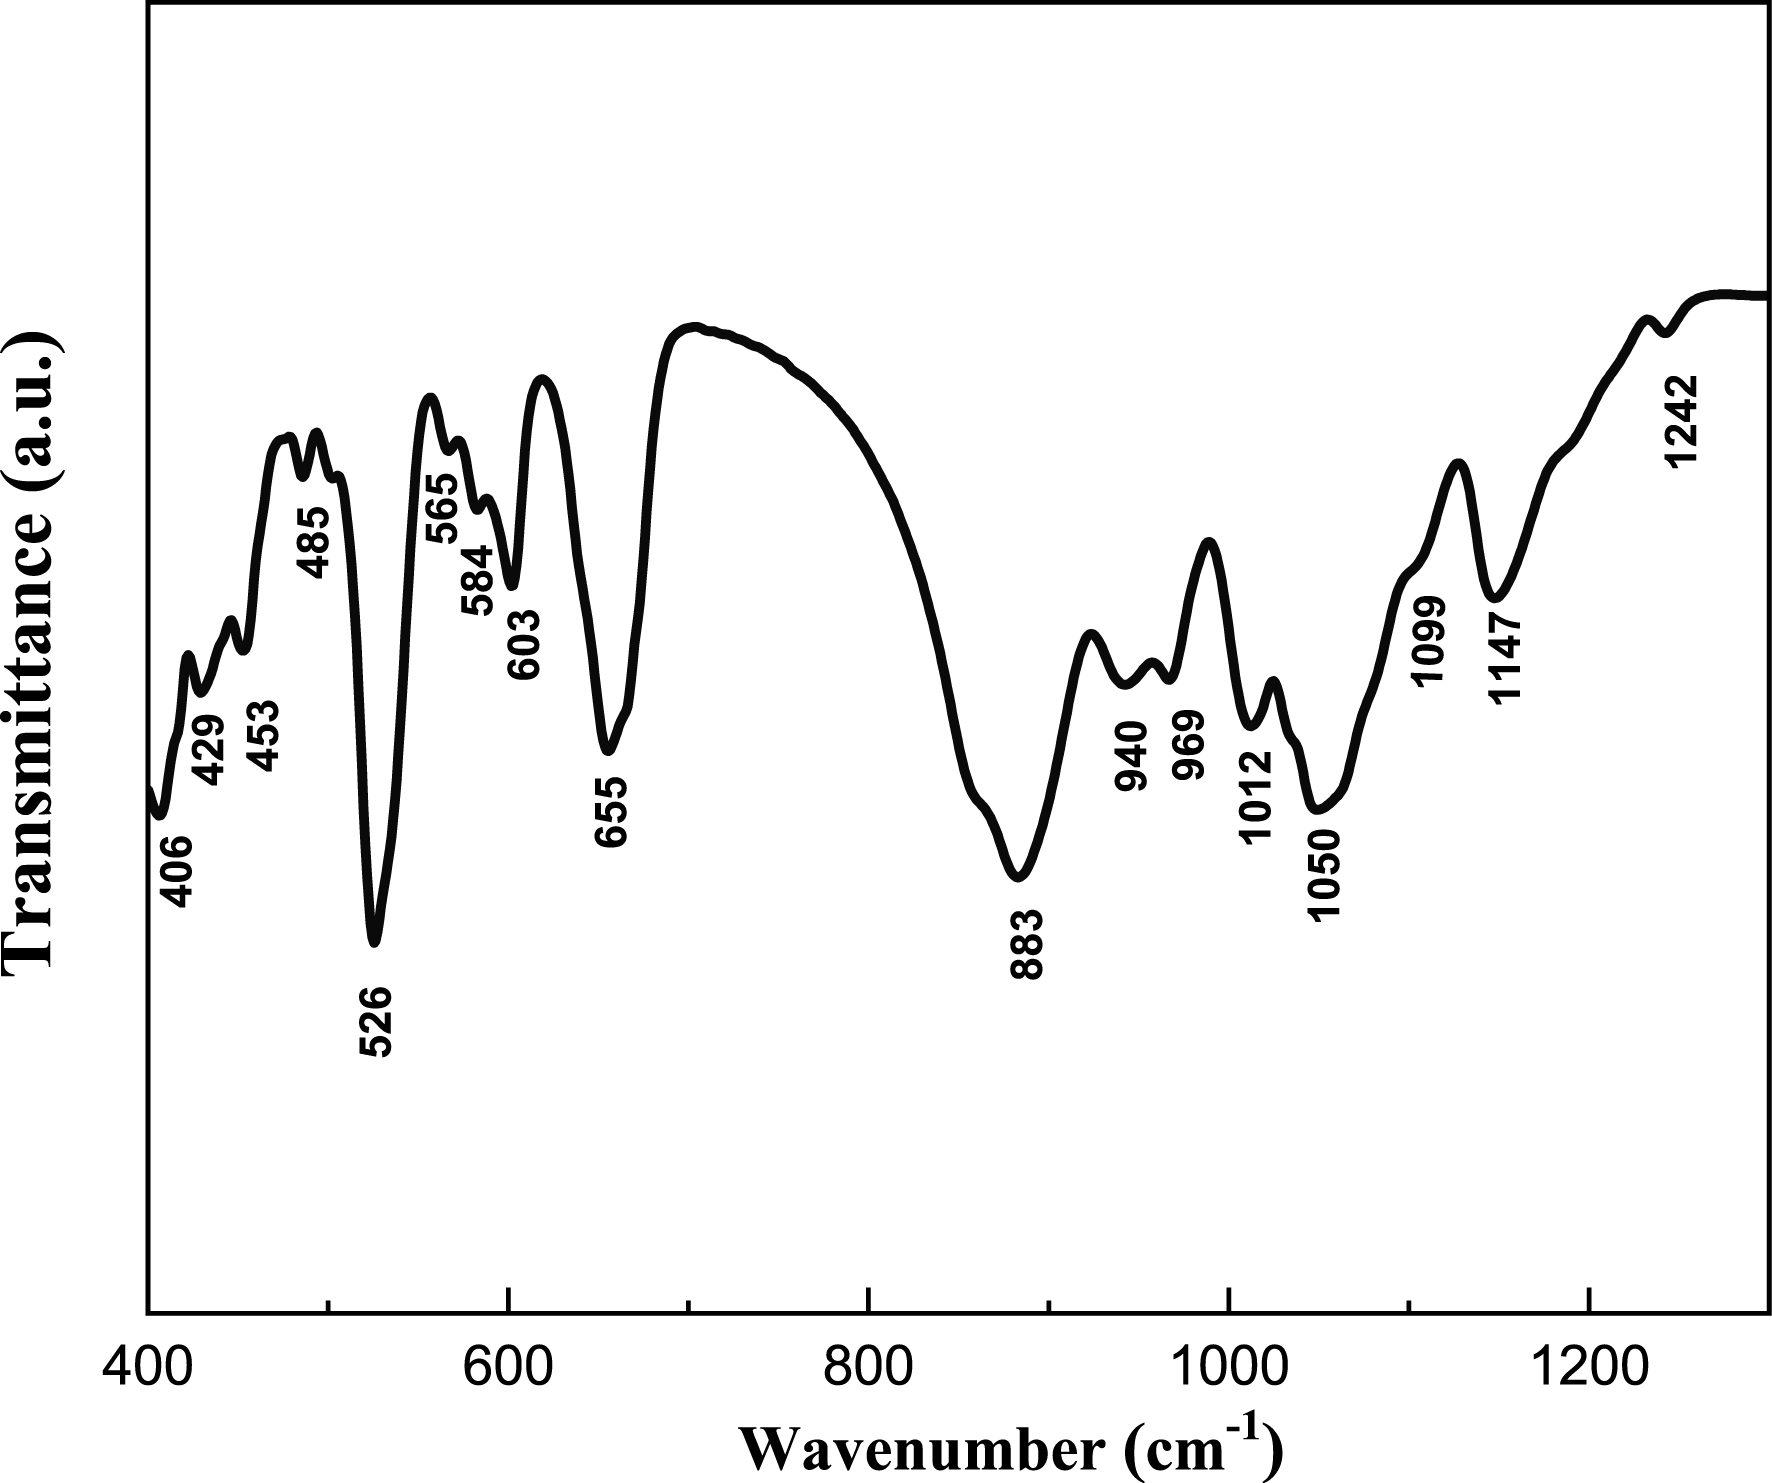
Raman spectrum of BaSb0.5Fe0.5(PO4)2.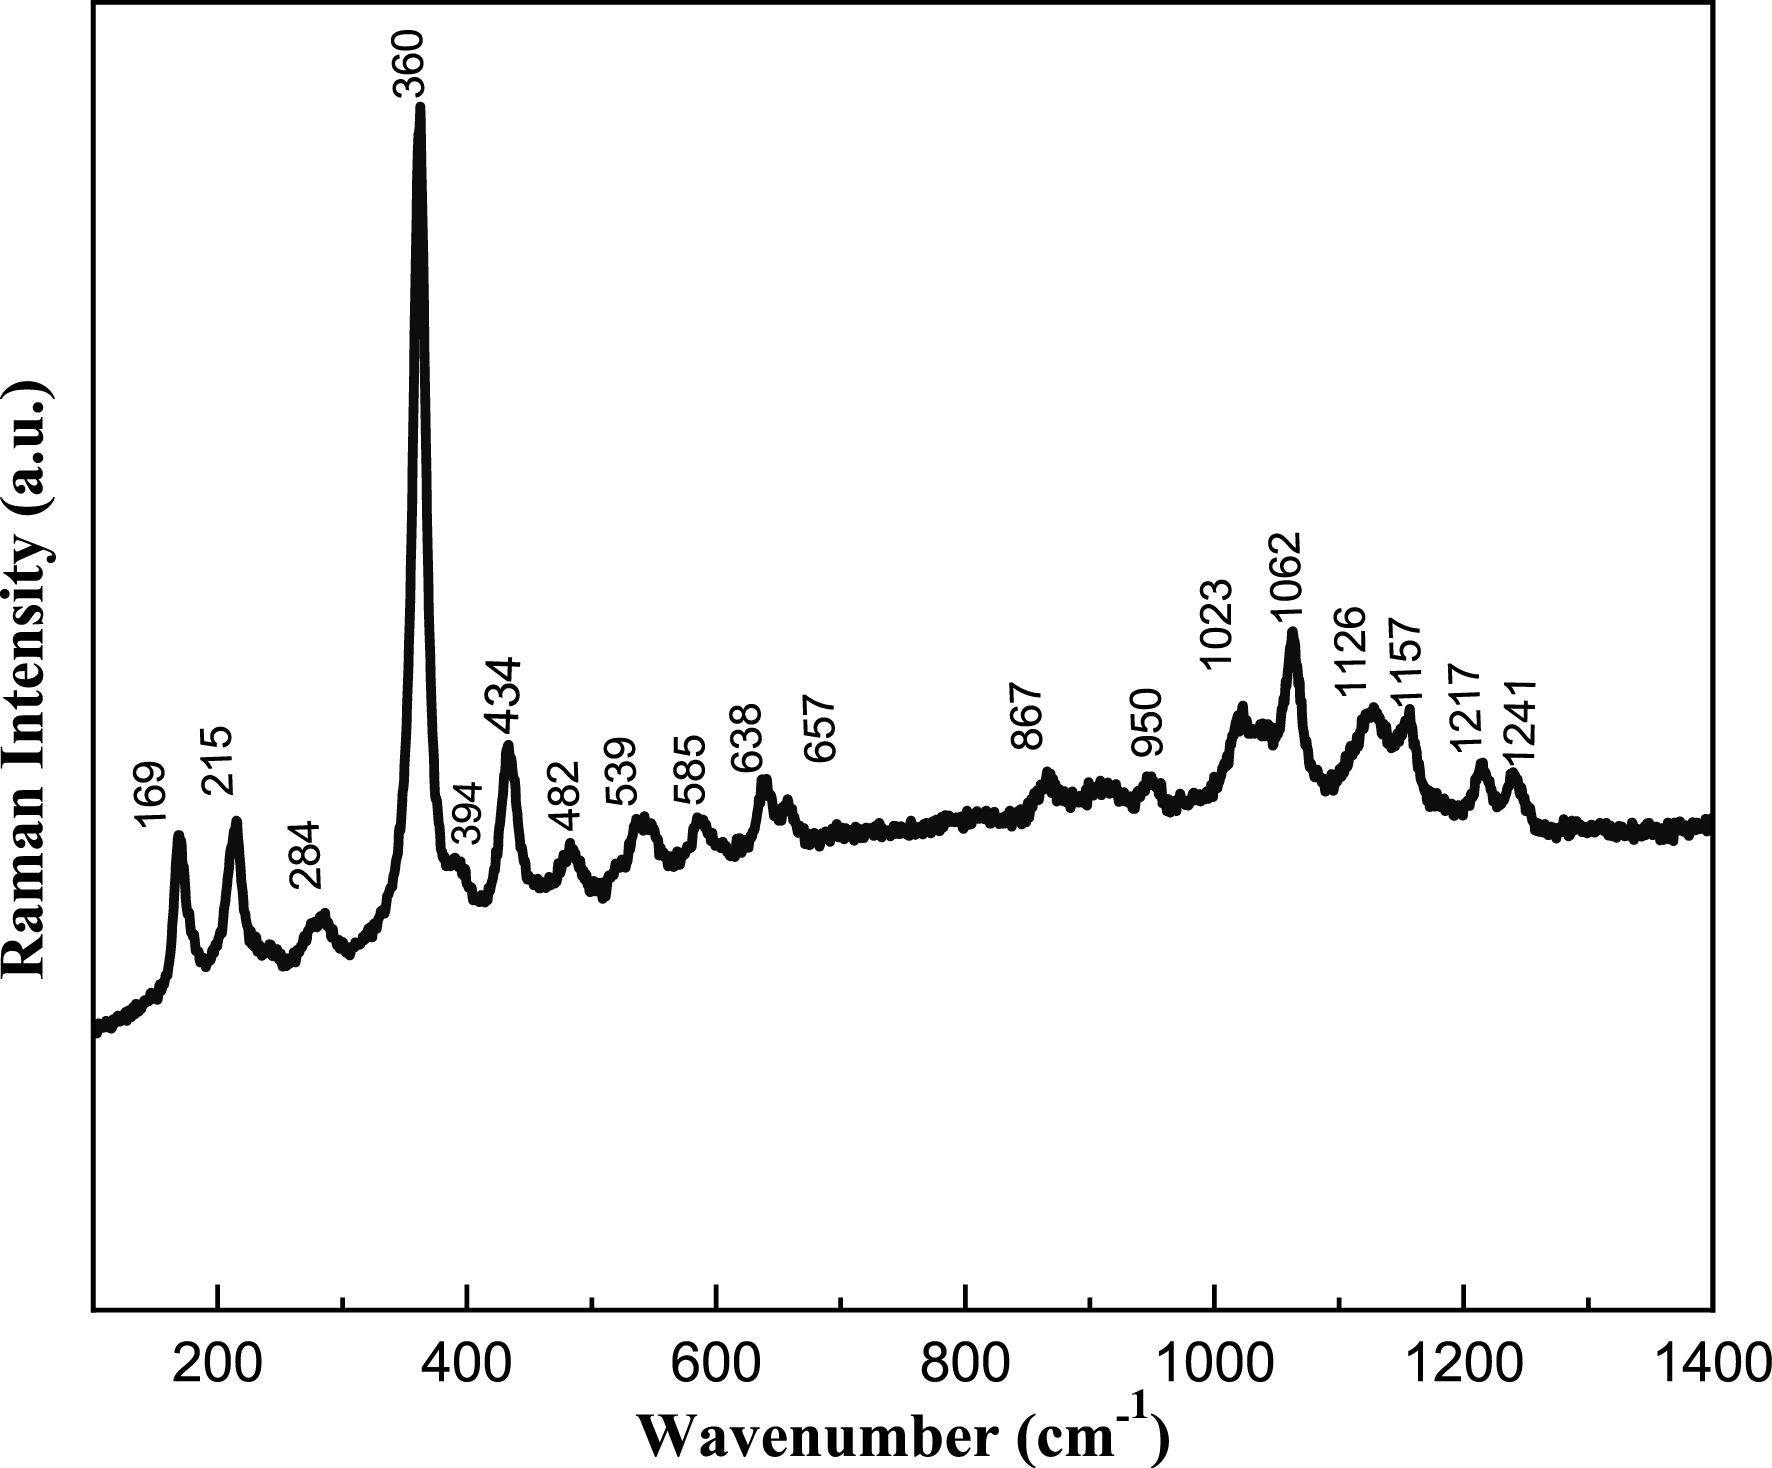
The symmetric non-degenerate stretching mode (𝜈1) of the P–O bond was clearly observed in the 918–1023 cm−1 spectral range, which is typical for isolated tetrahedral phosphate groups. This band is usually the most intense in infrared spectra and serves as a strong indicator of the presence of PO4 units.
In the low-frequency region between 429 and 485 cm−1, vibrational features were identified that correspond to the antisymmetric doubly degenerate bending modes (𝜈2) of the PO4 tetrahedra. These modes are sensitive to distortions within the tetrahedron and can reflect subtle differences in the local structural environment around the phosphate group.
The high-frequency region ranging from 1050 to 1157 cm−1 exhibited bands attributed to the triply degenerate O–P–O asymmetric stretching modes (𝜈3). The presence of these modes further confirms the integrity of the phosphate framework and the preservation of tetrahedral symmetry, albeit slightly distorted due to cation substitution.
Additionally, the bands detected in the 526–657 cm−1 region were assigned to the harmonic bending vibrations of O–P–O linkages (𝜈4). These bending modes are characteristic of internal deformations within the PO4 group and are commonly used to evaluate the degree of distortion in the tetrahedral geometry.
Altogether, the vibrational spectra confirm the presence and stability of the phosphate units within the crystal structure and support the assignment of BaSb0.5Fe0.5(PO4)2 to the yavapaiite-type framework, where the PO4 groups retain a nearly ideal tetrahedral configuration, as commonly observed in yavapaiite phosphates [12, 13, 14, 15, 16, 17, 18].
In the lattice-mode region of Raman spectra (400–50 cm−1), the translational modes of PO43− ions as well as vibrational modes of PO43− ions and BaO10 groups should be expected. At wavenumbers below 400 cm−1, coupling occurs between the different bending vibrations O–P–O, O–Ba–O, Ba–O–P. The strong Raman bands observed at 360 cm−1 may be assigned to Fe–O stretching vibration modes [20]. The low-frequency modes observed below 284 cm−1 can be easily attributed to translational modes of the Ba2+, Fe3+, Sb5+, and PO43− ions.
3.4. UV–visible analysis
The optical properties of BaSb0.5Fe0.5(PO4)2 were studied at room temperature by measuring UV–visible absorption spectra (200–800 nm) shown in Figure 8. The UV–Vis absorption spectrum of the compound reveals a pronounced and broad absorption edge in the ultraviolet region (between 200 and 300 nm). This band is mainly attributed to ligand-to-metal charge transfer transitions, primarily O2−→Fe3+, which is the main optically active center in the structure. A minor contribution from O2−→Sb5+ transitions cannot be excluded [14, 15, 16, 17, 21]. The optical spectrum of BaSb0.5Fe0.5(PO4)2 also shows three low-intensity bands centered around 750, 520, and 417 nm. According to the literature, these bands are attributed, respectively, to the forbidden transitions 6A1g (S) → 4T2g (G) (750 nm), 6A1g (S) → 4T1g (G) (520 nm), and 6A1g (S) → 4A1g (G), 4E2g (G) (417 nm) of the Fe3+ ions in octahedral sites [22].
UV–visible absorption spectrum of BaSb0.5Fe0.5(PO4)2.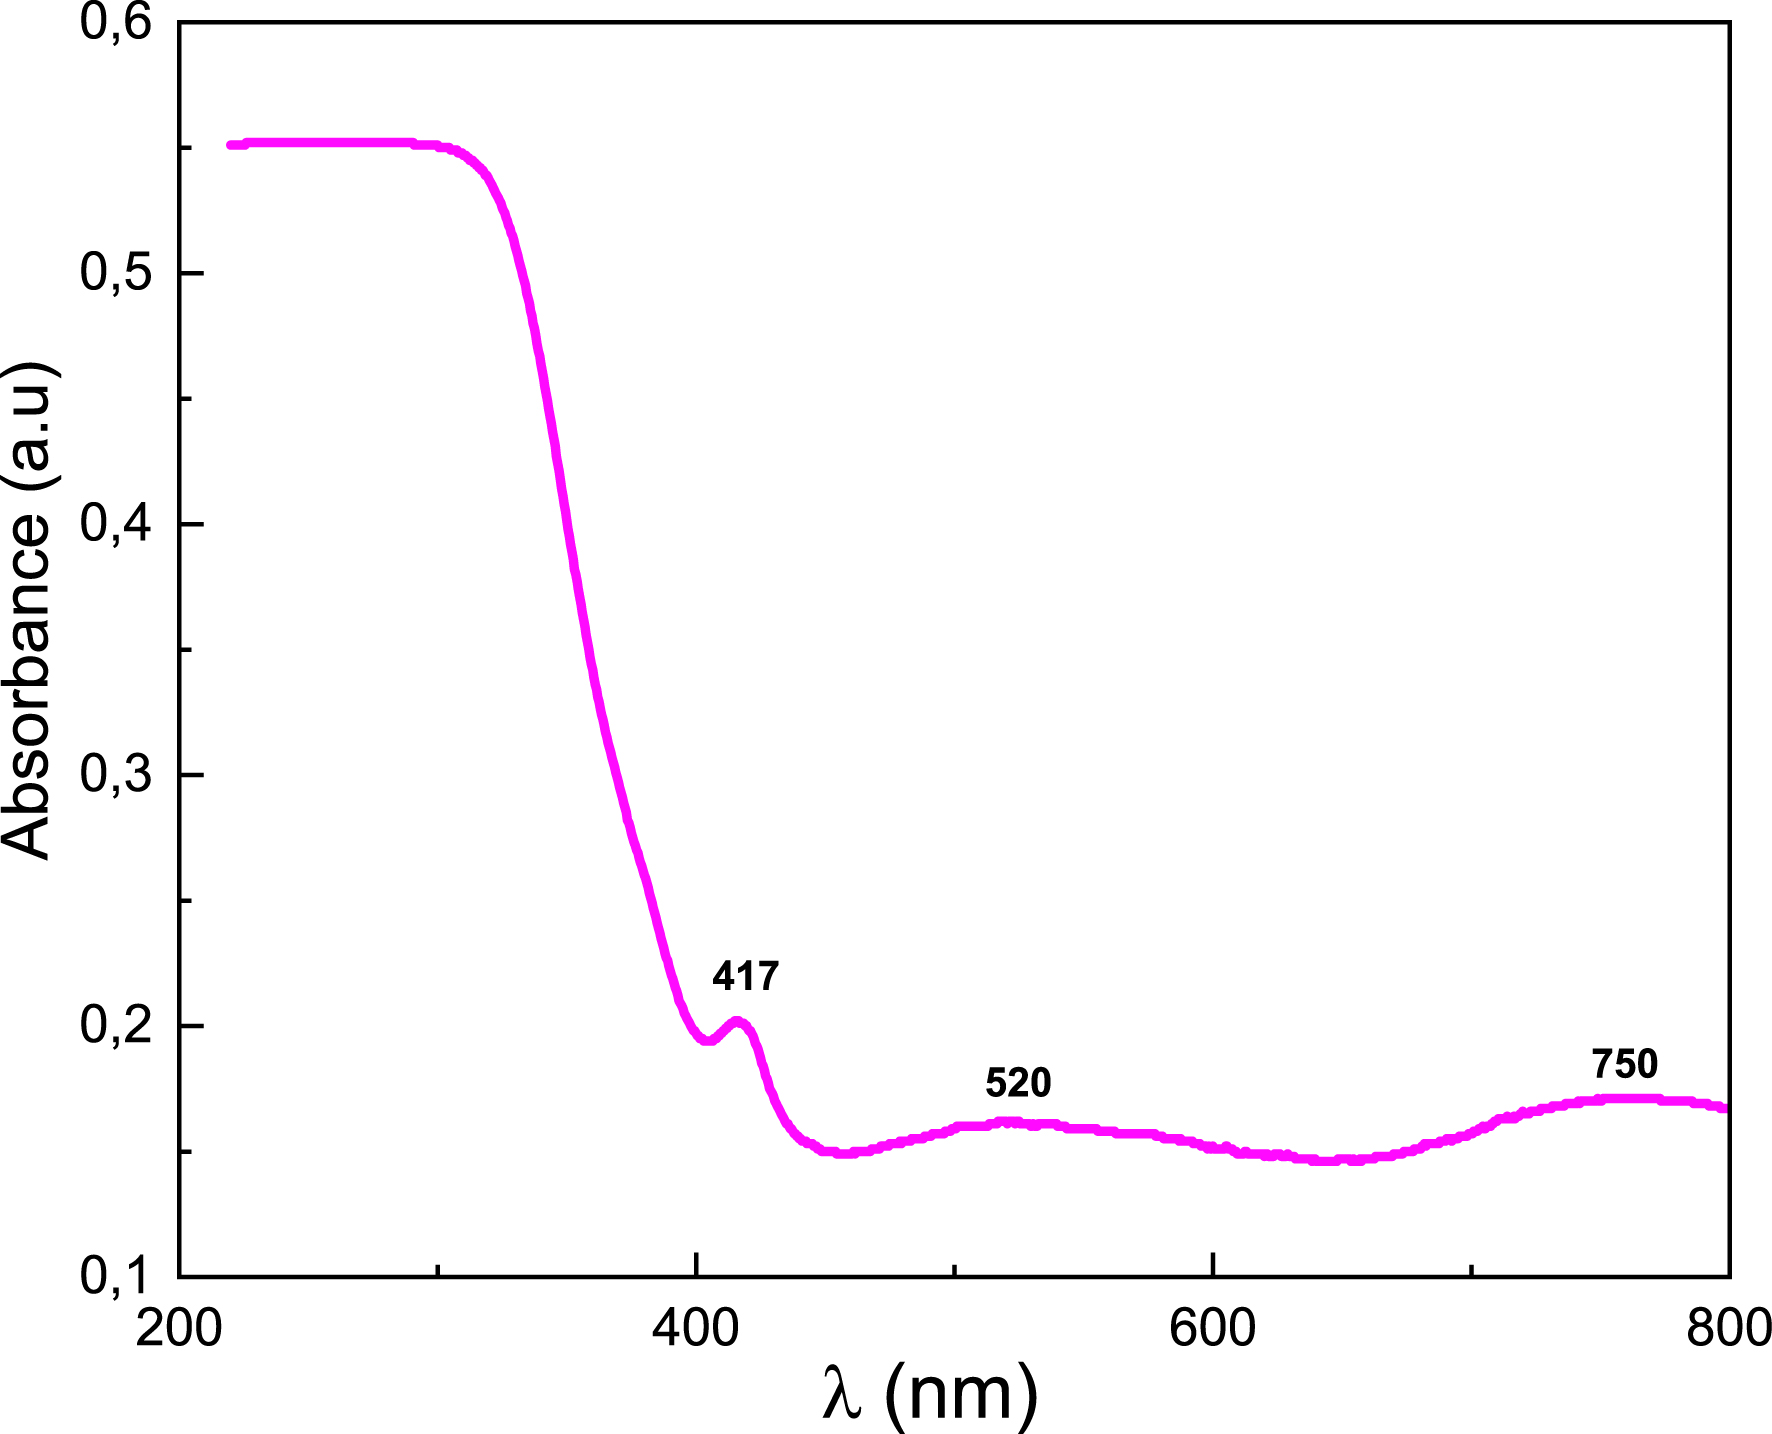
The direct or optical indirect band gap energies Eg can be calculated for the salts using the Tauc equation (Equation (1)) [23]. The absorption coefficient 𝛼 is determined using Equation (2) [24], where A and d indicate the absorbance and thickness of the cuvette used, respectively.
| \begin {eqnarray} \alpha h\nu &=& B(h\nu - E_{\mathrm {g}})^{m} \label {eq1}\end {eqnarray} | (1) |
| \begin {eqnarray} \alpha &=& (2.3003A)/d \label {eq2} \end {eqnarray} | (2) |
Figures 9 and 10 show (𝛼h𝜈)2 and (𝛼h𝜈)1/2 variation versus h𝜈 for BaSb0.5Fe0.5(PO4)2. The direct energy gap is estimated at Eg = 2.96 eV and indirect at Eg = 3.28 eV. As found elsewhere, band gaps estimated at 4.16 eV for BaZr(PO4)2 and 4.11 eV for Ba0.97Zr(PO4)2:0.03Eu3+ indicate a red shift in the optical band gap, which is attributed to the dopant Eu3+ ion generating intermediate energy levels around valence and conduction bands, leading to band gap narrowing [25]. Generally, the values obtained for gap energies indicate a semiconductor character.
Plot of (𝛼h𝜈)1/2 versus h𝜈 for BaSb0.5Fe0.5(PO4)2.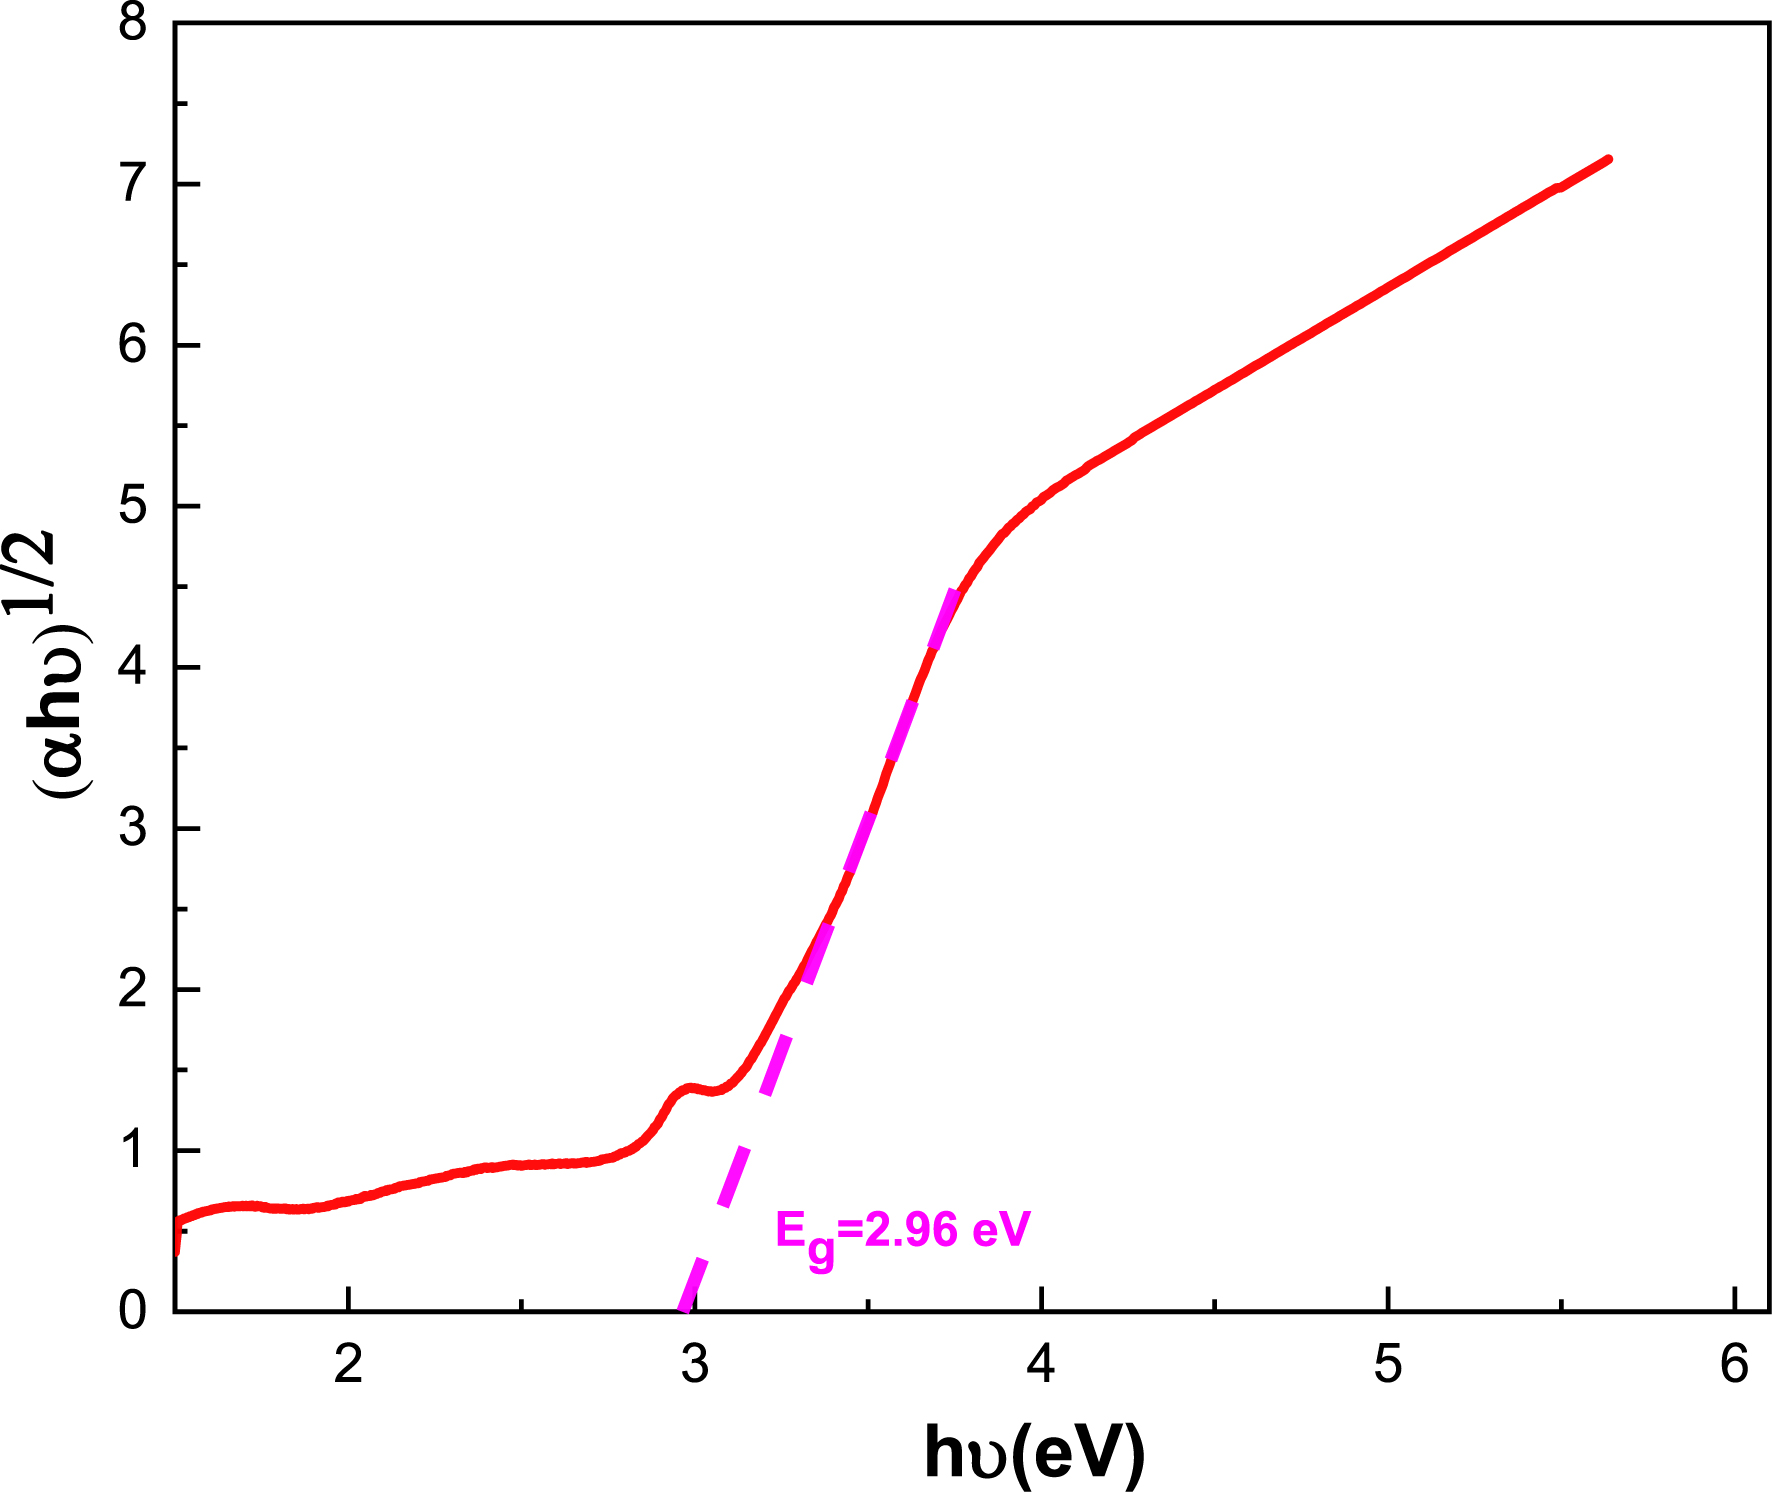
Plot of (𝛼h𝜈)2 versus h𝜈 for BaSb0.5Fe0.5(PO4)2.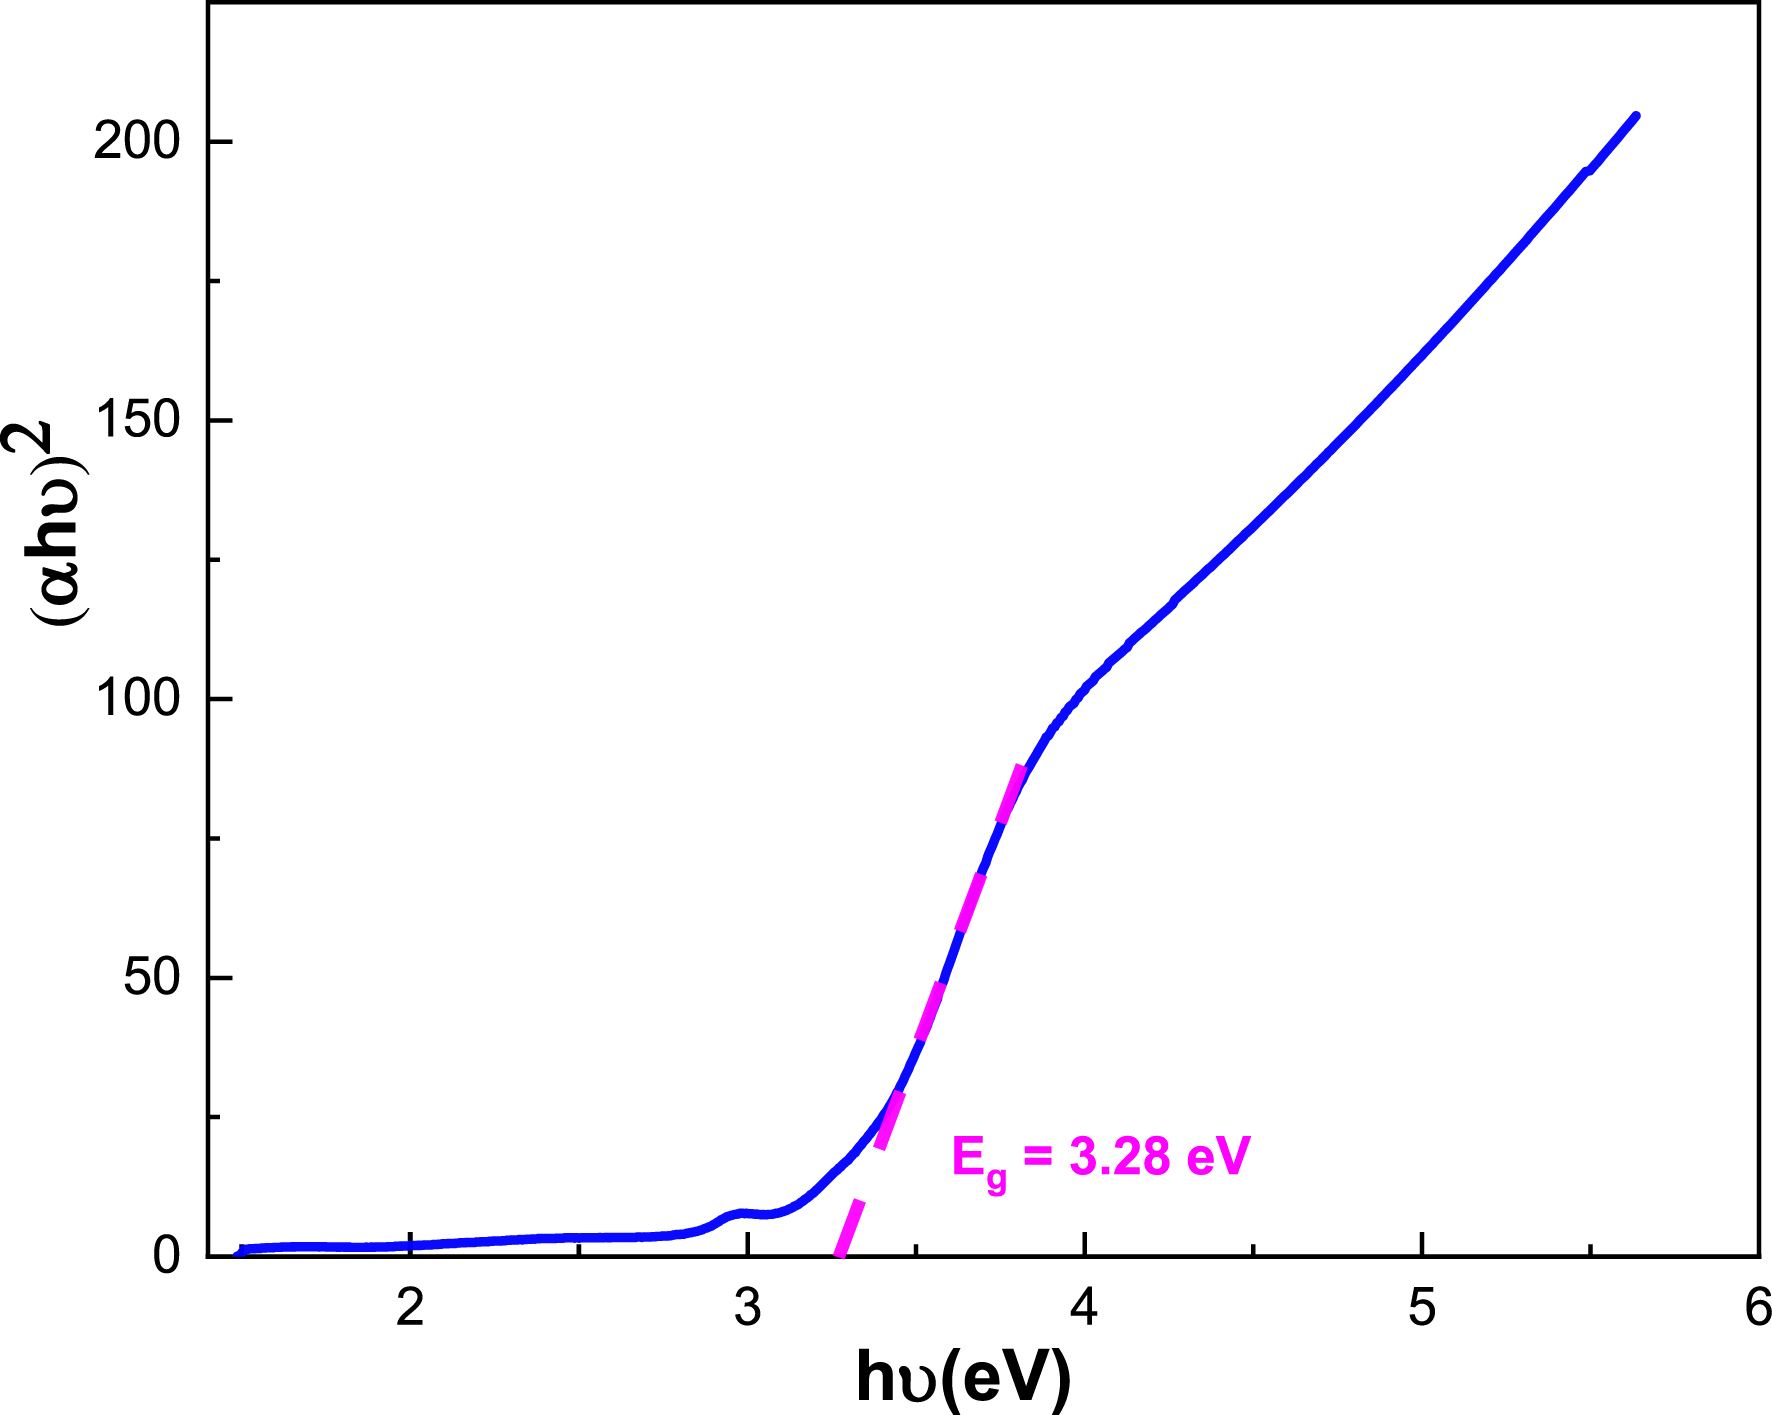
4. Conclusion
In this study, the phosphate-based compound BaSb0.5Fe0.5(PO4)2 was synthesized and structurally characterized. X-ray diffraction analysis confirmed that the compound crystallizes in the monoclinic yavapaiite-type structure, assigned to the C2/m space group with Z = 2, consistent with structural trends observed in other AIIMIV(PO4)2 systems where the cationic size ratio plays a pivotal role in stabilizing ordered polyhedral frameworks.
The vibrational studies performed using infrared and Raman spectroscopy confirmed the presence of characteristic PO43− vibrational modes. The spectral features agree with previously reported data for similar yavapaiite-type phosphates, indicating the retention of well-defined phosphate tetrahedra and supporting the structural assignment.
The optical absorption measurements revealed that BaSb0.5Fe0.5(PO4)2 exhibits a direct optical band gap of 2.96 eV and an indirect band gap of 3.28 eV, classifying it as a wide band-gap semiconducting material. These electronic characteristics suggest potential applications in optoelectronic devices, photocatalysis, or UV detection technologies.
Declaration of interests
The authors do not work for, advise, own shares in, or receive funds from any organization that could benefit from this article, and have declared no affiliations other than their research organizations.